. 2020 Dec 7;219(12):e202003020.
doi: 10.1083/jcb.202003020.

Ubiquitin chains earmark GPCRs for BBSome-mediated removal from cilia

Affiliations

Ubiquitin chains earmark GPCRs for BBSome-mediated removal from cilia

Swapnil Rohidas Shinde et al. J Cell Biol. .

Abstract

Regulated trafficking of G protein-coupled receptors (GPCRs) controls cilium-based signaling pathways. β-Arrestin, a molecular sensor of activated GPCRs, and the BBSome, a complex of Bardet-Biedl syndrome (BBS) proteins, are required for the signal-dependent exit of ciliary GPCRs, but the functional interplay between β-arrestin and the BBSome remains elusive. Here we find that, upon activation, ciliary GPCRs become tagged with ubiquitin chains comprising K63 linkages (UbK63) in a β-arrestin-dependent manner before BBSome-mediated exit. Removal of ubiquitin acceptor residues from the somatostatin receptor 3 (SSTR3) and from the orphan GPCR GPR161 demonstrates that ubiquitination of ciliary GPCRs is required for their regulated exit from cilia. Furthermore, targeting a UbK63-specific deubiquitinase to cilia blocks the exit of GPR161, SSTR3, and Smoothened (SMO) from cilia. Finally, ubiquitinated proteins accumulate in cilia of mammalian photoreceptors and Chlamydomonas cells when BBSome function is compromised. We conclude that Ub chains mark GPCRs and other unwanted ciliary proteins for recognition by the ciliary exit machinery.


Figures

Figure 1.
Figure 1.
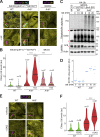
Ubiquitinated signaling receptors accumulate inside cilia of Arl6−/− cells. (A) SSTR3 fused to the fluorescent protein NG at its intracellular C terminus and a biotinylation AP tag at its extracellular N terminus was expressed under the control of an attenuated EF1α promoter (pEF1αΔ) in WT and Arl6−/− IMCD3 cells. Cells were treated with or without sst-14 (sst) for 2 h, then fixed and stained for acetylated tubulin (acTub, magenta) and Ub (yellow). APSSTR3NG (cyan) was imaged through the intrinsic fluorescence of NG. Channels are shifted in the insets to facilitate visualization of overlapping ciliary signals. Scale bars, 5 µm (main panel), 2 µm (inset). In WT cells, the ciliary SSTR3 signal decreases over the experimental time course. In Arl6−/− cells, SSTR3 fails to exit cilia, and an increase in the ciliary Ub level is detected. As a control, Arl6−/− cells that did not express SSTR3-NG were tested; no increase in ciliary Ub levels was observed upon addition of sst. (B) The fluorescence intensity of the Ub channel in the cilium was measured in each condition, and the data are represented as violin plots. The thick bar indicates the median and the dotted lines the first and third quartiles. An 11-fold increase in ciliary Ub signal is observed upon addition of sst to SSTR3-expressing cells. Asterisks indicate ANOVA significance value. ****, P ≤ 0.0001. (C) WT or Arl6−/− IMCD3 cells stably expressing APSSTR3NG and the biotin ligase BirA targeted to the ER lumen (BirA-ER) were transiently transfected with HA-tagged Ub (HA-Ub). 10 µM biotin was added to cells 24 h after transfection for maximal biotinylation of APSSTR3NG and, after another 18 h, cells were treated with sst (10 µM) for indicated times. Cells were lysed under denaturing conditions, and biotinylated SSTR3 was captured on streptavidin resin. Eluates were probed for HA via immunoblotting and for biotin via streptavidin-HRP. Two major biotinylated proteins endogenous to cells are marked by asterisks. Whole cell lysates were probed for Arl6 and, as a loading control, actin. A nonspecific band cross-reacting with the anti-Arl6 antibody is marked with a dot. (D) Quantitation of SSTR3 ubiquitination. The signals of HA-Ub conjugated to SSTR3 in the streptavidin eluates were measured. The experiment shown in C was repeated three times and for each experiment, Ub-SSTR3 signals were normalized to the value in Arl6−/− cells at time = 0 of sst stimulation and plotted as gray circles. The horizontal blue lines represent mean values. (E) IMCD3 cells of the indicated genotypes were treated with the Smoothened agonist SAG or the vehicle DMSO for 2 h. Cells were then fixed and stained for acTub and Ub. Channels are shifted in the insets to facilitate visualization of overlapping ciliary signals. Scale bars, 5 µm (main panel), 2 µm (inset). Activation of Hh signaling promotes a detectable increase in ciliary Ub levels only in Arl6−/− cells. (F) Violin plots of the fluorescence intensity of the Ub channel in the cilium in each condition are shown. Asterisks indicate ANOVA significance value. ****, P ≤ 0.0001. au, arbitrary units; MW, molecular weight; RU, relative unit.
Figure S1.
Figure S1.
Signal-dependent ubiquitination of ciliary GPCRs. (A) IMCD3 cells of the indicated genotypes expressing APSSTR3NG were treated with sst for 2 h. Cells were fixed and stained for Ub with the FK1 monoclonal antibody (Ub [FK1], yellow) and acetylated tubulin (acTub, magenta). APSSTR3NG (cyan) was imaged through the intrinsic fluorescence of NG. Channels are shifted in the insets to facilitate visualization of overlapping ciliary signals. Scale bars, 5 µm (main panel), 2 µm (inset). (B) Violin plots of the fluorescence intensity of the Ub channel in the cilium in each condition are shown. A threefold increase in ciliary Ub signal is observed upon addition of sst to SSTR3-expressing cells. Asterisks indicate ANOVA significance value. ****, P ≤ 0.0001. (C) IMCD3 cells of the indicated genotypes expressing APSSTR3NG were treated with sst for 2 h. Cells were fixed and stained for acTub (magenta) and UbK63 (yellow). APSSTR3NG (cyan) was imaged through the intrinsic fluorescence of NG. Channels are shifted in the insets to facilitate visualization of overlapping ciliary signals. Scale bars, 5 µm (main panel), 2 µm (inset). (D) The fluorescence intensity of the UbK63 channel in the cilium is represented as violin plots. Asterisks indicate ANOVA significance value. ****, P ≤ 0.0001. au, arbitrary units.
Figure 2.
Figure 2.
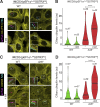
Ubiquitination of ciliary GPCRs is required for signal-dependent exit but not for endocytosis. (A) IMCD3-[pEF1αΔ-APSSTR3] cells stably expressed the BirA-ER to enable the biotinlylation of APSSTR3. SSTR3 was either the WT allele or a variant where all five cytoplasm-facing lysine residues (listed in Materials and methods) were mutated to arginine (cK0). Ciliary APSSTR3 was pulse labeled by addition of Alexa Fluor 647–conjugated mSA (mSA647) to the medium for 5–10 min before addition of sst. Far red fluorescence was tracked in individual cilia at 10-min capture intervals. For each individual cilium, fluorescence intensities were normalized to the value at time (t) = 0. A comparison of the ciliary levels of SSTR3 at t = 0 is shown in Fig. S2 A. Data were plotted and fitted to a line. Error bars, 95% CI. n = 18–22 cilia. (B) GPR161 fused to three tandem repeats of NG at its C terminus was expressed under the control of the ultra-weak pCrys in IMCD3 cells. GPR161 was either the WT allele or a variant where all 18 cytoplasm-facing lysine residues (listed in Materials and methods) were mutated to arginine (cK0). IMCD3-[pCrys-GPR1613NG] cells were treated with SAG for 2 h. During the course of the experiment, NG fluorescence was tracked in individual cilia at 10-min capture intervals. Fluorescence data were acquired and analyzed as in A. A comparison of the ciliary levels of GPR161 at t = 0 is shown in Fig. S2 B. Error bars, 95% CI. n = 10–19 cilia. (C) IMCD3-[APSSTR3; BirA-ER] cells expressing either WT or cK0 SSTR3 were pulse-labeled by addition of Alexa Fluor 647–conjugated mSA (mSA647) to the medium for 5 min before addition of sst and were imaged by far red fluorescence immediately after addition of sst (t0) and 10 min later (t10). The contrast level was adjusted to reveal plasma membrane–localized and internalized APSSTR3, causing the cilia-localized APSSTR3 signal to reach saturation. Scale bar, 5 µm. (D) Internalized APSSTR3 foci were counted immediately after addition of sst (t0) and 10 min later (t10). n = 34 cells.
Figure S2.
Figure S2.
Fluorescence intensities of WT and cK0 GPCR variants at t = 0. (A) Ciliary APSSTR3 was pulse labeled by addition of Alexa Fluor 647–conjugated mSA (mSA647) to the medium for 5–10 min before addition of sst. Violin plots of the ciliary fluorescence intensities for WT and cK0 SSTR3 imaged in the far-red channel at t = 0 are shown. n = 18–22 cilia. (B) Violin plots of the fluorescence intensities of NG fluorescence corresponding to WT and cK0 GPR161NG at t = 0 are shown. n = 10–19 cilia. RFU, relative fluorescence unit.
Figure 3.
Figure 3.
Signal-dependent accumulation of K63-linked Ub linkages inside cilia of Bbs mutant cells. (A) IMCD3 cells of the indicated genotypes expressing APSSTR3NG were treated with sst-14 for 2 h. Cells were fixed and stained for acTub (magenta) and with antibodies specific for the lysine 63 (UbK63) or lysine 48 (UbK48) Ub chain linkages (yellow). SSTR3NG (cyan) was imaged through the intrinsic fluorescence of NG. Channels are shifted in the insets to facilitate visualization of overlapping ciliary signals. Scale bar, 5 µm (main panel), 2 µm (inset). (B) The fluorescence intensities of the UbK48 and UbK63 channels in the cilium are represented as violin plots. A 14-fold increase in ciliary Ub abundance is detected with the UbK63 linkage-specific antibody. Asterisks indicate ANOVA significance value. ****, P ≤ 0.0001. No ciliary signal is detected with the UbK48 linkage-specific antibody. (C) Arl6−/− IMCD3-[APSSTR3; BirA-ER] cells were transfected with the HA-tagged Ub variants WT, noK (all seven acceptor lysine residues mutated to arginine), or K63 (where all lysine residues are mutated to arginine except for K63). Biotin was included in the culture medium, and cells were treated with sst for 0 or 10 min. Cells were lysed under denaturing conditions, and biotinylated SSTR3 was captured on streptavidin resin. Eluates were probed for HA via immunoblotting and for biotin via streptavidin-HRP. Two major biotinylated proteins endogenous to cells are marked by asterisks. Whole cell lysates were probed for Arl6 and, as a loading control, actin. A nonspecific band cross-reacting with the anti-Arl6 antibody is marked with a dot. WT IMCD3 cells were processed in parallel as a control. (D) Quantitation of SSTR3 ubiquitination. The signals of HA-Ub conjugated to SSTR3 in the streptavidin eluates were measured. The experiment shown in C was repeated four times, and for each Ub variant, Ub-SSTR3 signals were normalized to the value at t = 0 of sst stimulation and plotted as gray circles. The horizontal blue lines represent mean values. Asterisks indicate ANOVA significance value. ***, P ≤ 0.001; **, P ≤ 0.01. acTub, acetylated tubulin; ns, not significant, RU, relative unit.
Figure 4.
Figure 4.
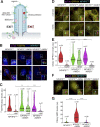
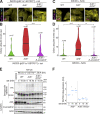
Ciliary UbK63 linkages are required for GPCR exit from cilia. (A) Diagram of the working model and the experimental strategy. (B) IMCD3-[pEF1αΔ-APSSTR3; pEF1α-BirA•ER] were transfected with plasmids expressing the ciliary targeting signal (CTS) of NPHP3 fused to GFP only (left), to GFP and the catalytic domain of the K63-specific deubiquitinase AMSH (middle), or to GFP and the catalytically inactive E280A variant of AMSH catalytic domain (AMSH; right). Ciliary APSSTR3 was pulse-labeled with mSA647 for 5–10 min, and cells were then treated with or without sst for 2 h, before fixation and staining for acetylated tubulin (acTub; magenta) and DNA (blue). The NPHP3CTS fusions were visualized through the intrinsic fluorescence of GFP (cyan) and APSSTR3 was visualized via mSA647 (yellow). Channels are shifted in the insets to facilitate visualization of overlapping ciliary signals. Scale bars, 5 µm (main panel), 2 µm (inset). (C) The fluorescence intensities of ciliary mSA647-APSSTR3 are represented as violin plots. Asterisks indicate Kruskal–Wallis test significance values. ***, P ≤ 0.001; **, P ≤ 0.01. Addition of sst triggers the exit of SSTR3 from cilia in cells transfected with the controls NPHP3CTS and NPHP3CTS-AMSH, but NPHP3CTS-AMSH blocks ciliary exit of SSTR3. (D) RPE1-hTERT (RPE) cells transfected with the indicated constructs were treated with SAG or vehicle (DMSO) for 2 h and then fixed and stained for acetylated tubulin (magenta) and GPR161 (yellow). The NPHP3CTS fusions were visualized through the intrinsic fluorescence of GFP (cyan). Channels are shifted in the insets to facilitate visualization of overlapping ciliary signals. Scale bars, 5 µm (main panel), 2 µm (inset). (E) The fluorescence intensities of ciliary GPR161 are represented as violin plots. Asterisks indicate ANOVA significance value. ****, P ≤ 0.0001. NPHP3CTS-AMSH specifically blocks the SAG-dependent exit of GPR161 from cilia. (F) IMCD3 cells transfected with the indicated constructs were fixed and stained for acetylated tubulin (magenta) and SMO (yellow). The NPHP3CTS fusions were visualized through the intrinsic fluorescence of GFP (cyan). Channels are shifted in the insets to facilitate visualization of overlapping ciliary signals. (G) The fluorescence intensities of ciliary SMO are represented as violin plots. Asterisks indicate ANOVA significance value. ****, P ≤ 0.0001. NPHP3CTS-AMSH specifically blocks the constitutive exit of SMO from cilia and promotes accumulation of SMO in cilia in the absence of pathway activation.
Figure S3.
Figure S3.
Expression levels of ciliary AMSH. IMCD3-[pEF1αΔ-APSSTR3; pEF1α-BirA•ER] cells were transfected with the plasmid expressing NPHP3CTS-AMSH as in Fig. 4, before fixation and staining for acetylated tubulin (acTub, magenta) and DNA (blue). The NPHP3CTS fusions were visualized through the intrinsic fluorescence of GFP (cyan). A representative micrograph is shown. A cell expressing modest levels of cilia-AMSH is indicated by an arrow and possesses normal ciliary staining of acetylated tubulin. A cell expressing high levels of cilia-AMSH indicated by an arrowhead displays abnormal ciliary levels of acetylated tubulin. Cells with high ciliary levels of NPHP3CTS-AMSH were excluded from the analysis, and only cells with modest ciliary levels of NPHP3CTS-AMSH were included in the experiment. Scale bars, 5 µm (main panel), 1 µm (inset).
Figure S4.
Figure S4.
Cilia-targeted AMSH removes UbK63 chains from ciliary substrates. (A) IMCD3-[pEF1αΔ-APSSTR3; pEF1α-BirA•ER] cells were transfected with control or Arl6 siRNAs. Cell lysates were immunoblotted for Arl6 or actin. A nonspecific band cross-reacting with the anti-Arl6 antibody is marked with a dot. (B) IMCD3-(APSSTR3; BirA•ER) cells were transfected with siRNA targeting Arl6 and plasmids expressing NPHP3CTS-AMSH or NPHP3CTS-AMSH. Surface-exposed APSSTR3 was pulse-labeled with mSA647 for 5–10 min, and cells were then treated with sst for 2 h before fixation and staining for UbK63 (yellow). The NPHP3CTS-AMSH fusions were visualized through the intrinsic fluorescence of GFP (cyan), APSSTR3 was visualized via mSA647 (magenta), and DNA is blue. Channels are shifted in the insets to facilitate visualization of overlapping ciliary signals. Scale bars, 5 µm (main panel), 2 µm (inset). (C) The fluorescence intensities of the UbK63 signal inside cilia are represented as violin plots. Asterisks indicate Mann–Whitney test significance value. ****, P ≤ 0.0001. au, arbitrary units; si, short interfering. MW, molecular weight.
Figure 5.
Figure 5.
β-Arrestin 2 is recruited to cilia upon activation of SSTR3 or GPR161. (A) β-Arrestin 2 is rapidly recruited to cilia upon activation of SSTR3. siRNA-treated IMCD3-[APSSTR3, β-arrestin2GFP] cells were pulse-labeled with mSA647 before addition of sst. Channels are shifted to facilitate visualization of overlapping ciliary signals. As shown previously (Shankar et al., 2010), β-arrestin 2 is at the basal body in unstimulated cells. Scale bar, 2 µm. (B) Kinetics of β-arrestin 2GFP recruitment to cilia upon sst stimulation in control- and ARL6-depleted IMCD3-[APSSTR3, β-arrestin2GFP] cells. Data were fit to a simple exponential. n = 10 cilia. (C and D) Kinetics of early trafficking events for retrieval of SSTR3 (C) and GPR161 (D). Top: Removal of stably expressed APSSTR3NG or APGPR161NG3 following addition of sst (C) or SAG (D). Bottom: The kinetics of β-arrestin 2GFP entry (C and D), APSmoothenedNG entry (D), and NG3BBS5 tip accumulation (C) measured in IMCD3 cells stably expressing the indicated proteins. Fluorescence values are normalized to the initial (t0) and final (tf) values. Error bars, SEM. n = 6–11 cilia. RFU, relative fluorescence unit; si, small interfering; t, time.
Figure 6.
Figure 6.
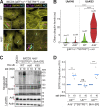
β-Arrestin 2 directs the signal-dependent ubiquitination of ciliary GPCRs. (A) IMCD3-[pEF1αΔ-APSSTR3NG] cells of the indicated genotypes were treated with sst for 2 h before fixation and staining for acetylated tubulin (acTub, magenta) and Ub (yellow). SSTR3NG was visualized through the intrinsic fluorescence of NG (cyan). Channels are shifted in the insets to facilitate visualization of overlapping ciliary signals. SSTR3 exit is blocked in Arl6−/− cells regardless of the β-Arrestin 2 genotype, but the ciliary Ub signal is only evident when β-arrestin 2 function is intact. Scale bar, 5 µm (main panel), 1 µm (inset). (B) Violin plots representing the ciliary levels of Ub under the indicated conditions. Asterisks indicate ANOVA significance value. ****, P ≤ 0.0001. (C) IMCD3 WT, knockout for Arl6 only and double knockout for Arl6 and the β-arrestin 2 gene Arrb2 were treated with SAG for 2 h before fixation and staining for acetylated tubulin (acTub, magenta) and Ub (yellow). Channels are shifted in the insets to facilitate visualization of overlapping ciliary signals. Scale bars, 5 µm (main panel), 1 µm (inset). (D) Violin plots representing the ciliary Ub levels. Asterisks indicate ANOVA significance value. ****, P ≤ 0.0001; **, P ≤ 0.01. The appearance of a Ub signal in cilia in Arl6−/− cells depends on β-arrestin 2. (E) IMCD3-[APSSTR3; BirA-ER] cells of the indicated genotypes stably expressing APSSTR3NG and BirA-ER were transfected with HA-Ub, biotin was added to the medium, and cells were treated with sst for indicated times. Biotinylated SSTR3 was captured from cell lysates under denaturing conditions on streptavidin resin. Eluates were probed for HA via immunoblotting and for biotin via streptavidin-HRP. Two major biotinylated proteins endogenous to cells are marked by asterisks. Whole cell lysates were probed for Arl6, β-arrestin 2 to verify genotypes, and as a loading control, actin. A nonspecific band cross-reacting with the anti-Arl6 antibody is marked with a dot. WT IMCD3 cells were processed in parallel as a control. (F) Quantitation of SSTR3 ubiquitination. The signals of HA-Ub conjugated to SSTR3 in the streptavidin eluates were measured. The experiment shown in E was repeated twice and for each experiment, Ub-SSTR3 signals were normalized to the value in Arl6−/− cells at time = 0 of sst stimulation and plotted as gray circles. The horizontal blue lines represent mean values. n = 2. RU, relative unit.
Figure 7.
Figure 7.
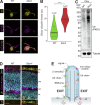
Accumulation of ubiquitinated proteins in cilia of C. rheinardtii cells and mammalian photoreceptors. (A) C. rheinardtii cells of the indicated genotypes were fixed and stained for acetylated tubulin (acTub, magenta) and Ub (yellow). Scale bar, 5 µm. A weak Ub signal detected in WT cells is increased in bbs4 mutant cells. (B) Violin plots of the ciliary Ub levels in WT and bbs4 C. rheinardtii cells. Asterisks indicate Mann–Whitney test significance values. ****, P ≤ 0.0001. The ciliary levels of Ub are increased more than twofold in bbs4 cells as compared with WT. (C) Cilia purified from WT and bbs4 cells via deciliation with dibucaine and differential centrifugation were solubilized, and the protein contents resolved by SDS-PAGE. Immunoblots for Ub (using the P4D1 antibody) and tubulin are shown. A rise in Ub conjugates is observed in bbs4 C. rheinardtii cells compared with WT. (D) Mouse retinas were fixed, embedded, and sectioned before staining for Ub (yellow, lower panel), cone arrestin (magenta, a marker of the photoreceptor outer segment layer), and DNA (cyan). OS, outer segment; IS, inner segment; ONL, outer nuclear layer; OPL, outer plexiform layer; INL, inner nuclear layer. Scale bar, 10 µm. (E) Model for the role of Ub chains in selecting cargoes for signal-dependent and constitutive exit via BBSome-mediated transport.

Comment in

References

    1. Anvarian, Z., Mykytyn K., Mukhopadhyay S., Pedersen L.B., and Christensen S.T.. 2019. Cellular signalling by primary cilia in development, organ function and disease. Nat. Rev. Nephrol. 15:199–219. 10.1038/s41581-019-0116-9 - DOI - PMC - PubMed
    1. Baker, S.A., Haeri M., Yoo P., Gospe S.M. III, Skiba N.P., Knox B.E., and Arshavsky V.Y.. 2008. The outer segment serves as a default destination for the trafficking of membrane proteins in photoreceptors. J. Cell Biol. 183:485–498. 10.1083/jcb.200806009 - DOI - PMC - PubMed
    1. Bhandari, D., Trejo J., Benovic J.L., and Marchese A.. 2007. Arrestin-2 interacts with the ubiquitin-protein isopeptide ligase atrophin-interacting protein 4 and mediates endosomal sorting of the chemokine receptor CXCR4. J. Biol. Chem. 282:36971–36979. 10.1074/jbc.M705085200 - DOI - PubMed
    1. Chiang, A.P., Beck J.S., Yen H.J., Tayeh M.K., Scheetz T.E., Swiderski R.E., Nishimura D.Y., Braun T.A., Kim K.-Y.A., Huang J., et al. . 2006. Homozygosity mapping with SNP arrays identifies TRIM32, an E3 ubiquitin ligase, as a Bardet-Biedl syndrome gene (BBS11). Proc. Natl. Acad. Sci. USA. 103:6287–6292. 10.1073/pnas.0600158103 - DOI - PMC - PubMed
    1. Corbit, K.C., Aanstad P., Singla V., Norman A.R., Stainier D.Y.R., and Reiter J.F.. 2005. Vertebrate Smoothened functions at the primary cilium. Nature. 437:1018–1021. 10.1038/nature04117 - DOI - PubMed

Publication types

MeSH terms