. 2021 Mar;108(3):377-390.
doi: 10.1007/s00223-020-00774-4. Epub 2020 Nov 13.

The Dysregulated Galectin Network Activates NF-κB to Induce Disease Markers and Matrix Degeneration in 3D Pellet Cultures of Osteoarthritic Chondrocytes

Affiliations

The Dysregulated Galectin Network Activates NF-κB to Induce Disease Markers and Matrix Degeneration in 3D Pellet Cultures of Osteoarthritic Chondrocytes

K M Pichler et al. Calcif Tissue Int. 2021 Mar.

Abstract

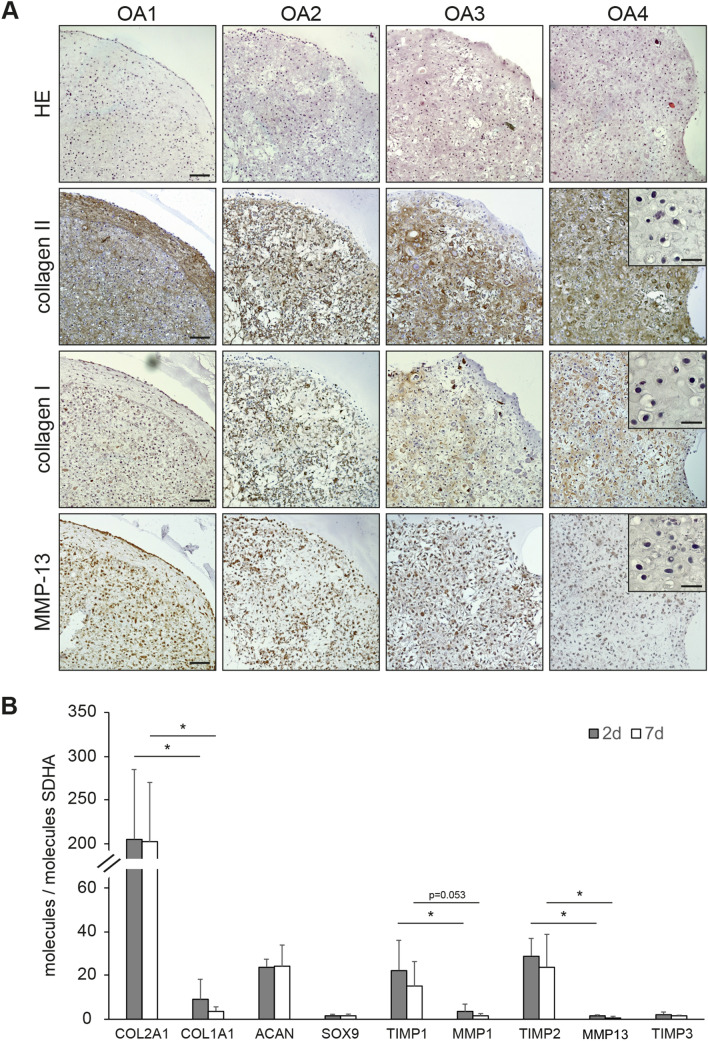
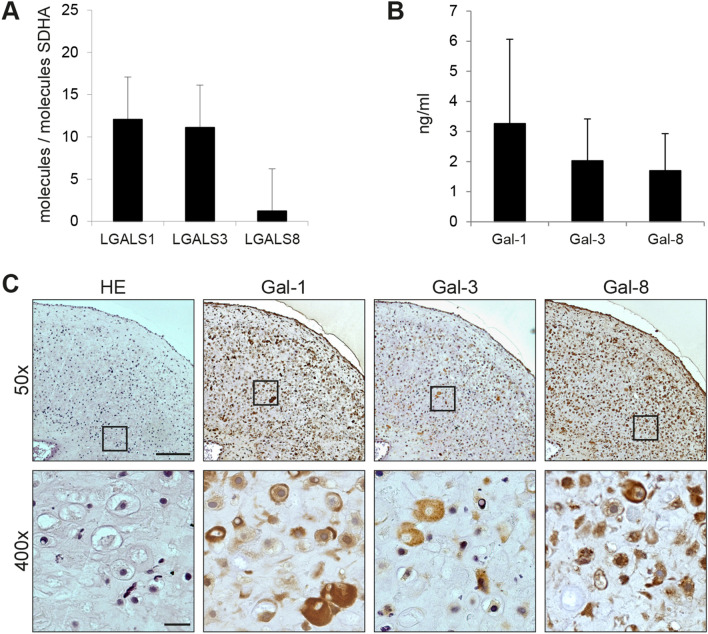
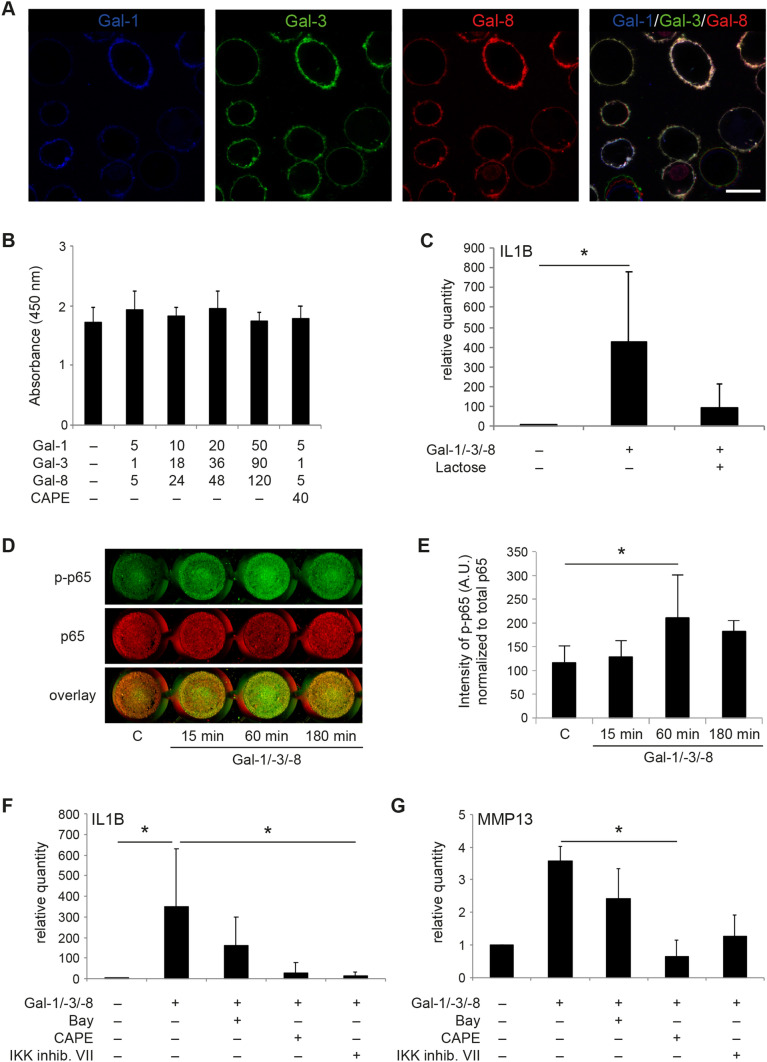
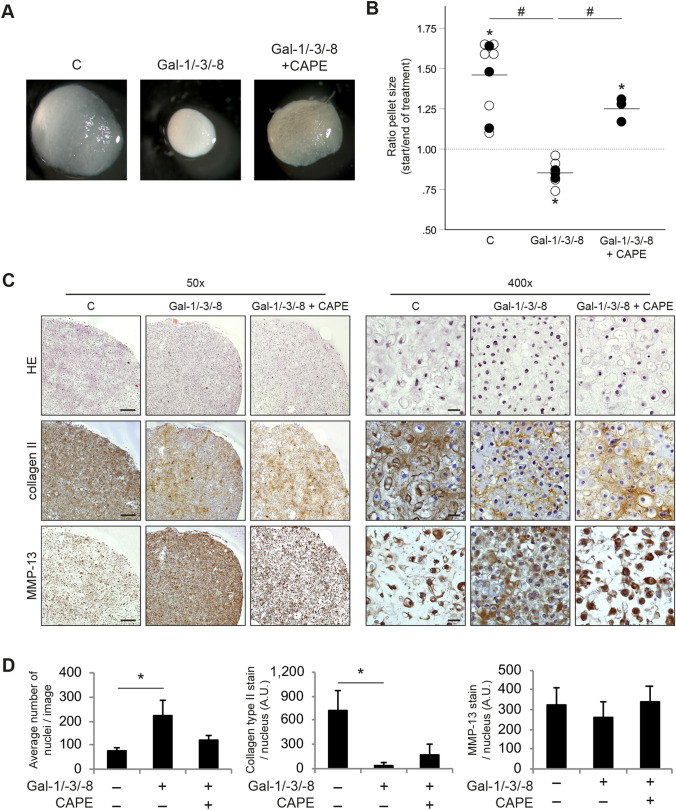
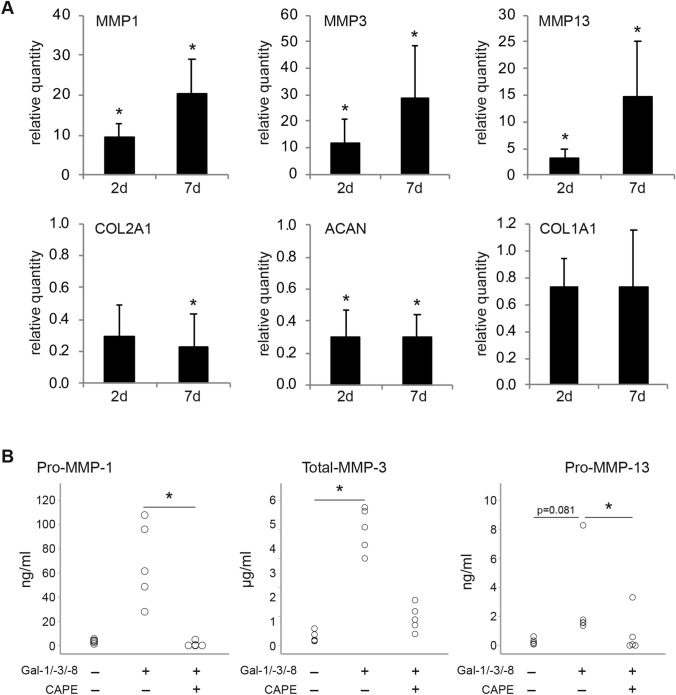
This work aimed to study the dysregulated network of galectins in OA chondrocyte pellets, and to assess whether their recently discovered activity as molecular switches of functional biomarkers results in degradation of extracellular matrix in vitro. Scaffold-free 3D pellet cultures were established of human OA chondrocytes. Expression and secretion of galectin(Gal)-1, -3, and -8 were monitored relative to 2D cultures or clinical tissue sections by RT-qPCR, immunohistochemistry and ELISAs. Exposure of 2D and 3D cultures to an in vivo-like galectin mixture (Gal-1 and Gal-8: 5 µg/ml, Gal-3: 1 µg/ml) was followed by the assessment of pellet size, immunohistochemical matrix staining, and/or quantification of MMP-1, -3, and -13. Application of inhibitors of NF-κB activation probed into the potential of intervening with galectin-induced matrix degradation. Galectin profiling revealed maintained dysregulation of Gal-1, -3, and -8 in pellet cultures, resembling the OA situation in situ. The presence of the galectin mixture promoted marked reduction of pellet size and loss of collagen type II-rich extracellular matrix, accompanied by the upregulation of MMP-1, -3, and -13. Inhibition of p65-phosphorylation by caffeic acid phenethyl ester effectively alleviated the detrimental effects of galectins, resulting in downregulated MMP secretion, reduced matrix breakdown and augmented pellet size. This study suggests that the dysregulated galectin network in OA cartilage leads to extracellular matrix breakdown, and provides encouraging evidence of the feasible inhibition of galectin-triggered activities. OA chondrocyte pellets have the potential to serve as in vitro disease model for further studies on galectins in OA onset and progression.

Keywords: 3D cell culture; Chondrocytes; Galectin; Lectin; NF-κB; Osteoarthritis.


Conflict of interest statement

K. M. Pichler, D. Weinmann, S. Schmidt, B. Kubista, R. Lass, L. Martelanz, J. Alphonsus, R. Windhager, H.-J. Gabius, S. Toegel have no conflicts of interest to disclose.

Figures

Fig. 1
Fig. 1
3D pellet cultures maintain features of the OA chondrocyte phenotype. a Consecutive histological sections of OA chondrocyte pellets from four patients (OA1-4) were stained with HE or immunohistochemically stained for collagen type II, collagen type I, or MMP-13 (3 technical replicates). Representative negative controls for each immunohistochemical staining, prepared by omission of the incubation step with primary antibody from processing, were added as insets to OA4. Scale bars: 100 µm (main images, exemplarily depicted in OA1), 20 µm (insets). b mRNA expression levels of cartilage marker genes are given as relative copy numbers with respect to the abundance of SDHA. cDNA of OA chondrocyte pellets established from specimens of four donors were analyzed using qPCR (2 technical replicates) after 2 and 7 days of culture; mean values and standard deviations are given. Significant differences between the levels of selected mRNA targets are indicated with asterisks (*p < 0.05, n = 4, paired one-sided t-test)
Fig. 2
Fig. 2
OA chondrocyte pellets express and secrete galectins. a mRNA expression levels of LGALS1, LGAL3 and LGAL8 were calculated as relative copy numbers with respect to the abundance of SDHA. cDNA of OA chondrocyte pellets obtained by culturing material from six donors was analyzed using qPCR after 7 days of culture (2 technical replicates); mean values and standard deviations are given. b Bar chart shows levels of secreted galectins (measured using ELISA) in the supernatant of OA chondrocyte pellets from four donors as mean values and standard deviations (no technical replicates). c Consecutive histological sections of OA chondrocyte pellets from three donors were stained with HE and immunohistochemically stained for Gal-1, -3 or -8 (3 technical replicates). Shown is a series of stainings of pellets from one representative patient at ×50 magnification (upper row). Areas marked with rectangles are additionally presented at ×400 magnification (bottom row). Scale bars (exemplarily depicted in HE images): 200 µm (×50), 20 µm (×400)
Fig. 3
Fig. 3
Gal-1/-3/-8 activates the NF-κB pathway in OA chondrocytes. a Localization of binding sites for fluorescent Gal-1, Gal-3, and Gal-8 on isolated chondrocytes in vitro. Cultured chondrocytes from three donors in passage 0 were trypsinized and resuspended prior to incubation with the three dye-galectin conjugates Gal-1-AlexaFluor647 (blue), Gal-3-AlexaFluor488 (green) and Gal-8-AlexaFluor555 (red) at 4 °C for 10 min. Then, cells were washed and analyzed using laser scanning microscopy. Shown is a series of images of cells from one representative patient. Scale bar: 20 μm. b Viability assay of OA chondrocytes from three donors was performed after 24 h treatment with various concentrations of Gal-1/-3/-8 in the presence or absence of CAPE (4 technical replicates). c OA chondrocytes from three donors were treated with the galectin mixture Gal-1/-3/-8 (5/1/5 µg/ml) in the absence or presence of 0.2 M lactose for 24 h. Relative quantities of IL1B mRNA levels (normalized to SDHA) were evaluated using RT-qPCR with respect to untreated control cells set to 1 (2 technical replicates). Significant differences between groups are indicated with asterisks (*p < 0.05, n = 3, Friedman test). d, e OA chondrocytes from seven patients were exposed to the galectin mixture Gal-1/-3/-8 (5/1/5 µg/ml) over time and NF-κB activation was measured by In-Cell Western (2 technical replicates). d A scan of cells from one representative patient is shown. e Signal intensities of phosphorylated p65 were normalized to total p65 and shown as mean values and standard deviations (n = 7). Significant differences to untreated control cells set to 1 are indicated with asterisks (*p < 0.05, n = 7, ANOVA with Dunnett’s post hoc test). f, g Bar charts show relative quantities (mean values and standard deviations, n = 5) of mRNA levels of IL1B (f) and MMP-13 (g), measured using RT-qPCR (2 technical replicates) with untreated control values set to 1. The galectin mixture Gal-1/-3/-8 (5/1/5 µg/ml) and a distinct concentration of each of the NF-κB inhibitors (4 µM Bay 11-7082, 40 µM CAPE, or 4 µM IKK inhibitor VII) were present in the medium for 24 h (n = 5 patients). Significant differences between groups are indicated with asterisks (*p < 0.05, n = 5, Friedman test)
Fig. 4
Fig. 4
Extracellular matrix degeneration in OA chondrocytes pellets after treatment with the galectin mixture Gal-1/-3/-8 and CAPE. a OA chondrocyte pellets from five donors were cultured for 3 weeks followed by 2 weeks of treatment with Gal-1/-3/-8 (5/1/5 µg/ml) in the absence or presence of CAPE (40 µM). Untreated pellets were used as control (c). Shown are macroscopic pictures of OA chondrocyte pellets from one representative patient. b Shown is the ratio of the pellet size between start (day 21) and end of treatment (day 35). Pellets were treated with Gal-1/-3/-8 (n = 7 patients), or with Gal-1/-3/-8 + CAPE (n = 3 patients). Control pellets were left untreated (n = 9 patients). Each circle represents one patient. Full circles illustrate the three cell populations that were cultured under all three conditions. Lines indicate the mean values of each group. The dashed line marks the ratio of 1, indicating a hypothetical stable pellet size during treatment. Asterisks indicate statistical significant difference of a group compared to a value of 1 (“stable size”; two-sided t-test, p < 0.05). Hash signs indicate significant differences between groups (ANOVA with Tukey post hoc test, p < 0.05). c Consecutive histological sections of OA chondrocyte pellets from three donors were stained with HE, or with anti-collagen type II and anti-MMP-13 antibodies (3 technical replicates; left panel, ×50 magnification; right panel, ×400 magnification). Shown is a series of stainings of pellets from one representative patient. Scale bars (exemplarily depicted in images of untreated control pellets): 200 µm (×50), 20 µm (×400). d Bar charts show the average number of nuclei (left graph), signal intensity of collagen type II-staining normalized to the number of nuclei (middle graph), and signal intensity of MMP-13 staining normalized to the number of nuclei (right graph) across three patients (5 technical replicates). Significant differences between the groups are indicated with asterisks (*p < 0.05, n = 3, Friedman test)
Fig. 5
Fig. 5
OA markers are modulated in OA chondrocyte pellets after treatment with the mixture of Gal-1/-3/-8 (5/1/5 µg/ml). a Bar charts show the relative quantities of mRNA levels of MMP-1, MMP-3, MMP-13, COL2A1, ACAN, and COL1A1 (measured using RT-qPCR; 2 technical replicates) in pellets treated with the galectin mixture for either 2 (2 days; n = 4 patients) or 7 days (7 days; n = 5 patients). Significant differences to experimental data of untreated control pellets set to 1 (not shown) are indicated with asterisks (*p < 0.05, n = 4 or 5, paired t-test). Paired t-tests of MMP-1, MMP-3, MMP-13, COL2A1 and ACAN mRNA data were performed by one-sided testing, since previous studies had proven one-sided regulation of these genes after galectin treatment [–21]. COL1A1 data were analyzed by two-sided testing. b After 2 weeks of treatment (i.e., at the time of histological evaluation), an additional set of pellets (n = 5 patients) was used for ELISA (no technical replicates) analyses, to determine the effect of CAPE. Dot plots show the concentrations of pro-MMP-1, total-MMP-3, and pro-MMP-13 in the supernatants of OA chondrocyte pellets (secreted within 48 h), treated with the galectin mixture Gal-1/-3/-8 (5/1/5 µg/ml) in the presence or absence of CAPE (40 µM). Significant differences between groups are indicated with asterisks (*p < 0.05, n = 5, Friedman test)

Similar articles

Cited by

References

    1. Salmon JH, Rat AC, Sellam J, et al. Economic impact of lower-limb osteoarthritis worldwide: a systematic review of cost-of-illness studies. Osteoarthr Cartil. 2016;24:1500–1508. doi: 10.1016/j.joca.2016.03.012. - DOI - PubMed
    1. Chen D, Shen J, Zhao W, et al. Osteoarthritis: toward a comprehensive understanding of pathological mechanism. Bone Res. 2017;5:16044. doi: 10.1038/boneres.2016.44. - DOI - PMC - PubMed
    1. Ghouri A, Conaghan PG. Prospects for therapies in osteoarthritis. Calcif Tissue Int. 2020;386:1–12. doi: 10.1007/s00223-020-00672-9. - DOI - PMC - PubMed
    1. Ratneswaran A, Rockel JS, Kapoor M. Understanding osteoarthritis pathogenesis: a multiomics system-based approach. Curr Opin Rheumatol. 2020;32:80–91. doi: 10.1097/BOR.0000000000000680. - DOI - PubMed
    1. Nickien M, Heuijerjans A, Ito K, van Donkelaar CC. Comparison between in vitro and in vivo cartilage overloading studies based on a systematic literature review. J Orthop Res. 2018;36:2076–2086. doi: 10.1002/jor.23910. - DOI - PMC - PubMed