. 2020 Nov 12;183(4):935-953.e19.
doi: 10.1016/j.cell.2020.09.057.

Integrated Morphoelectric and Transcriptomic Classification of Cortical GABAergic Cells

Nathan W Gouwens  1 Staci A Sorensen  2 Fahimeh Baftizadeh  3 Agata Budzillo  3 Brian R Lee  3 Tim Jarsky  3 Lauren Alfiler  3 Katherine Baker  3 Eliza Barkan  3 Kyla Berry  3 Darren Bertagnolli  3 Kris Bickley  3 Jasmine Bomben  3 Thomas Braun  4 Krissy Brouner  3 Tamara Casper  3 Kirsten Crichton  3 Tanya L Daigle  3 Rachel Dalley  3 Rebecca A de Frates  3 Nick Dee  3 Tsega Desta  3 Samuel Dingman Lee  3 Nadezhda Dotson  3 Tom Egdorf  3 Lauren Ellingwood  3 Rachel Enstrom  3 Luke Esposito  3 Colin Farrell  3 David Feng  3 Olivia Fong  3 Rohan Gala  3 Clare Gamlin  3 Amanda Gary  3 Alexandra Glandon  3 Jeff Goldy  3 Melissa Gorham  3 Lucas Graybuck  3 Hong Gu  3 Kristen Hadley  3 Michael J Hawrylycz  3 Alex M Henry  3 DiJon Hill  3 Madie Hupp  3 Sara Kebede  3 Tae Kyung Kim  3 Lisa Kim  3 Matthew Kroll  3 Changkyu Lee  3 Katherine E Link  3 Matthew Mallory  3 Rusty Mann  3 Michelle Maxwell  3 Medea McGraw  3 Delissa McMillen  3 Alice Mukora  3 Lindsay Ng  3 Lydia Ng  3 Kiet Ngo  3 Philip R Nicovich  3 Aaron Oldre  3 Daniel Park  3 Hanchuan Peng  3 Osnat Penn  3 Thanh Pham  3 Alice Pom  3 Zoran Popović  5 Lydia Potekhina  3 Ramkumar Rajanbabu  3 Shea Ransford  3 David Reid  3 Christine Rimorin  3 Miranda Robertson  3 Kara Ronellenfitch  3 Augustin Ruiz  3 David Sandman  3 Kimberly Smith  3 Josef Sulc  3 Susan M Sunkin  3 Aaron Szafer  3 Michael Tieu  3 Amy Torkelson  3 Jessica Trinh  3 Herman Tung  3 Wayne Wakeman  3 Katelyn Ward  3 Grace Williams  3 Zhi Zhou  3 Jonathan T Ting  3 Anton Arkhipov  3 Uygar Sümbül  3 Ed S Lein  3 Christof Koch  3 Zizhen Yao  3 Bosiljka Tasic  3 Jim Berg  3 Gabe J Murphy  6 Hongkui Zeng  3
Affiliations

Integrated Morphoelectric and Transcriptomic Classification of Cortical GABAergic Cells

Nathan W Gouwens et al. Cell. .

Abstract

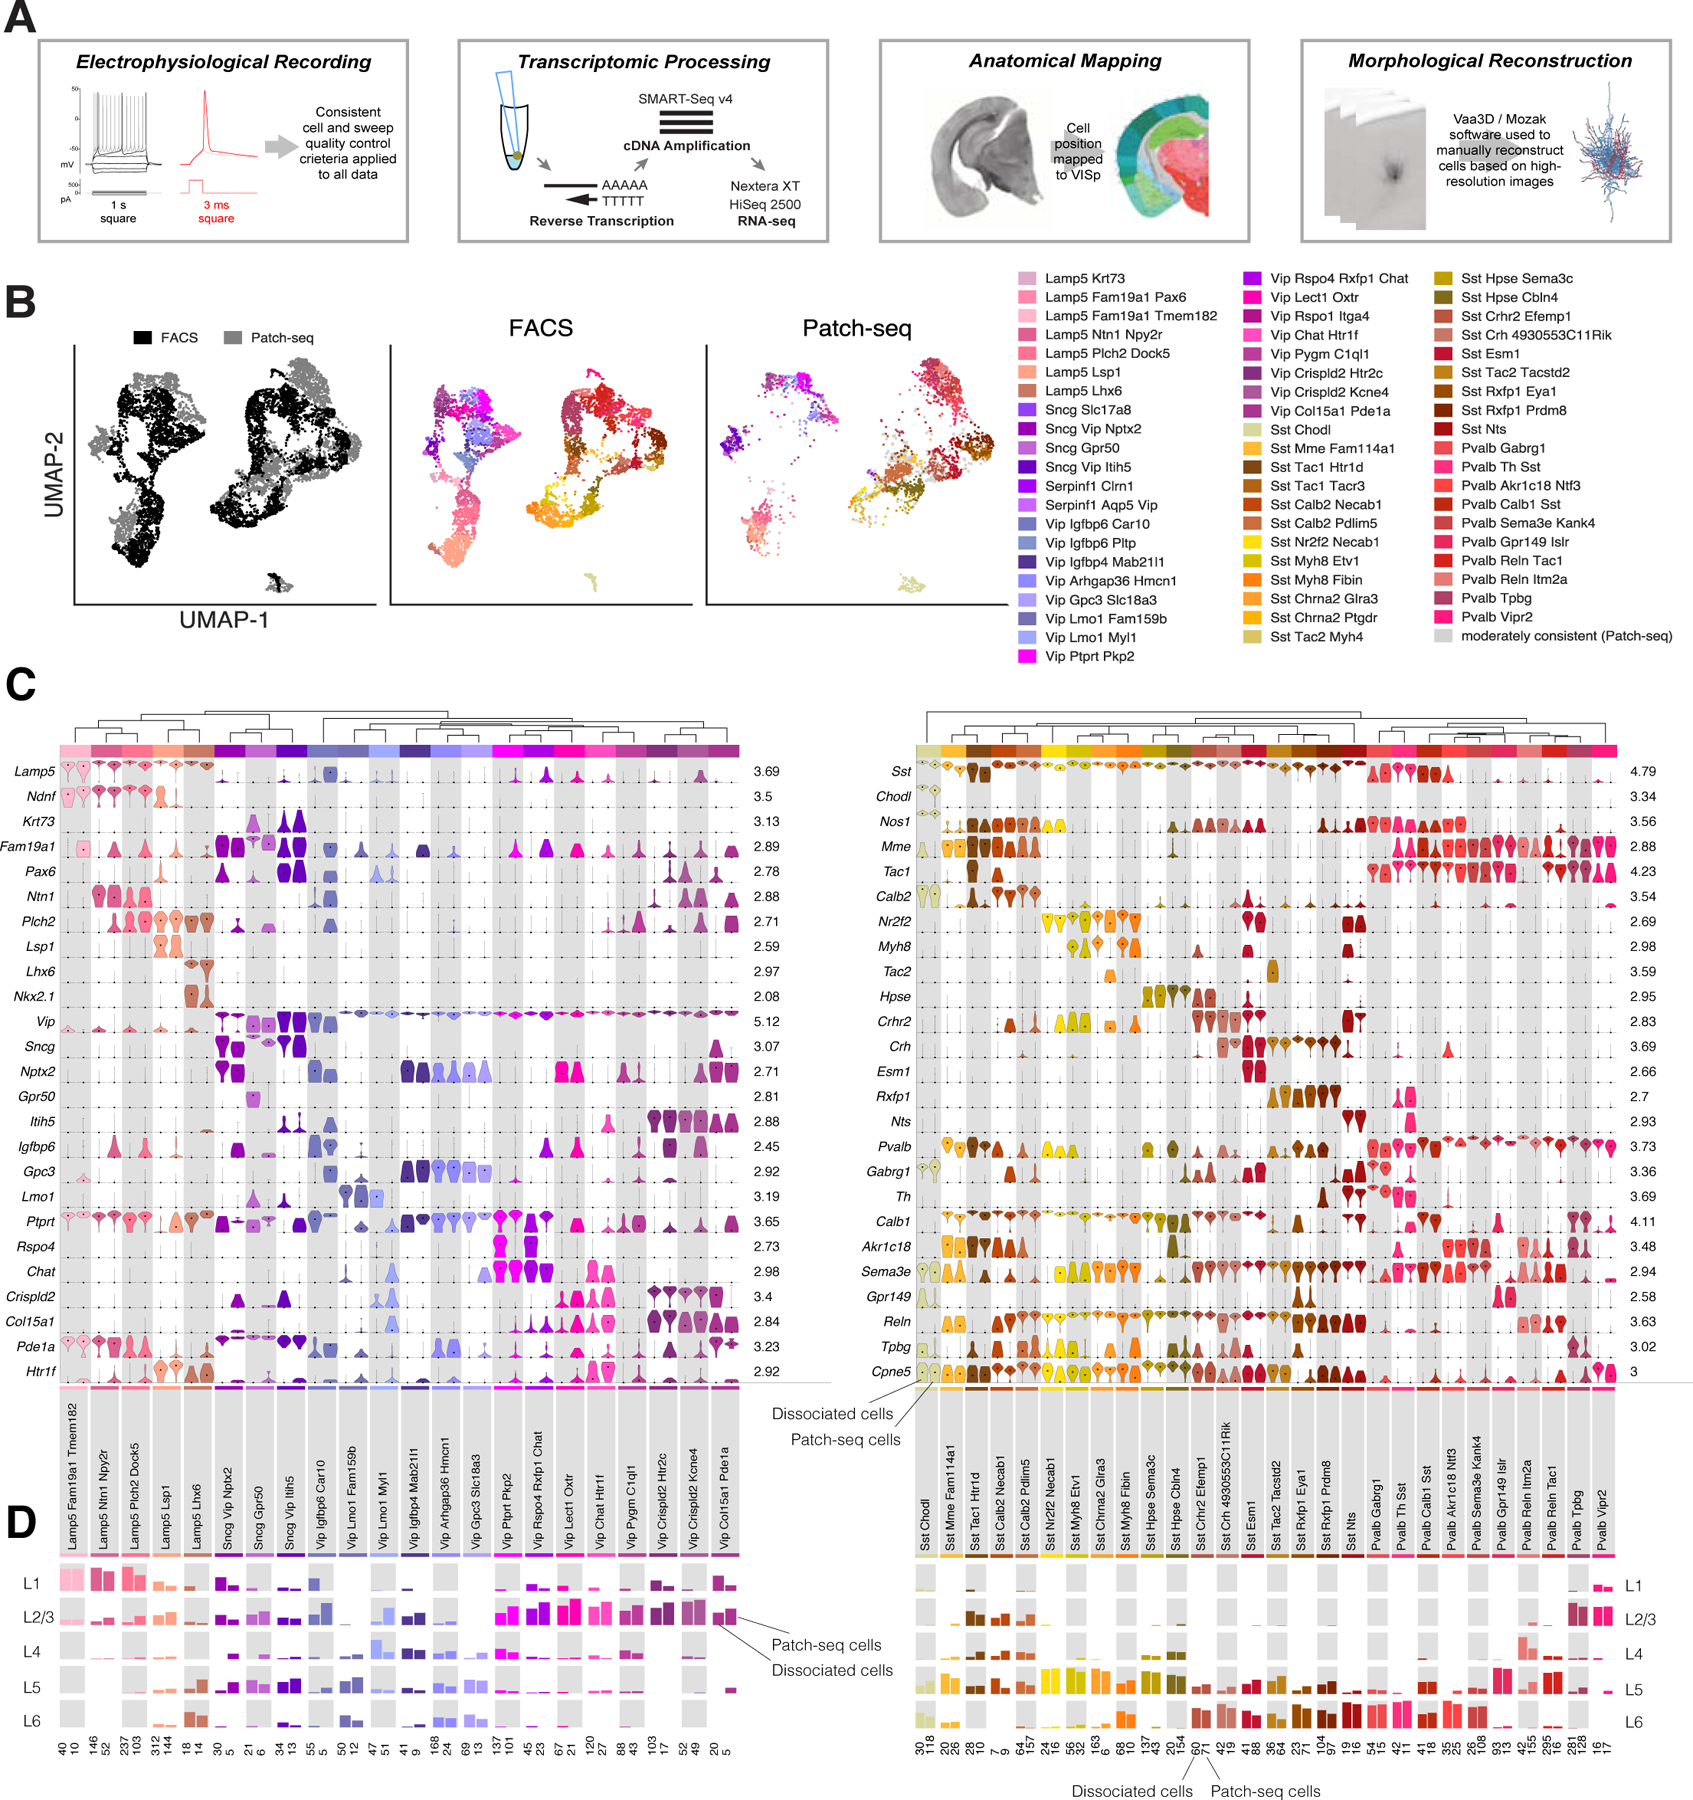
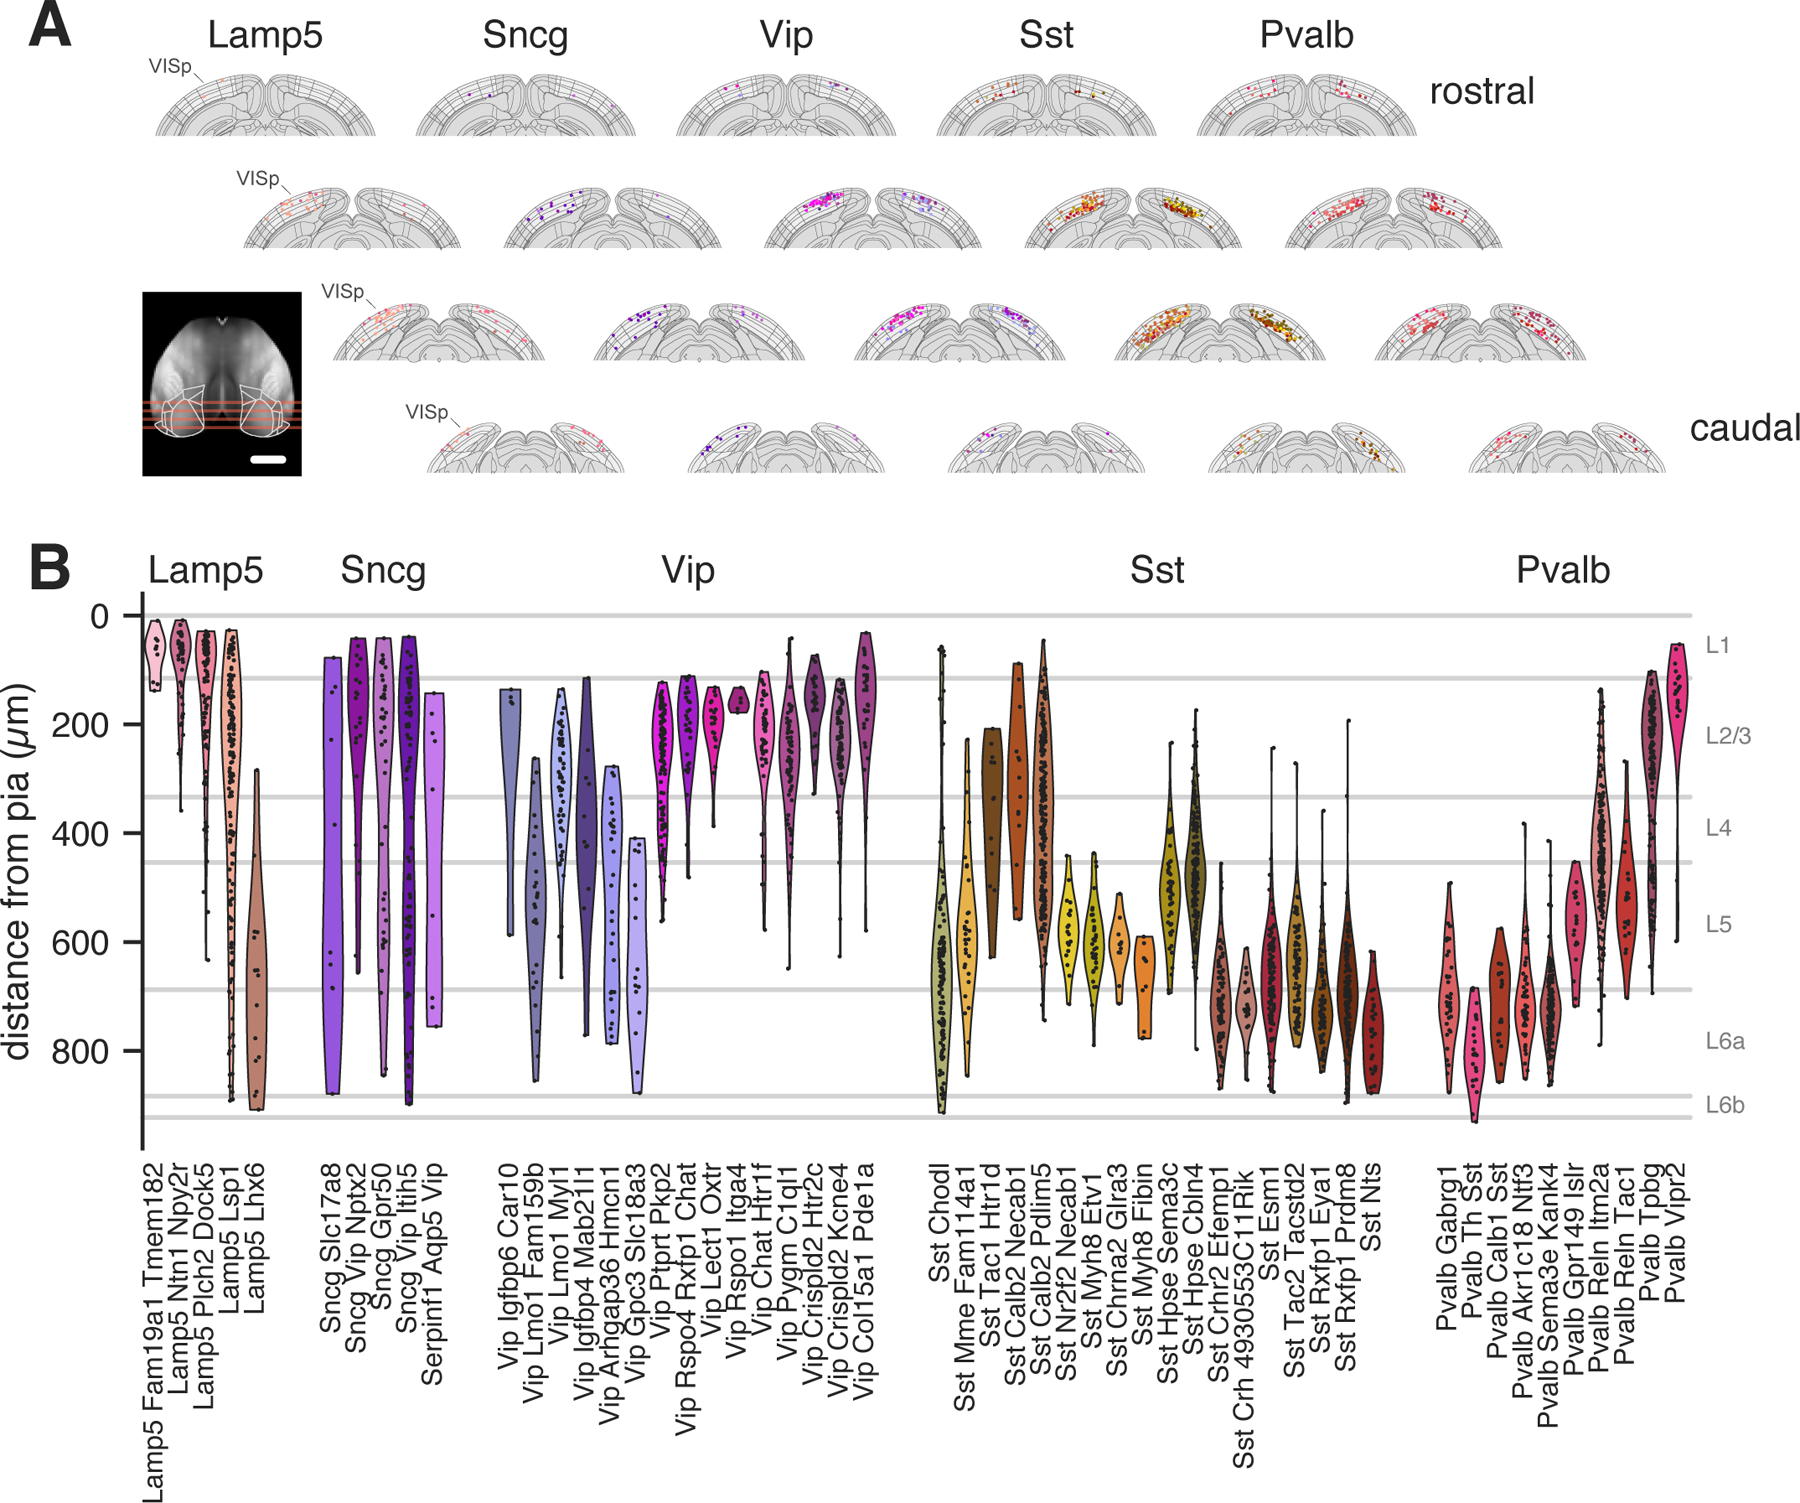
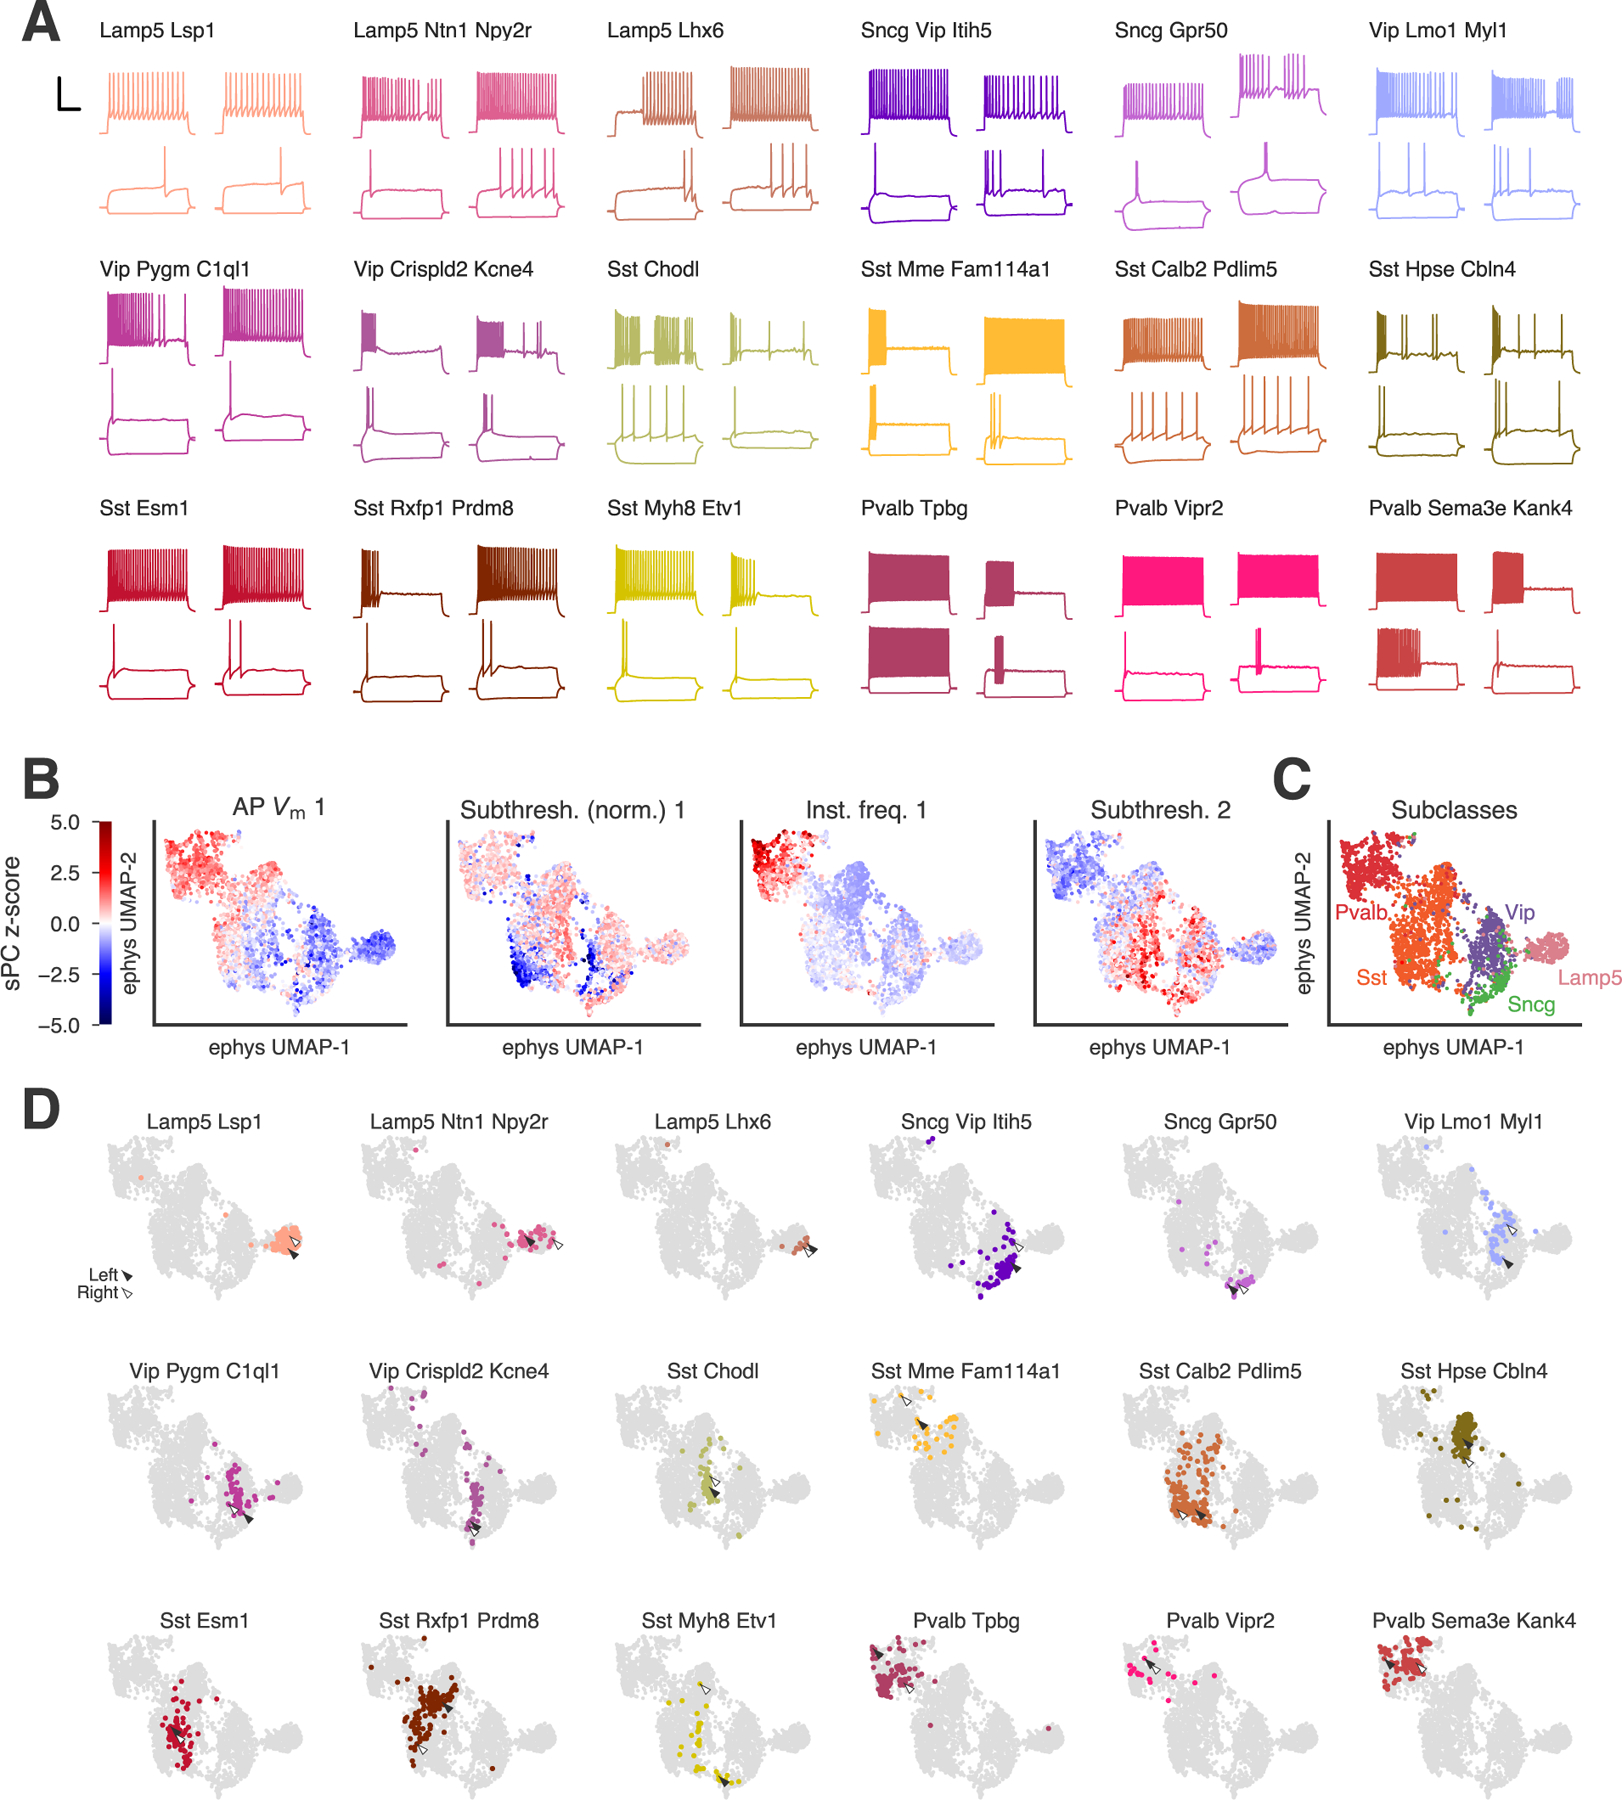
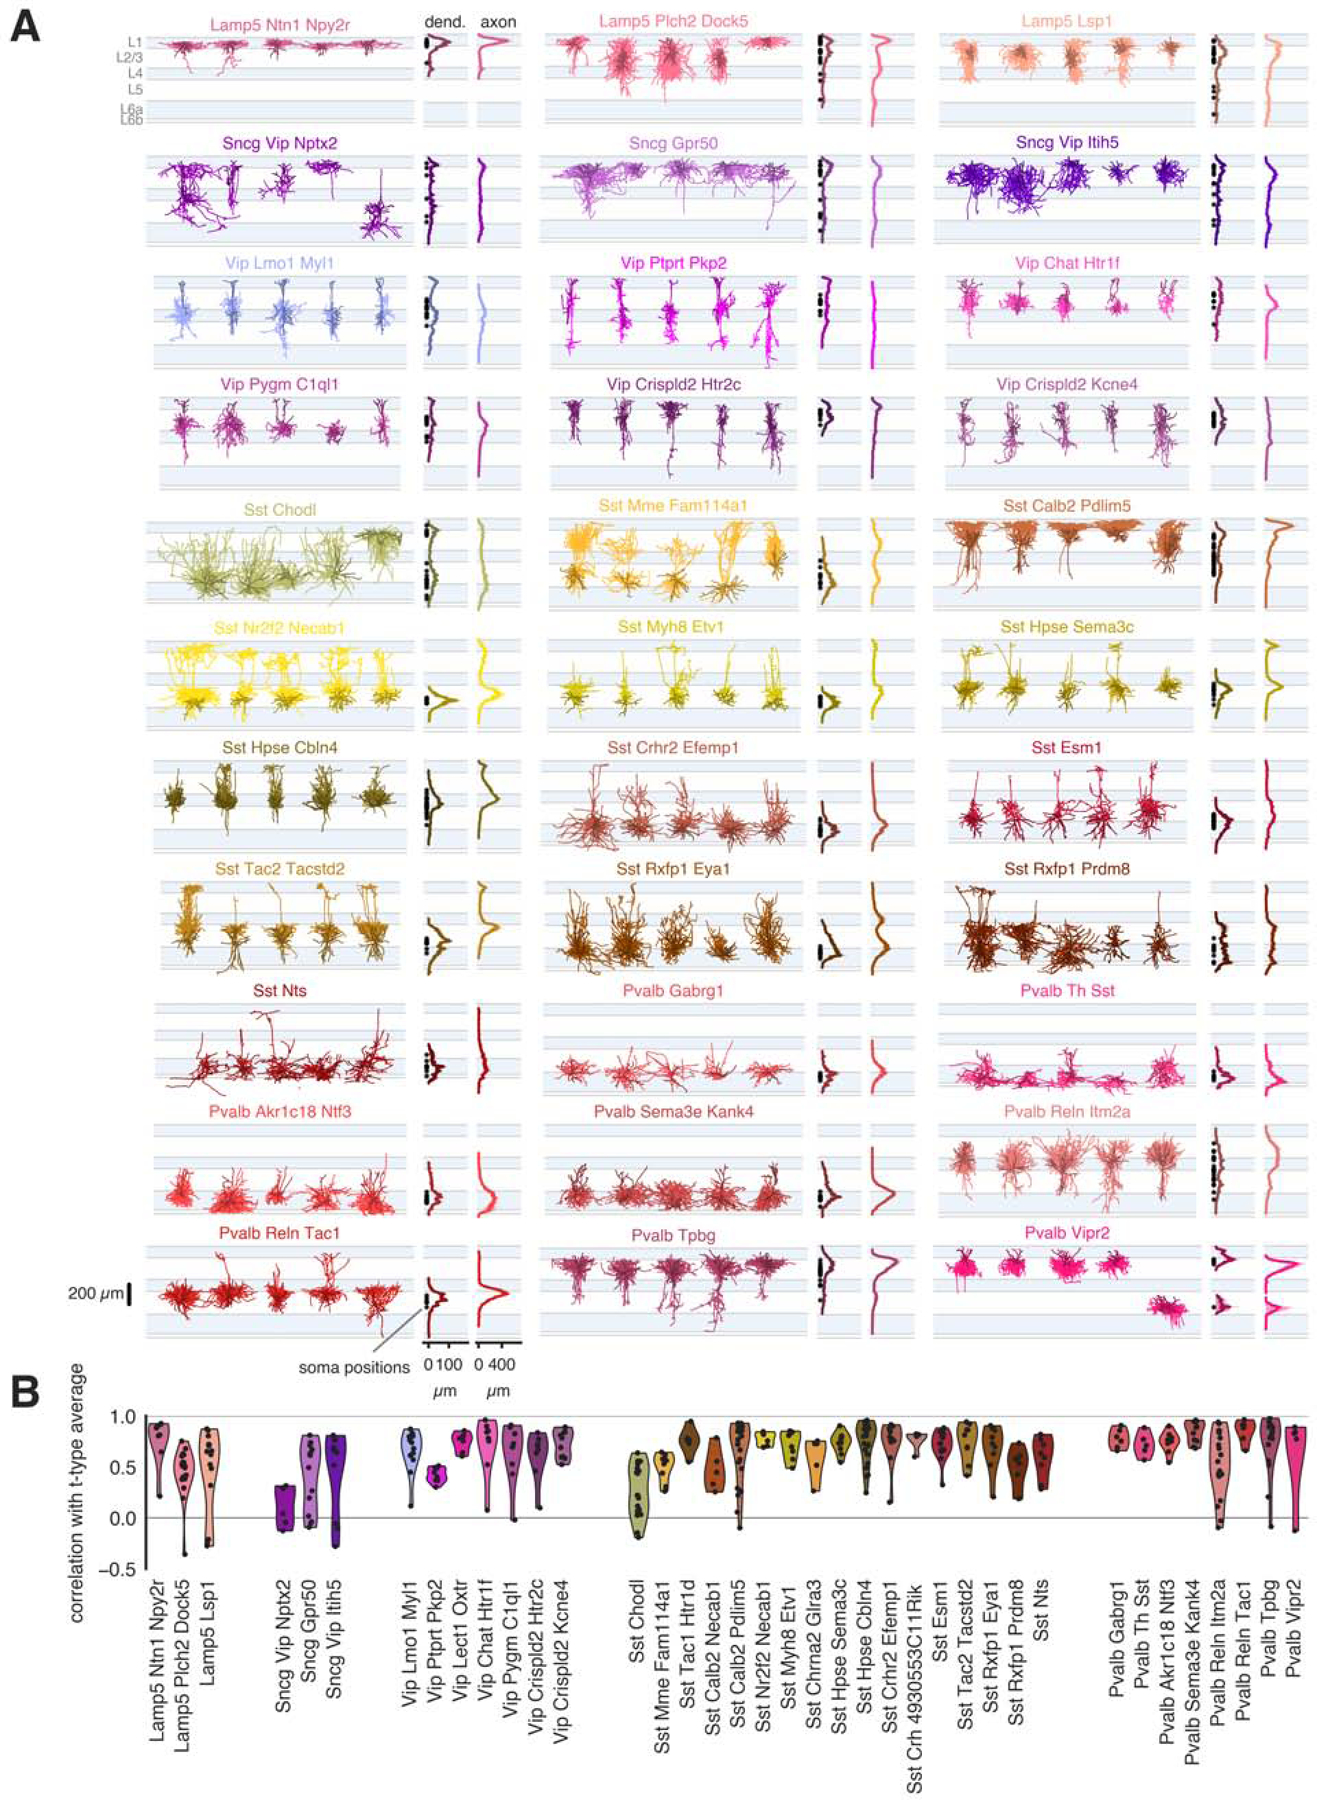
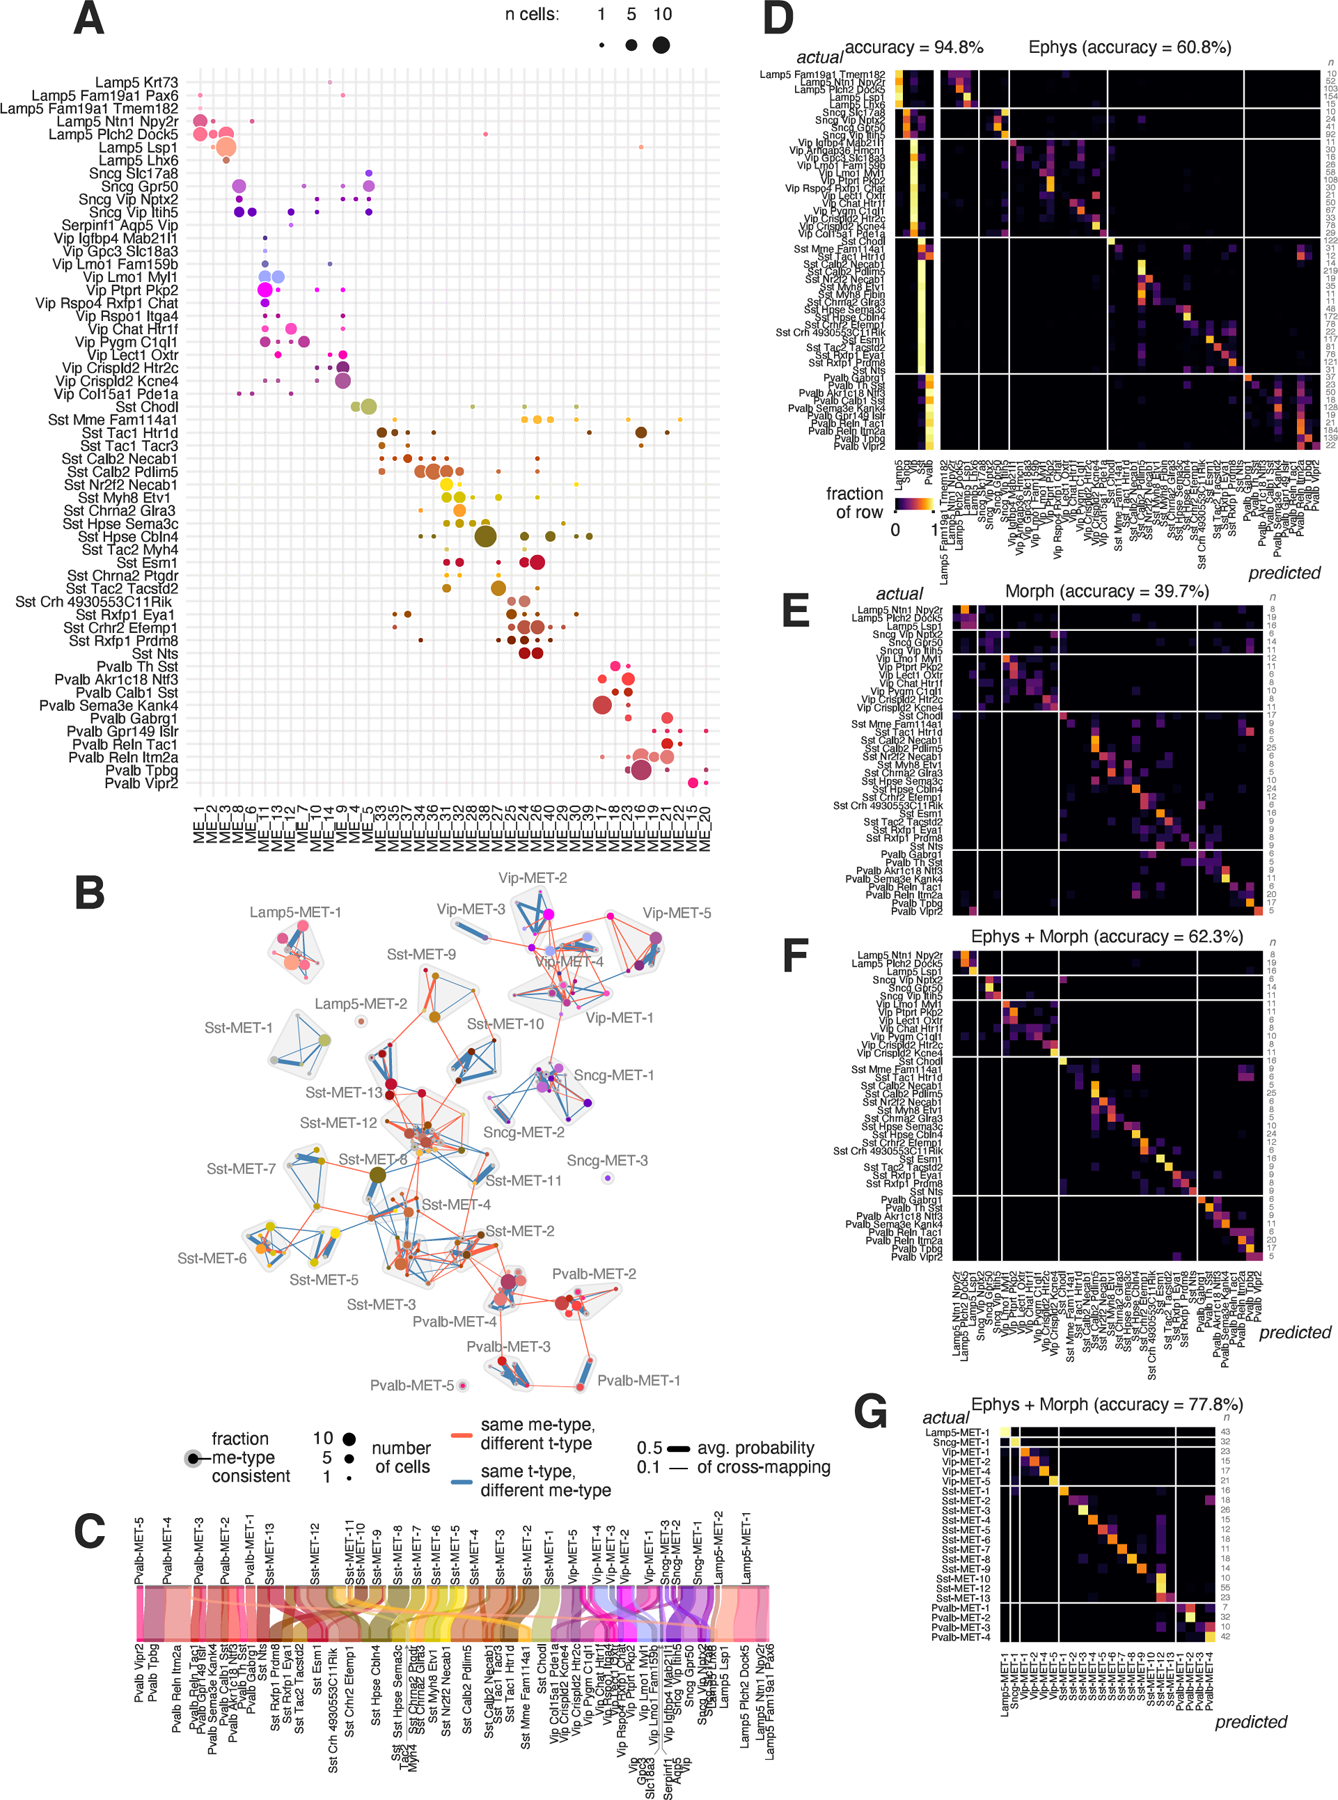
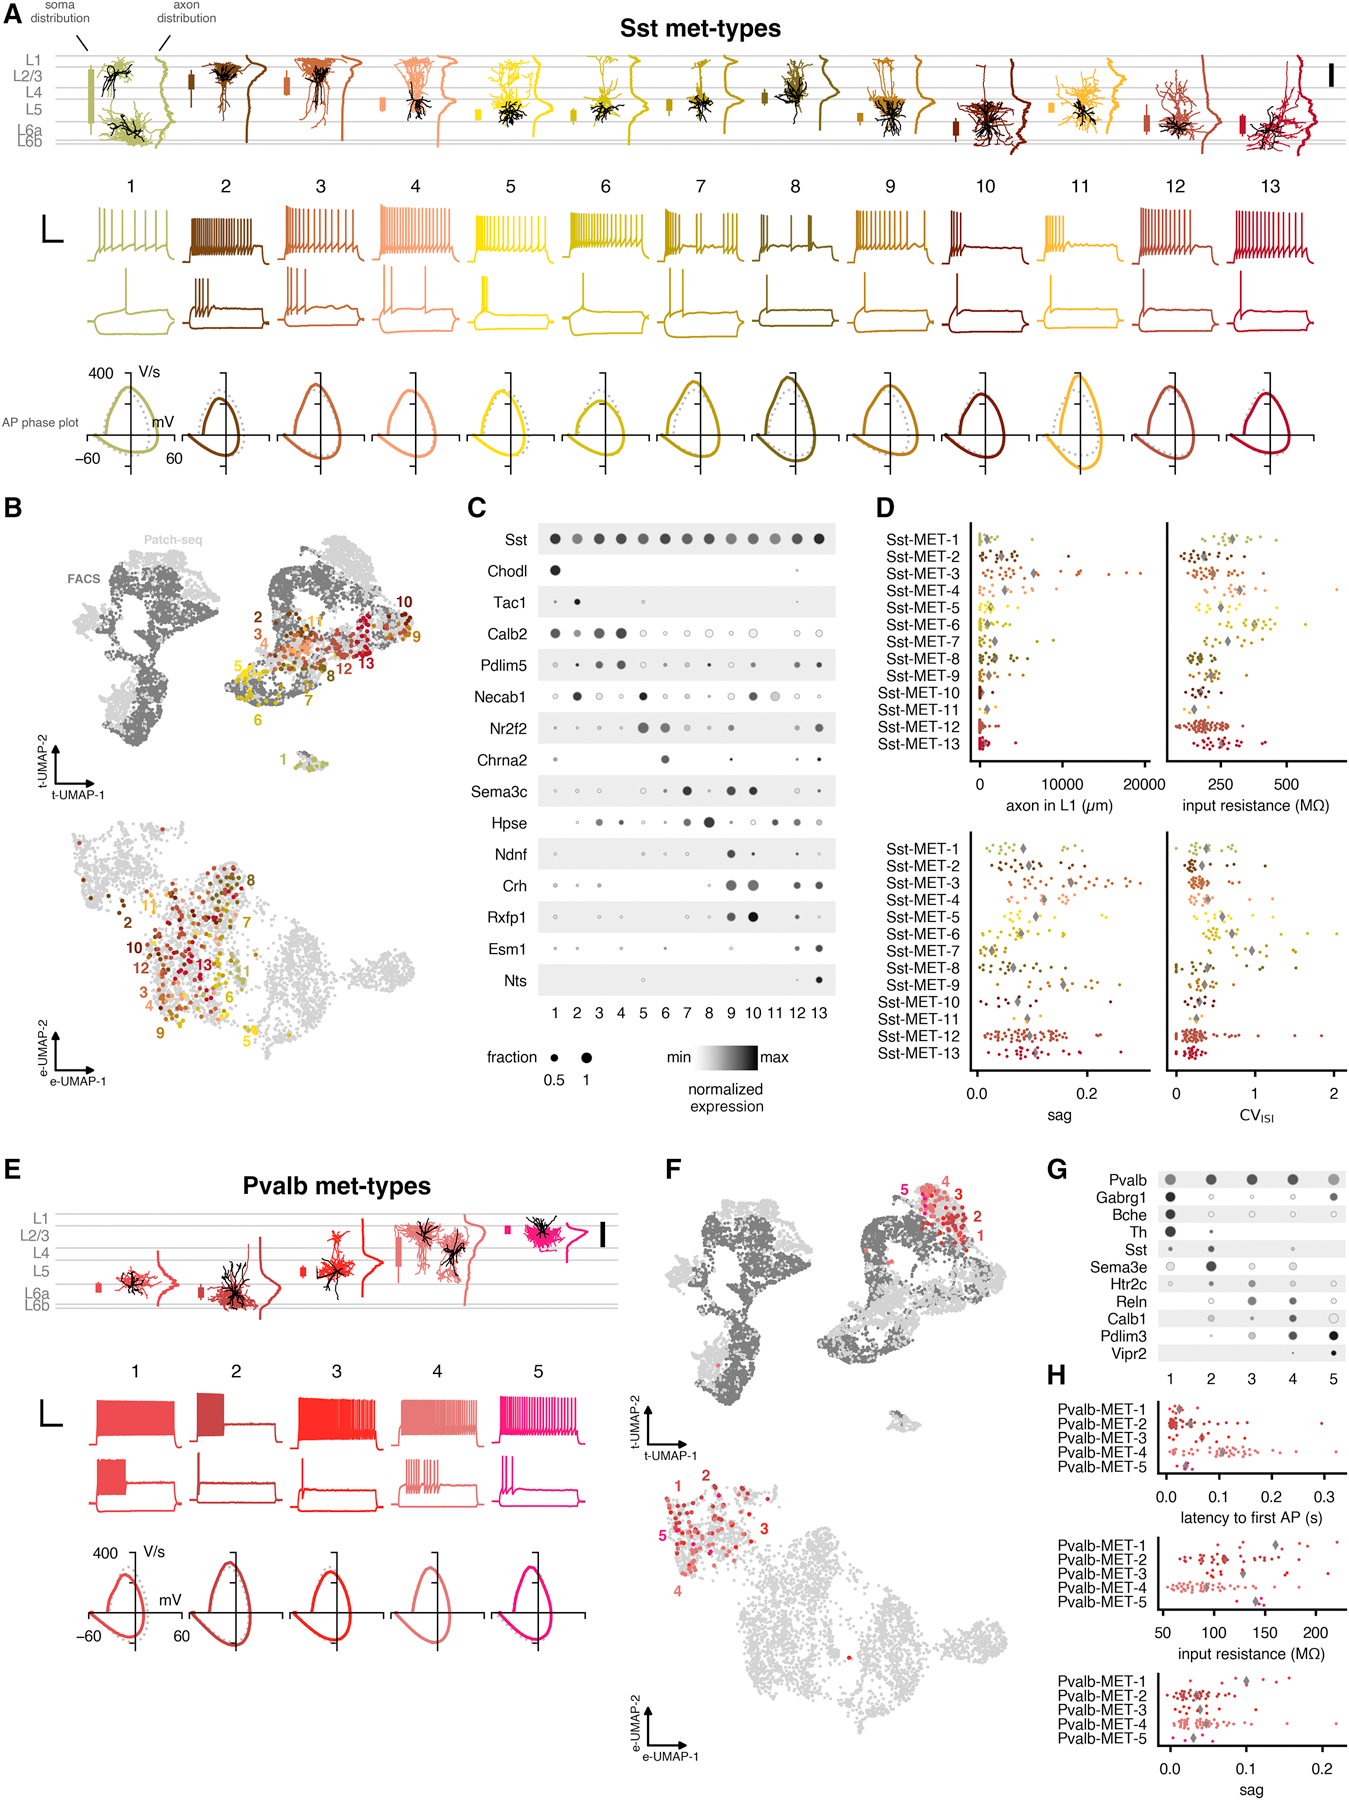
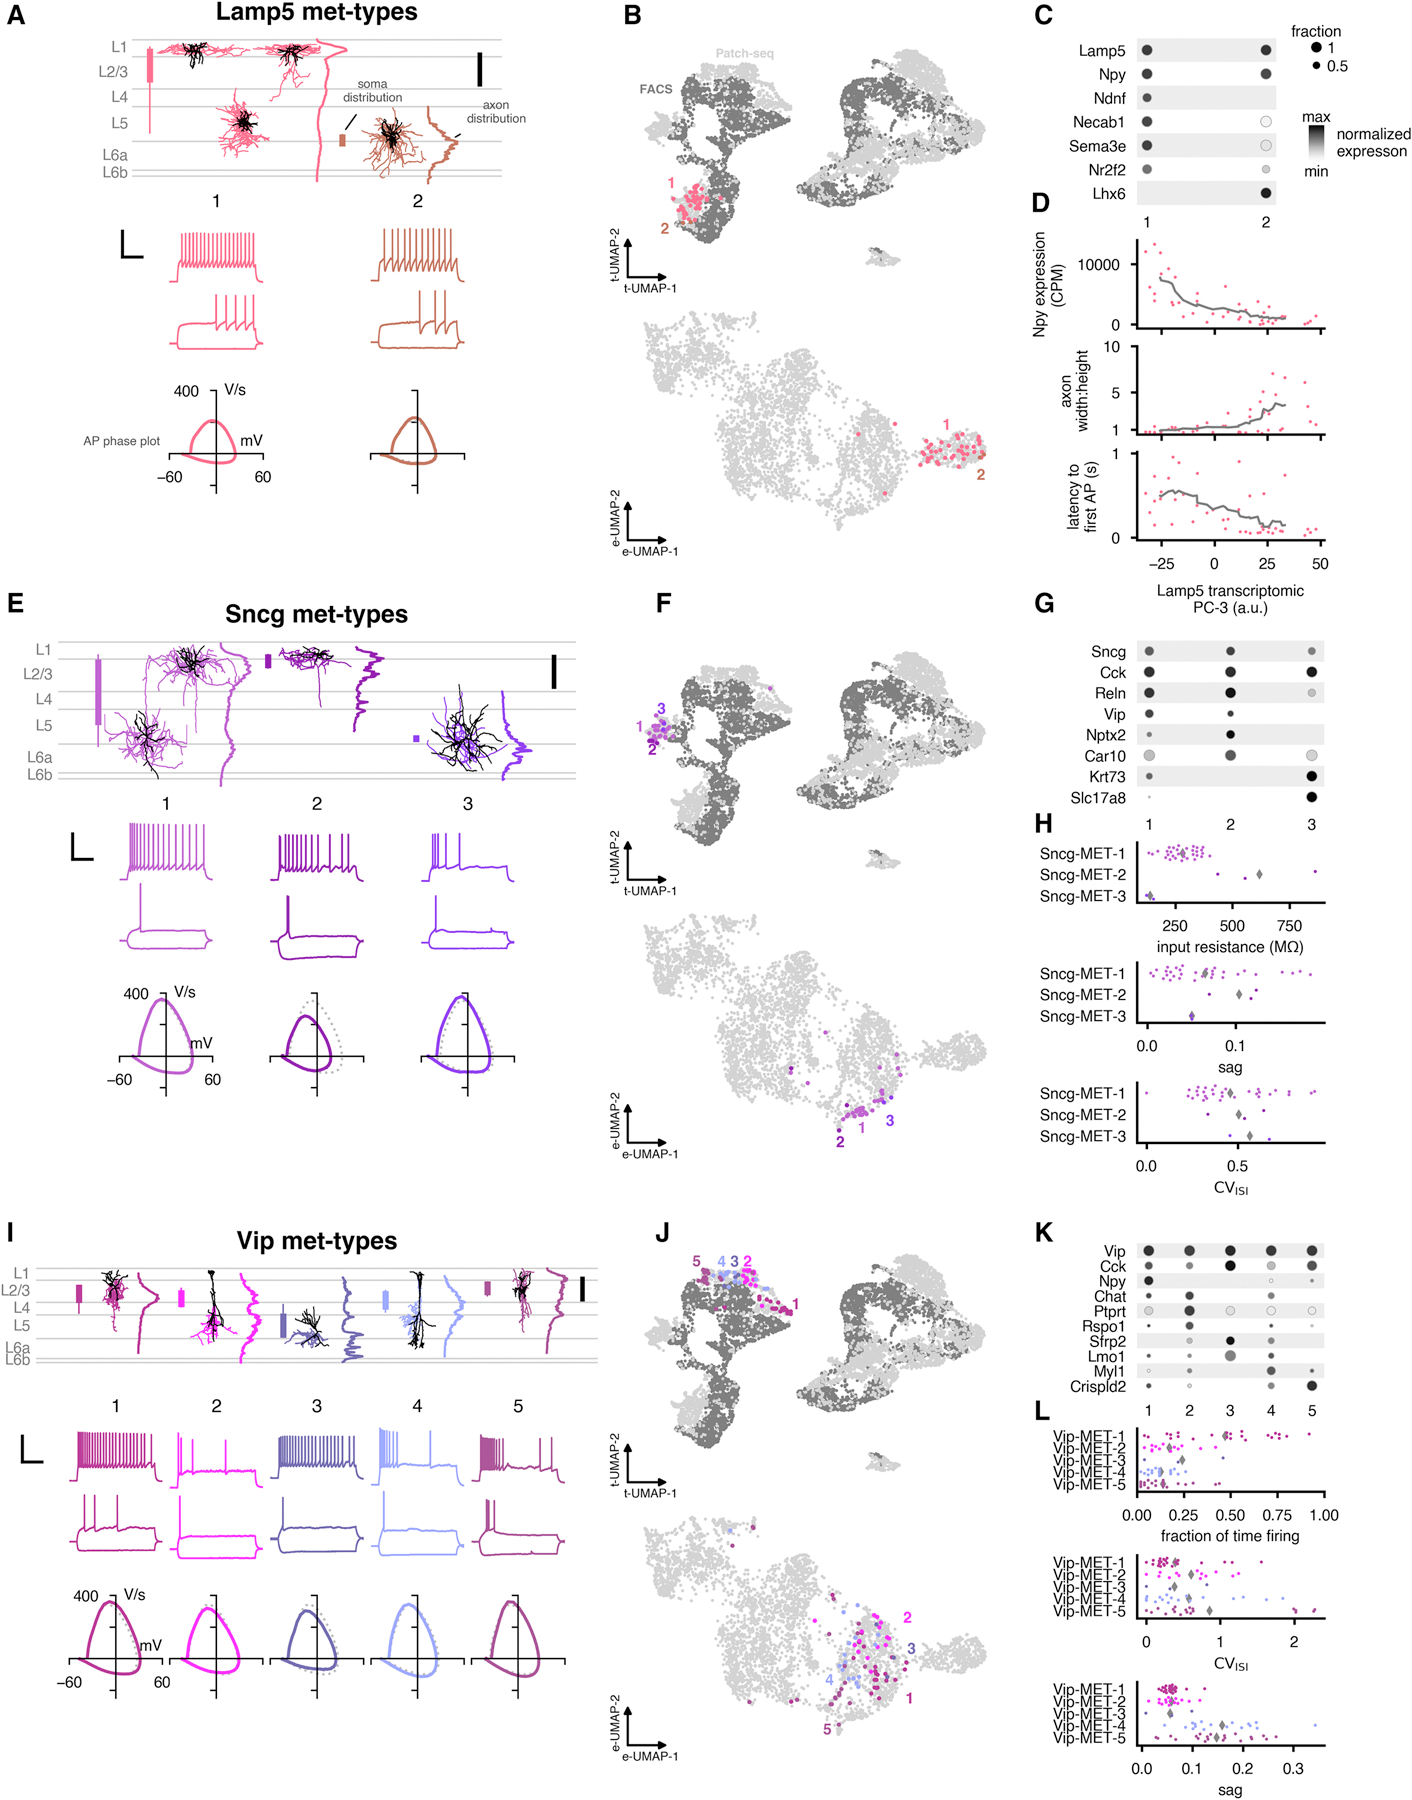
Neurons are frequently classified into distinct types on the basis of structural, physiological, or genetic attributes. To better constrain the definition of neuronal cell types, we characterized the transcriptomes and intrinsic physiological properties of over 4,200 mouse visual cortical GABAergic interneurons and reconstructed the local morphologies of 517 of those neurons. We find that most transcriptomic types (t-types) occupy specific laminar positions within visual cortex, and, for most types, the cells mapping to a t-type exhibit consistent electrophysiological and morphological properties. These properties display both discrete and continuous variation among t-types. Through multimodal integrated analysis, we define 28 met-types that have congruent morphological, electrophysiological, and transcriptomic properties and robust mutual predictability. We identify layer-specific axon innervation pattern as a defining feature distinguishing different met-types. These met-types represent a unified definition of cortical GABAergic interneuron types, providing a systematic framework to capture existing knowledge and bridge future analyses across different modalities.

Keywords: GABAergic interneurons; Patch-seq; multimodal; neuronal cell type; parvalbumin; somatostatin; taxonomy; transcriptomics; visual cortex.


Conflict of interest statement

Declaration of Interests The authors declare no competing interests.

Figures

Figure 1:
Figure 1:. Transcriptomic analysis of scRNAseq data obtained from Patch-seq recordings.
(A) Summary of the Patch-seq data collection and processing pipeline. (B) Transcriptomic UMAP plots based on principal components of gene expression (Methods; left: n=6,080 dissociated cells, black, and n=3,855 cells from Patch-seq recordings, gray). Colors in middle and right plots indicate t-type. (C) Marker gene expression distributions within each t-type are represented by pairs of violin plots corresponding to Patch-seq recordings and dissociated cells from (Tasic et al., 2018) (right and left in each column for each type, respectively). Rows are genes, black dots are medians. Values within each row are normalized between 0 and maximum detected (shown on the y axis), displayed on a log10 scale. (D) Layer distribution of cells for each t-type in both datasets. In each column the dissociated cells and Patch-seq recordings are shown on the left and right, respectively. Total number of cells from Patch-seq recordings and dissociated cells in each type is shown below each column on right and left, respectively. For (C) and (D), only cells from transgenic lines common to both data sets (see Table S1) and only types with at least 5 cells were used (n=4,651 dissociated cells and n=2,260 Patch-seq recordings). For part (D) only cells with specific layer assignment are shown (n=3,767 dissociated cells and n=2,260 Patch-seq recordings). See also Figure S2 and Table S1.
Figure 2:
Figure 2:. Positions of cells from different t-types in a common reference space.
(A) Coronal views of positions of recorded cells (n=2,930 cells) organized by transcriptomic subclass and colored by t-type. Visual areas are indicated by a lighter background. Each t-type is visualized on a single cortical hemisphere for clarity. Inset shows the top-down positions of the virtual coronal slices. Inset scale bar: 2 mm. (B) Distance from pia by t-type (n=2,930 cells) where positions are aligned to average cortical layer thicknesses. Only t-types with at least 5 highly consistently mapped cells are shown in (A) and (B).
Figure 3:
Figure 3:. Electrophysiological characterization of transcriptomic types.
(A) Example responses from different t-types to 1 second-long current steps with stimulus amplitudes equal to −70 pA and rheobase for that cell (lower traces) and rheobase + 80 pA (upper trace). Two randomly-chosen examples shown for each t-type. Scale bar: vertical 50 mV, horizontal 250 ms. (B) UMAP plots based on a projection of the z-scored electrophysiology sparse principal components (sPCs). The values of four example sPCs are shown for all cells (n=4,270). (C) Electrophysiology UMAP plots with 2,955 cells (“highly consistent cells,” see Figure S1G) labeled by transcriptomic subclass. (D) Electrophysiology UMAP plots with individual t-types highlighted. Arrowheads indicate the locations of the examples (filled: left, hollow: right) shown in (A). See also Figures S3, S4, and S5.
Figure 4:
Figure 4:. Morphological characterization of transcriptomic types.
(A) Representative morphological reconstructions from t-types (selected by NBLAST similarity scores, Methods). Dendrite and axon depth histograms calculated from all reconstructions of the t-type are shown to the right, along with soma depth positions (black dots). Dendrites are in darker colors, axon in lighter colors. Histograms are shown as mean (lines) ± SEM (shaded regions). (B) Correlations between individual cell axon depth histograms and the average histogram of its t-type (excluding itself). Only t-types with at least 5 highly-consistent mapped cells are shown in (B). See also Figures S4, S6, and S7.
Figure 5:
Figure 5:. Definition of met-types and type prediction accuracy.
(A) Comparison of t-types with unsupervised joint electrophysiological and morphological clustering results (me-types). Both highly-consistent and moderately-consistent cells are shown (n=503). (B) Graph visualization of cross-mapping between me-type/t-type combinations. The nodes represent cells with a particular me-type/t-type combination as in (A), and the size of the node indicates the number of cells. Edges represent the presence of cells in a given me-type/t-type combination that have some probability of mapping to another t-type (orange lines) or me-type (blue lines); thicker lines indicate a higher probability. Nodes with only a single cell and no connections are not shown. Outlined groups indicate well-connected me-type/t-type combinations forming 28 met-types (Methods). (C) River plot showing the relationships between t-types (bottom) and met-types (top). (D) Out-of-bag confusion matrices of a random forest classifier trained to predict t-subclasses (left) and t-types (right) from electrophysiological features. Only t-types with at least 10 highly consistent mapped cells are used. (E–F) Same as (D) but for predicting t-types from morphological features alone (E) and from morphological and electrophysiological features together (F). Only t-types with at least 5 highly consistent mapped cells are used. (G) Same as (D) but for predicting met-types from morphological and electrophysiological features. Only met-types with at least 5 cells are used. For (D–G), values are normalized to the row sums. See also Figures S4 and S8.
Figure 6:
Figure 6:. Summary of identified Sst and Pvalb inhibitory met-types.
(A) Example morphologies and electrophysiological responses for each Sst met-type. In the morphology plot, soma distributions are indicated by bars to the left (thicker: 25% to 75% range, thinner: 5% to 95% range). Average axon depth histograms are shown to the right (normalized to their maximum values). Scale bar: 200 µm. Electrophysiology examples include responses evoked by a hyperpolarizing current step (−70 or −90 pA, lower), the response at rheobase (lower), and the response evoked by a rheobase + 40 pA stimulus (upper). Scale bar: vertical 50 mV, horizontal 250 ms. Phase plots of the average first spike of the rheobase trace are shown below the example traces; the subclass-wide average is the dotted gray line. (B) UMAPs based on gene expression (upper, see Figure 1B) and electrophysiology features (lower, see Figure 3B–C) with Sst met-types shown in colors. On the top, Patch-seq cells are shown in light gray and dissociated cells are shown in dark gray. (C) Dot plots of marker genes that are differentially expressed across the Sst met-types. Expression values (shading) are log-transformed and normalized to the maximum; size of dot indicates fraction of cells expressing the gene within the t-type. (D) Selected morphological and electrophysiological features by Sst met-type. Averages shown as gray diamonds. CVISI (coefficient of variation of the interspike interval) was measured for the rheobase + 40 pA amplitude response. (E–H) Same as (A–D) but for Pvalb met-types. In (D), the latency to first AP was measured at rheobase. See also Figures S6 and S7 and Tables S2 and S3.
Figure 7:
Figure 7:. Summary of identified Lamp5, Sncg, and Vip inhibitory met-types.
(A) Example morphologies and electrophysiological responses for each Lamp5 met-type. In the morphology plot, soma distributions are indicated by bars to the left (thicker: 25% to 75% range, thinner: 5% to 95% range). Average axon depth histograms are shown to the right (normalized to their maximum values). Scale bar: 200 µm. Electrophysiology examples include responses evoked by a hyperpolarizing current step (−70 or −90 pA, lower), the response at rheobase (lower), and the response evoked by a rheobase + 40 pA stimulus (upper) . Scale bar: vertical 50 mV, horizontal 250 ms. Phase plots of the average first spike of the rheobase trace are shown below the example traces; the subclass-wide average is the dotted gray line. (B) UMAPs based on gene expression (upper, see Figure 1B) and electrophysiology features (lower, see Figure 3B–C) with Lamp5 met-types shown in colors. On the top, Patch-seq cells are shown in light gray and dissociated cells are shown in dark gray. (C) Dot plots of marker genes that are differentially expressed across the Lamp5 met-types. Expression values (shading) are log-transformed and normalized to the maximum; size of dot indicates fraction of cells expressing the gene within the t-type. (D) Variation in Npy expression, axon width:height ratio, and latency to first AP on the rheobase sweep for cells of the Lamp5-MET-1 met-type. Values are plotted against the third transcriptomic principal component (PC-3) calculated from 4,020 differentially expressed genes from all Lamp5 Patch-seq cells. Gray line is rolling mean (window of 10 cells). (E–G) Same as (A–C) but for Sncg met-types. (H) Electrophysiology feature differences between Sncg met-types. Averages shown as gray diamonds. CVISI (coefficient of variation of the interspike interval) was measured for the rheobase + 40 pA amplitude response. (I–K) Same as (A–C) but for Vip met-types. (L) Same as (H) but for Vip met-types. Fraction of time firing was measured for the rheobase + 40 pA amplitude response. See also Figure S7 and Table S4.

Comment in

References

    1. Ascoli GA, Alonso-Nanclares L, Anderson SA, Barrionuevo G, Benavides-Piccione R, Burkhalter A, Buzsáki G, Cauli B, Defelipe J, Fairén A, et al. (2008). Petilla terminology: nomenclature of features of GABAergic interneurons of the cerebral cortex. Nat Rev Neurosci 9, 557–568. - PMC - PubMed
    1. Becht E, McInnes L, Healy J, Dutertre CA, Kwok IWH, Ng LG, Ginhoux F, and Newell EW (2018). Dimensionality reduction for visualizing single-cell data using UMAP. Nat Biotechnol 37, 38–44. - PubMed
    1. Berger JO, Bernardo JM, and Sun D (2009). The Formal Definition of Reference Priors. The Annals of Statistics 37, 905–938.
    1. Bortone DS, Olsen SR, and Scanziani M (2014). Translaminar inhibitory cells recruited by layer 6 corticothalamic neurons suppress visual cortex. Neuron 82, 474–485. - PMC - PubMed
    1. Bria A, Iannello G, Onofri L, and Peng H (2016). TeraFly: real-time three-dimensional visualization and annotation of terabytes of multidimensional volumetric images. Nat Methods 13, 192–194. - PubMed

Publication types

LinkOut - more resources