. 2020 Dec 2;28(12):2691-2702.
doi: 10.1016/j.ymthe.2020.10.001. Epub 2020 Oct 8.

COVID-19-Induced ARDS Is Associated with Decreased Frequency of Activated Memory/Effector T Cells Expressing CD11a+

Affiliations

COVID-19-Induced ARDS Is Associated with Decreased Frequency of Activated Memory/Effector T Cells Expressing CD11a+

Moritz Anft et al. Mol Ther. .

Abstract

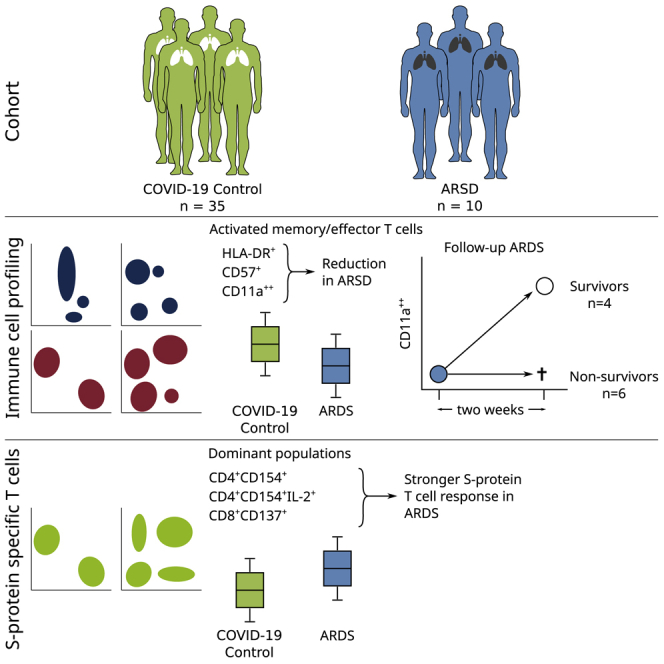
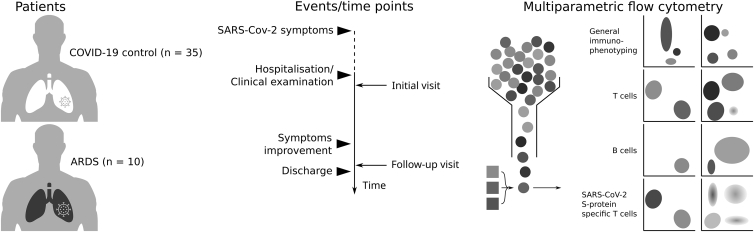
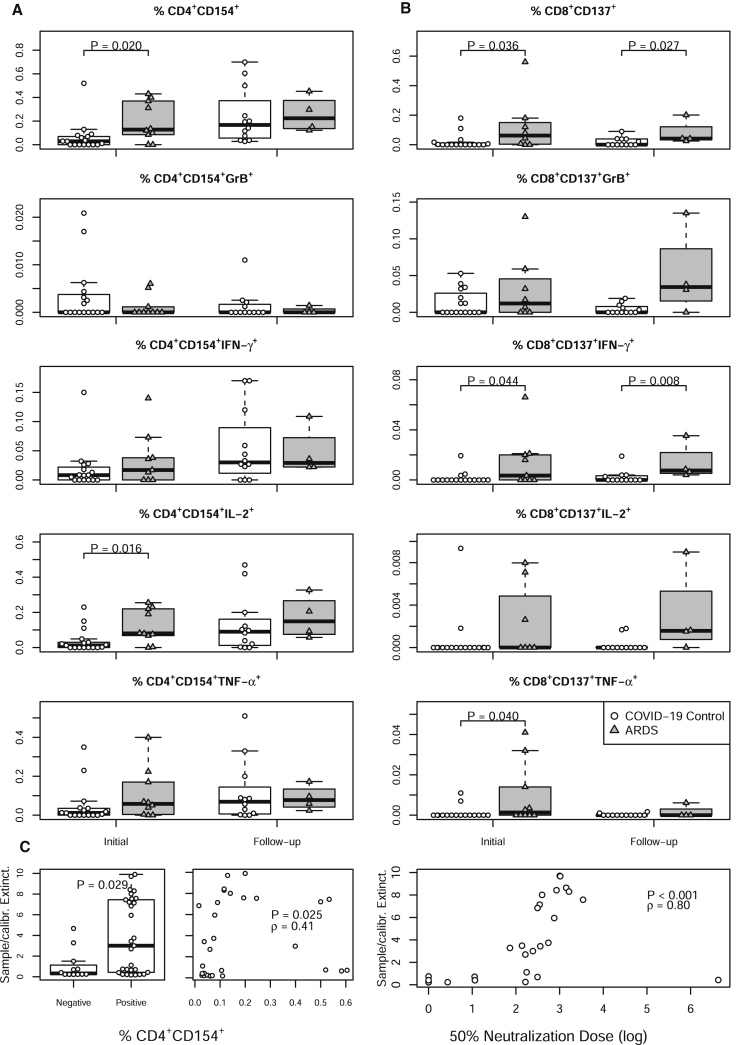
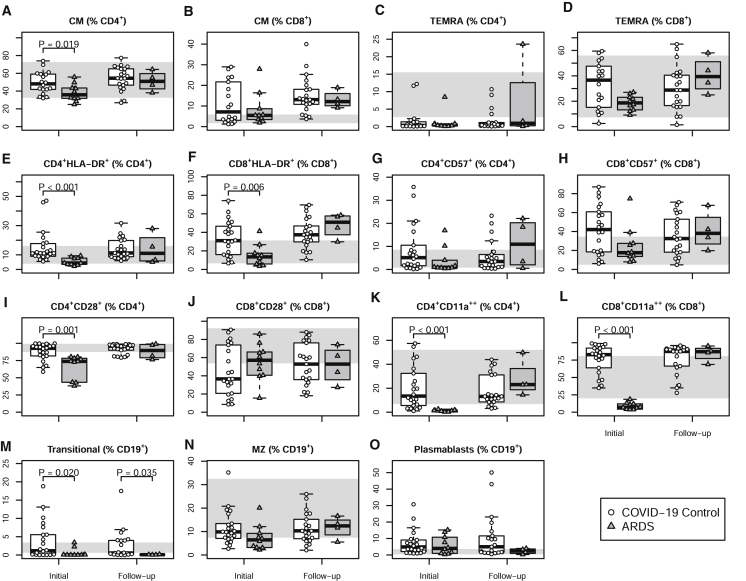
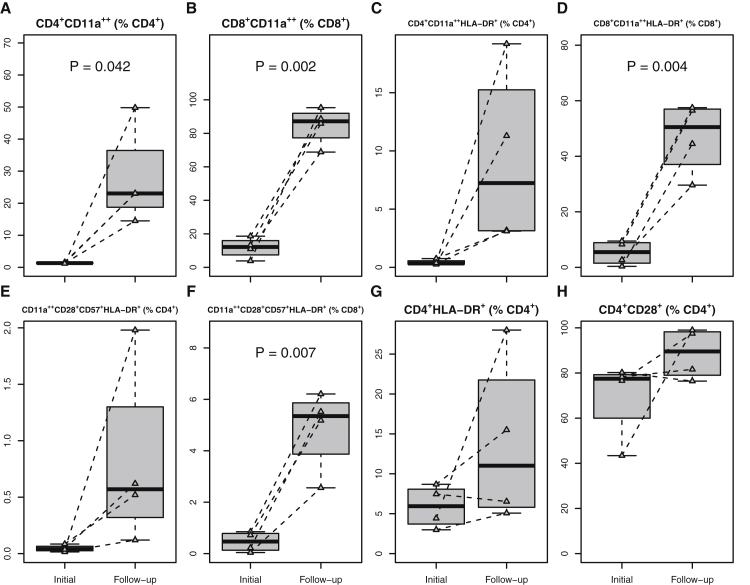
Preventing the progression to acute respiratory distress syndrome (ARDS) in COVID-19 is an unsolved challenge. The involvement of T cell immunity in this exacerbation remains unclear. To identify predictive markers of COVID-19 progress and outcome, we analyzed peripheral blood of 10 COVID-19-associated ARDS patients and 35 mild/moderate COVID-19 patients, not requiring intensive care. Using multi-parametric flow cytometry, we compared quantitative, phenotypic, and functional characteristics of circulating bulk immune cells, as well as SARS-CoV-2 S-protein-reactive T cells between the two groups. ARDS patients demonstrated significantly higher S-protein-reactive CD4+ and CD8+ T cells compared to non-ARDS patients. Of interest, comparison of circulating bulk T cells in ARDS patients to non-ARDS patients demonstrated decreased frequencies of CD4+ and CD8+ T cell subsets, with activated memory/effector T cells expressing tissue migration molecule CD11a++. Importantly, survival from ARDS (4/10) was accompanied by a recovery of the CD11a++ T cell subsets in peripheral blood. Conclusively, data on S-protein-reactive polyfunctional T cells indicate the ability of ARDS patients to generate antiviral protection. Furthermore, decreased frequencies of activated memory/effector T cells expressing tissue migratory molecule CD11a++ observed in circulation of ARDS patients might suggest their involvement in ARDS development and propose the CD11a-based immune signature as a possible prognostic marker.

Keywords: ARDS; COVID-19; S-protein-reactive T cells; SARS-CoV-2; immunity.


Figures

None
Graphical abstract
Figure 1
Figure 1
Study Outline 45 patients consecutively admitted to Marienhospital Herne–Universitätsklinikum der Ruhr-Universität Bochum (North Rhine-Westphalia, Germany) and Universitätsklinikum Essen (North Rhine-Westphalia, Germany) were enrolled in this study. The patients were classified based on their symptoms as non-critical COVID-19 course (COVID-19 control) or COVID-19-associated ARDS (ARDS). The patients were analyzed at two time points: shortly after hospitalization (initial visit) and after clinical improvement (follow-up visit). For the ARDS group, the initial visit corresponds to the first available visit after ARDS symptoms were observed, and the follow-up visit corresponds to discharge from the intensive care unit (ICU). The profiling included evaluation of SARS-CoV-2 S-protein-specific IgG serum antibodies, as well as phenotyping of all major immune cell populations by flow cytometry, and characterization of B and T cell subsets. T cells reactive to the SARS-CoV-2 S-protein were also analyzed by application of overlapping peptide pools.
Figure 2
Figure 2
Increased Magnitude of Cytokine Producing S-Protein-Reactive T Cells in ARDS Patients in the Initial Visit and at Follow-up The presence and functional status of SARS-CoV-2-reactive T cells was evaluated using PBMCs, isolated from the peripheral blood of 27 patients (17 COVID-19 control, in white, and 10 ARDS, in gray). Defrosted PBMCs rested for 24 h before treatment with overlapping peptide pools covering immune-dominant regions of the SARS-CoV-2 S-protein. The cells were stimulated for a total of 16 h and in the presence of brefeldin A for the last 14 h. The complete gating strategy is presented in Figure S6. No measurements of IgG antibodies were available for ARDS patients. (A) CD4+CD154+ frequency (first row) for ARDS and COVID-19 control patients at the initial visit (left boxplots) and follow-up (right boxplots), and frequencies of CD4+CD154+ cells expressing granzyme B (GrB), INF-γ, IL-2, and TNF-α (rows two to four). (B) CD8+CD137+ frequency (first row) for ARDS and COVID-19 control patients at the initial visit (left boxplots) and follow-up (right boxplots), and frequencies of CD8+CD137+ cells expressing GrB, INF-γ, IL-2, and TNF-α (rows two to four). Boxplots depict the median and the first and third quartiles. The whiskers correspond to 1.5 times the interquartile range. (C) Left side: comparison of the relative titers of SARS-CoV-2 S-protein-specific IgG antibodies, measured by ELISA and evaluated as the ratio to an internal control for samples with SARS-CoV-2-specific CD4+ T cells; the comparison of the relative titers classified depending on whether they had detectable virus-specific CD4+ T cells and the correlation of the relative titers with the frequency of virus-specific CD4+ T cells are shown. Right side: comparison of the relative titers of SARS-CoV-2 S-protein-specific IgG antibodies with the 50% neutralization dose. For the analysis of the antibody neutralization dose, the data were log transformed, assigning a value of zero for those with a value below the detection limit.
Figure 3
Figure 3
Decrease of Lymphocyte Frequencies with Differentiated and Activated Cytotoxic Phenotype in ARDS Patients at the Initial Visit Peripheral blood from 37 patients from the COVID-19 control group (n = 27, in white) or ARDS group (n = 10, in gray) was subjected to evaluation for differentiation (A-D) and activation state of T cell (E-L) and B cell (M-O) subsets using multiparametric flow cytometry. The subsets of the CD3+ T cells and the CD19+ B lymphocyte were identified according to the gating strategy depicted in Figures S8–S10. In all cases, the left boxplots show the data for the initial visit, while the right boxplots depict the data at follow-up. The shaded area indicates the reference range as detected in healthy individuals. Boxplots depict the median and the first and third quartiles. The whiskers correspond to 1.5 times the interquartile range.
Figure 4
Figure 4
Recovery from ARDS Is Accompanied by the Recovery of Depleted T Cell Subsets with an Activated Differentiated Effector Phenotype The kinetics of T cell subsets with an activated terminally differentiated effector phenotype were evaluated in the four ARDS survivors. The subsets of the CD3+ T cells were identified according to the gating strategy in Figure S8, and showing cells expressing CD11a (A and B), CD11a++HLA-DR+ (C and D), CD11a++CD28+CD57+HLA-DR+ (E and F), HLA-DR (G) and CD28 (H). Boxplots depict the median and the first and third quartiles. The whiskers correspond to 1.5 times the interquartile range.

References

    1. Siddiqi H.K., Mehra M.R. COVID-19 illness in native and immunosuppressed states: a clinical-therapeutic staging proposal. J. Heart Lung Transplant. 2020;39:405–407. - PMC - PubMed
    1. Guan W.J., Ni Z.Y., Hu Y., Liang W.H., Ou C.Q., He J.X., Liu L., Shan H., Lei C.L., Hui D.S.C., China Medical Treatment Expert Group for Covid-19 Clinical characteristics of coronavirus disease 2019 in China. N. Engl. J. Med. 2020;382:1708–1720. - PMC - PubMed
    1. Kern F., Bunde T., Faulhaber N., Kiecker F., Khatamzas E., Rudawski I.M., Pruss A., Gratama J.W., Volkmer-Engert R., Ewert R. Cytomegalovirus (CMV) phosphoprotein 65 makes a large contribution to shaping the T cell repertoire in CMV-exposed individuals. J. Infect. Dis. 2002;185:1709–1716. - PubMed
    1. Stervbo U., Nienen M., Weist B.J.D., Kuchenbecker L., Hecht J., Wehler P., Westhoff T.H., Reinke P., Babel N. BKV clearance time correlates with exhaustion state and T-cell receptor repertoire shape of BKV-specific T-cells in renal transplant patients. Front. Immunol. 2019;10:767. - PMC - PubMed
    1. Weist B.J.D., Wehler P., El Ahmad L., Schmueck-Henneresse M., Millward J.M., Nienen M., Neumann A.U., Reinke P., Babel N. A revised strategy for monitoring BKV-specific cellular immunity in kidney transplant patients. Kidney Int. 2015;88:1293–1303. - PubMed

Publication types

MeSH terms

Substances

LinkOut - more resources