. 2020 Dec 3;107(6):1129-1148.
doi: 10.1016/j.ajhg.2020.10.012. Epub 2020 Nov 12.

De Novo VPS4A Mutations Cause Multisystem Disease with Abnormal Neurodevelopment

Affiliations

De Novo VPS4A Mutations Cause Multisystem Disease with Abnormal Neurodevelopment

Catherine Rodger et al. Am J Hum Genet. .

Abstract

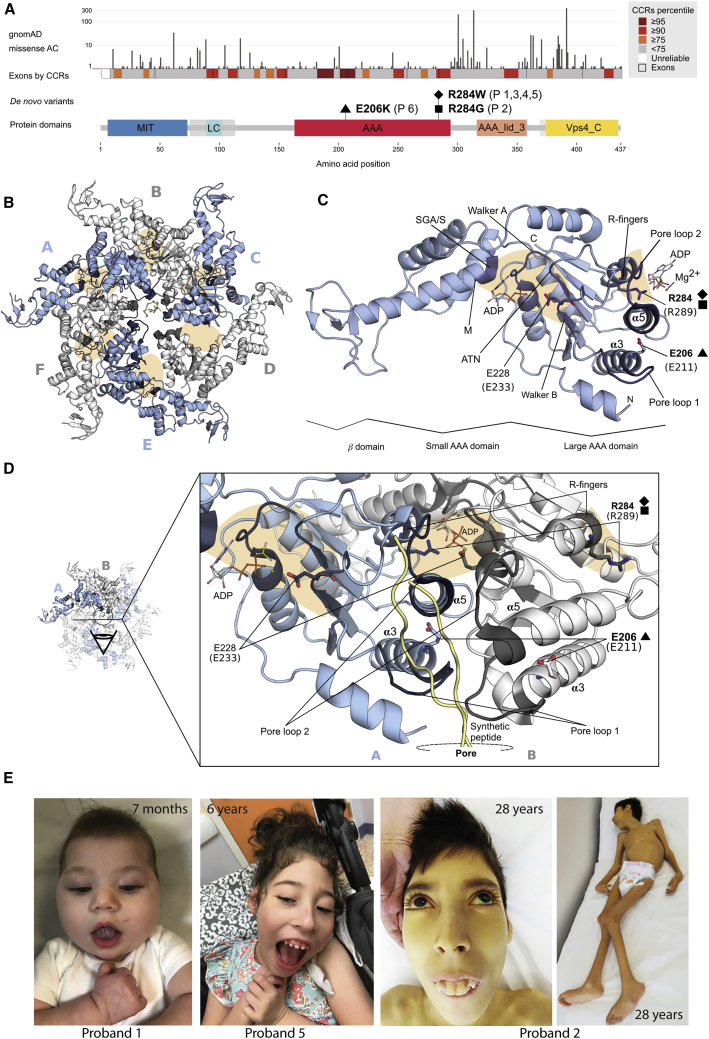
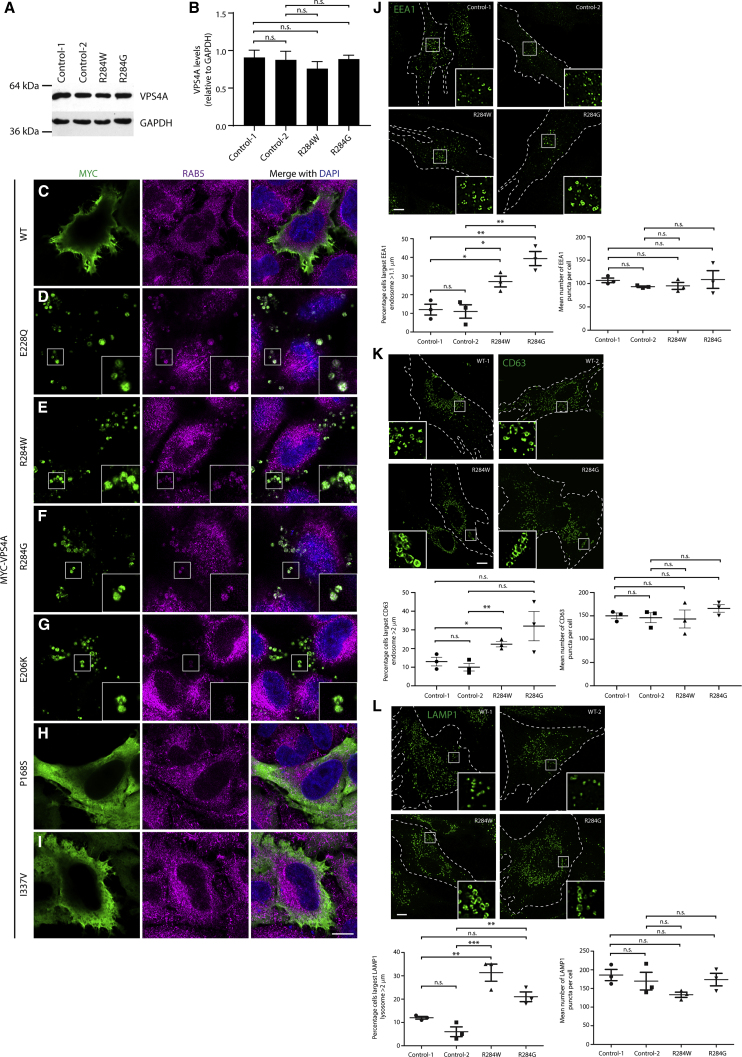
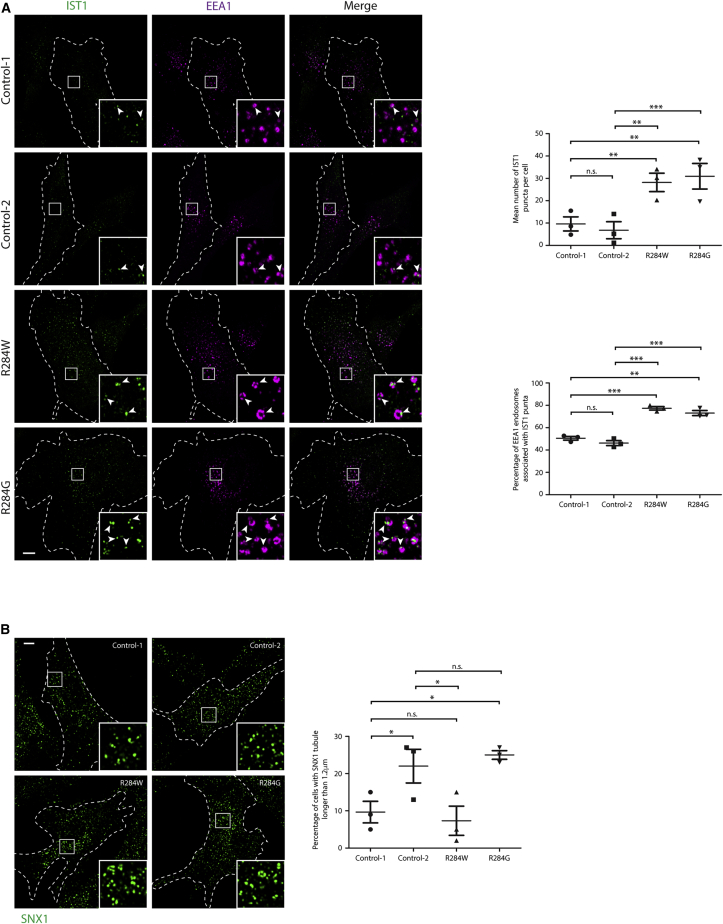
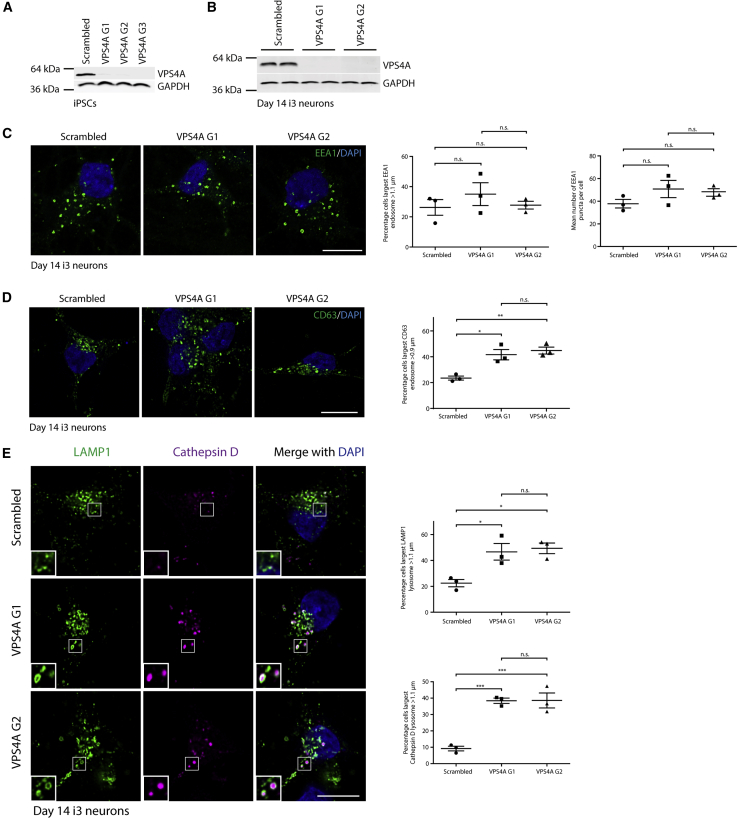
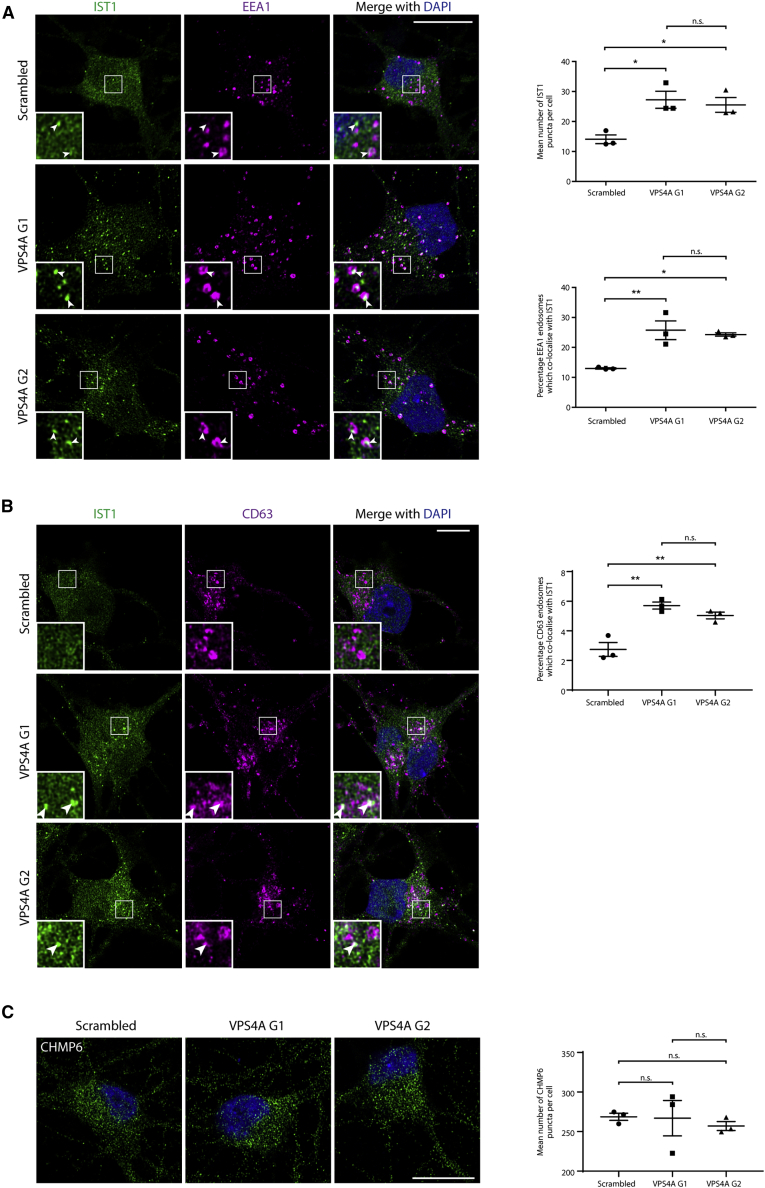
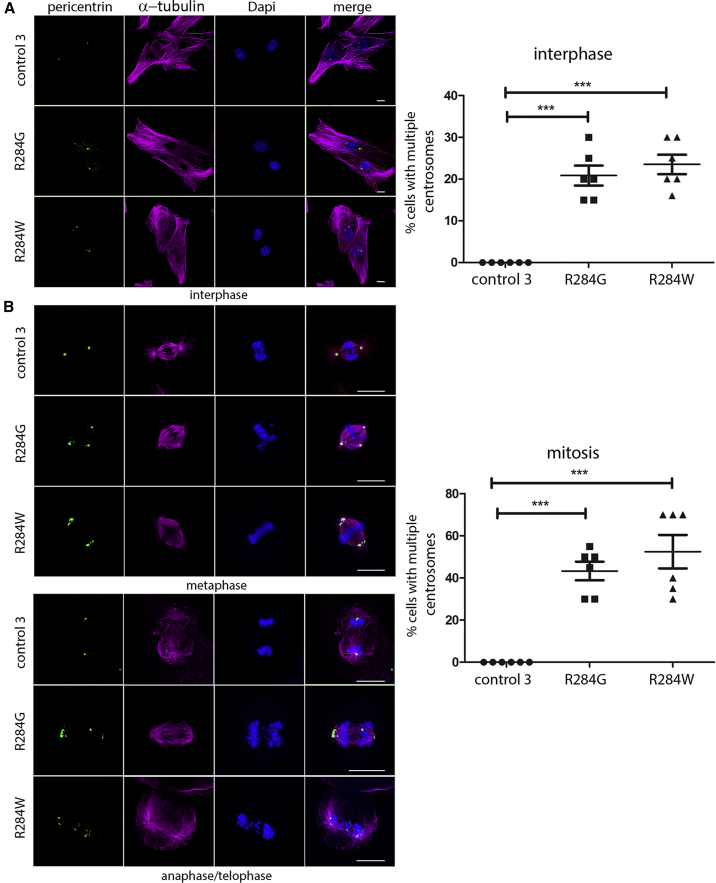
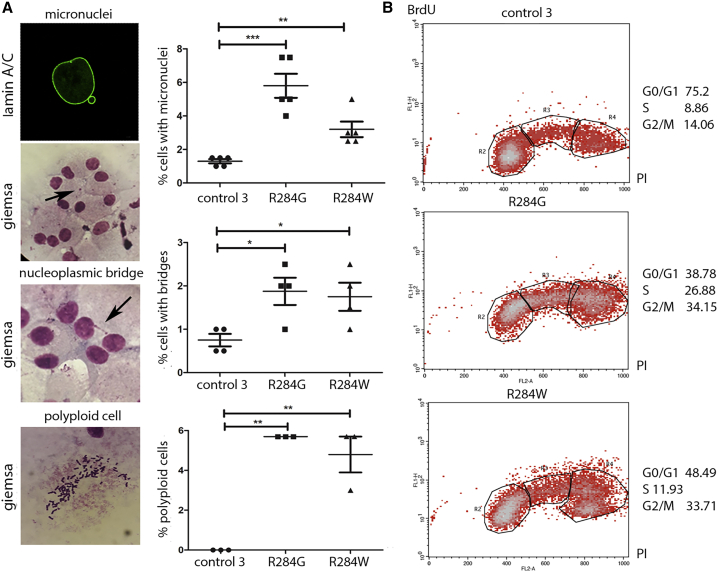
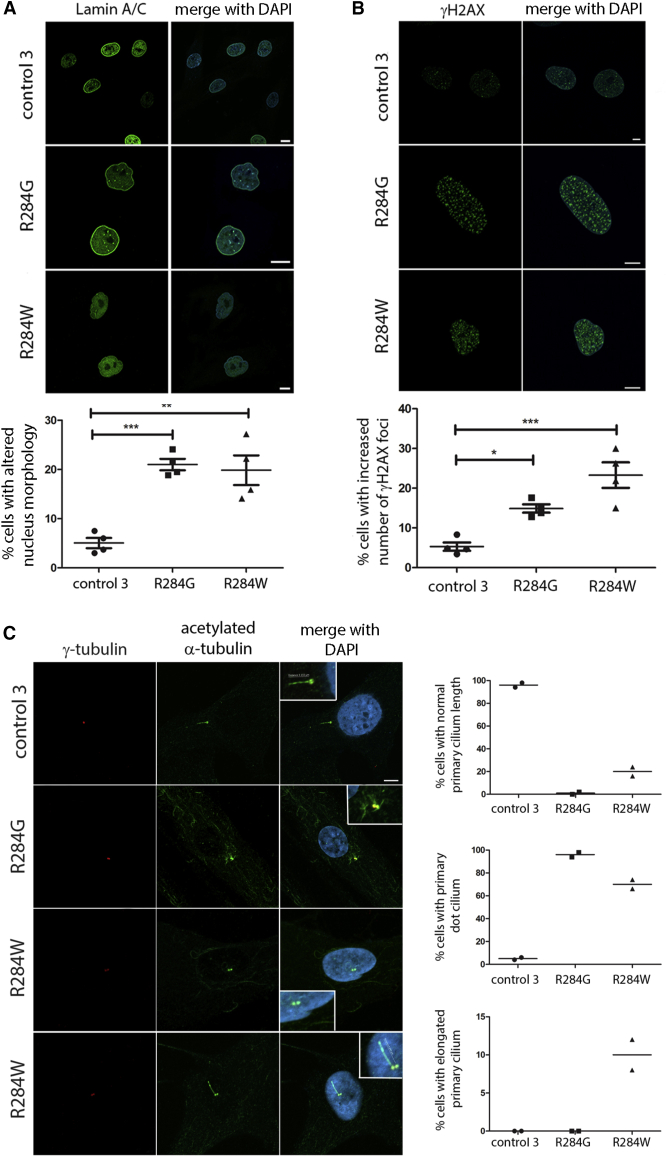
The endosomal sorting complexes required for transport (ESCRTs) are essential for multiple membrane modeling and membrane-independent cellular processes. Here we describe six unrelated individuals with de novo missense variants affecting the ATPase domain of VPS4A, a critical enzyme regulating ESCRT function. Probands had structural brain abnormalities, severe neurodevelopmental delay, cataracts, growth impairment, and anemia. In cultured cells, overexpression of VPS4A mutants caused enlarged endosomal vacuoles resembling those induced by expression of known dominant-negative ATPase-defective forms of VPS4A. Proband-derived fibroblasts had enlarged endosomal structures with abnormal accumulation of the ESCRT protein IST1 on the limiting membrane. VPS4A function was also required for normal endosomal morphology and IST1 localization in iPSC-derived human neurons. Mutations affected other ESCRT-dependent cellular processes, including regulation of centrosome number, primary cilium morphology, nuclear membrane morphology, chromosome segregation, mitotic spindle formation, and cell cycle progression. We thus characterize a distinct multisystem disorder caused by mutations affecting VPS4A and demonstrate that its normal function is required for multiple human developmental and cellular processes.

Keywords: CIMDAG; DNA damage; centrosome; cerebellar hypoplasia; endosomal sorting; endosomal sorting complex required for transport; microcephaly; mitosis; nuclear envelope; primary cilium.


Conflict of interest statement

The authors declare no competing interests.

Figures

Figure 1
Figure 1
De Novo Missense Variants in VPS4A Mapped to the Schematic Protein Diagram and the Homologous Yeast Structure (A) Allele count of missense variants in gnomAD and the constrained coding regions’ (CCRs) percentiles are represented for human VPS4A (GeBank: NP_037377) and are aligned with protein domains. The de novo missense variants cluster in constrained regions of the large ATPase domain. Coordinates of the protein domains were from Pfam (UniProtKB: Q9UN37). MIT, microtubule interacting and trafficking; AAA, ATPase family associated with various cellular activities; AAA_lid, AAA+ lid domain; Vps4_C, Vps4 C-terminal oligomerization domain; LC, low complexity region. Disordered regions are shaded in translucent gray. (B–D) De novo missense variants in VPS4A are mapped to the cryo-EM structure of the ATPase domain of the homologous yeast VPS4 in homohexameric form (PDB: 6OO2). The approximate locations of the active sites are shaded in orange, with the ADP nucleotides represented in sticks, when present. The conserved motifs that define the ATP binding site and pore loops 1 and 2 are shown in dark blue or gray. (B) Structure of the homohexamer, with the six chains alternately colored in blue and white. (C) Structure of a single chain. Both p.Arg284Trp and p.Arg284Gly are observed to affect the R-finger of the active site and p.Glu206Lys affects the intra-chain interface between α3 and α5 helices, located after the pore loops 1 and 2. Only the name of these two helices is shown for clarity. p.Glu228Gln, a rationally designed mutant that produces dominant-negative ATPase-defective VPS4A, falls in the Walker B motif of the active site. (D) Zoom in of the inter-chain interface. The pore loops 1 and 2 shape the pore and interact with the synthetic peptide (in yellow) that shows how the ESCRT-III protein would translocate through the pore. (E) Images of probands at representative ages.
Figure 2
Figure 2
VPS4A Disease-Associated Variants Have a Dominant-Negative Effect on Endosomal Morphology (A) Representative VPS4A immunoblots of fibroblast cell lysates from a proband (proband 1) with the p.Arg284Trp sequence change and her parents (control 1 and control 2), and from a proband (proband 2) with the p.Arg284Gly sequence change. (B) Immunoblot band intensities from three such experiments were quantified, normalized to GAPDH loading control values, and plotted in the corresponding graph. (C–I) HeLa cells were transfected with constructs expressing wild-type myc-VPS4A, myc-VPS4A containing the rationally designed ATPase-defective p.Glu228Gln mutant, or myc-VPS4A harboring the sequence changes identified in probands. Cells were fixed, labeled with anti-Myc and anti-RAB5 antibodies, and visualized with confocal microscopy. The inset panels show higher magnification views of the boxed regions; examples of large vacuolar endosomal structures are shown. (J–L) Cultured fibroblasts from the control subjects and probands indicated were fixed, labeled with EEA1 (early endosomes) (J), CD63 (preferentially labels late endosomes) (K) and LAMP1 (predominantly labels lysosomes) (L), then visualized by widefield immunofluorescence microscopy. The percentage of cells with an endosomal organelle over a nominal cut-off size and the number of labeled organelles per cell was counted in n = 3 biological repeats for each marker (in 100 cells per experimental condition in each repeat), then quantified in the corresponding charts. Bars in all plots show mean ± SEM, p values calculated by one-way ANOVA with Tukey’s post hoc test for repeated-measures. Scale bars = 10 μm.
Figure 3
Figure 3
The Atypical ESCRT-III Protein IST1 Accumulates on Endosomes in Proband Fibroblasts (A) Cultured fibroblasts from control subjects or the probands indicated were fixed, labeled against EEA1 and IST1, then visualized with confocal immunofluorescence microscopy. The number of IST1 puncta per cell and the percentage of EEA1-positive endosomes associated with an IST1 punctum was quantified in three such experiments (in five cells per experimental condition in each biological repeat) and plotted in the corresponding charts. Arrows indicate juxtaposed or co-localized puncta. (B) Cultured fibroblasts from control subjects or the probands indicated were fixed and labeled for the endosomal tubular marker SNX1, then visualized with widefield immunofluorescence microscopy. The percentage of cells with at least one SNX-1-positive tubular structure > 1.2 μm in length was quantified in 100 cells per sample, and the results for three such experiments were plotted in the corresponding chart. Bars indicate mean ± SEM, p values calculated by one-way ANOVA with Tukey’s post hoc test for repeated-measures. Micrograph scale bars = 10 μm.
Figure 4
Figure 4
Human Neurons Lacking VPS4A Exhibit Similar Endosomal Phenotypes to Proband Fibroblasts (A) CRISPRi-i3N iPSCs with were transduced with a scrambled sgRNA and three separate sgRNAs (G1-G3) directed against VPS4A. Cell lysates were immunoblotted against VPS4A. (B) Selected lines were treated with doxycycline to induce neuronal differentiation, then blotted against VPS4A 14 days later. GAPDH signal validates equal lane loading. (C) CRISPRi-i3N iPSCs expressing the guides indicated were differentiated to neurons for 14 days, fixed, and labeled for EEA1. The percentage of cells with an EEA1-positive organelle over a nominal cut-off size was visualized by widefield microscopy and quantified in 3 experiments (≥100 cells per experimental condition in each repeat). The number of EEA1-positive endosomes per cell was visualized using confocal microscopy and quantified in 3 experiments (≥20 cells per experimental condition in each repeat). Quantifications are plotted in the corresponding graphs. (D) i3Neurons expressing the sgRNAs indicated were fixed and labeled for CD63, then visualized by widefield microscopy. The percentage of cells with a CD63 organelle over a nominal cut-off size was quantified as described for EEA1. (E) i3Neurons expressing the sgRNAs indicated were fixed and labeled for LAMP1 and cathepsin D, then visualized by widefield microscopy. The percentage of cells that had a LAMP1 or cathepsin D organelle over a nominal cut-off size was quantified as described for EEA1. Bars show mean ± SEM, p values generated by one-way ANOVA with Tukey’s correction for multiple testing. Scale bars = 10 μm.
Figure 5
Figure 5
The Atypical ESCRT-III Protein IST1 Accumulates on Endosomes in Human Neurons Lacking VPS4A (A and B) i3Neurons expressing the guides indicated were fixed and labeled for IST1 and EEA1 (A) or IST1 and CD63 (B), then visualized by confocal immunofluorescence microscopy. The number of IST1 puncta per cell and the percentage of EEA1- or CD63-positive endosomes associated with an IST1 punctum was quantified in 3 experiments per marker (in ≥20 cells per experimental condition in each repeat) and plotted in the corresponding charts. Arrows indicate juxtaposed or co-localized puncta. (C) i3Neurons expressing the guides indicated were fixed and labeled for CHMP6, then visualized by confocal immunofluorescence microscopy. The number of CHMP6 puncta per cell was quantified in 3 biological repeats (≥20 cells per experimental condition in each repeat). Bars indicate mean ± SEM, p values calculated by one-way ANOVA with Tukey’s correction for multiple testing. Micrograph scale bar = 10 μm.
Figure 6
Figure 6
Defective VPS4A Function Affects Centrosome Numbers and Mitotic Spindle Organization Confocal microscopy analysis was performed in synchronized skin fibroblasts from subjects with VPS4A mutations and control cells. Images are representative of three stages of the cell cycle (A), interphase (B), metaphase, and anaphase-telophase. Cells were stained using antibodies against pericentrin (centrosome marker) and α-tubulin (microtubules and mitotic spindle); chromosomes with DAPI. Scale bars represent 15 μm. The corresponding graphs show the mean ± SEM of 6 separate counts (≥25 cells/line each) for a total of 200 cells/line scored. p values were calculated by one-way ANOVA with Tukey’s correction for multiple testing.
Figure 7
Figure 7
VPS4A Mutations Cause Aberrant Chromosome Segregation and Alter Cell Cycle Progression (A) Staining performed using a fluorescent probe (anti-lamin A/C green) or Giemsa show a significant increase in micronuclei (arrow), chromosome bridges (arrow) and aneuploidy in proband cells compared to control cells. In experiments to assess micronuclei and chromosome bridges, graphs show the mean ± SEM of 5 (micronuclei) or 4 (chromosome bridges) separate counts (200 cells/line each, micronuclei; 250 cells/line each, chromosome bridges) for a total of 1,000 cells/line scored. In experiments to assess aneuploidy, graphs show mean ± SEM of 3 separate counts (≥30 cells/line each) for a total of 100 cells/line scored. (B) Cell cycle phases of control subjects’ (top) and probands’ (bottom) fibroblasts as measured by BrdU incorporation and propidium iodide (PI) flow cytometry analysis. The upper box identifies cells incorporating BrdU (S phase), the lower left box identifies G0/G1 cells, and the lower right box represents G2/M cells. A representative of three independent experiments is shown. In all experiments, p values were calculated by one-way ANOVA with Tukey’s correction for multiple testing. Graph bars show mean ± SEM.
Figure 8
Figure 8
Proband Fibroblasts Have Abnormal Nuclear Envelope Morphology, Increased DNA Damage, and Abnormal Primary Cilium Morphology (A) An increased number of aberrantly shaped nuclei in fibroblasts carrying the VPS4A mutations was observed versus control cells. Staining was performed using anti-lamin A/C and DAPI. Scale bar is 10 μm. (B) Representative images showing an increase number of γ-H2AX foci in probands’ fibroblasts carrying compared to control cells. The staining was performed using γ-H2AX antibody and DAPI. Scale bar is 2.5 μm. In all experiments, mean ± SEM of 4 separate counts (≥40 cells/line each) for a total of 200 cells/line scored. p values were calculated by one-way ANOVA with Tukey’s correction for multiple testing. (C) Confocal images showing altered primary cilium morphology in proband fibroblasts compared to control cells. Cells heterozygous for the p.Arg284Gly amino acid change show absent cilia with only a visible basal body (dot cilium, zoomed image), whereas cells with the p.Arg284Trp substitution show either a dot cilium or occasionally an elongated or normal cilium (zoomed image). Primary cilia are labeled with acetylated α-tubulin, basal bodies and nuclei are labeled with γ-tubulin and DAPI, respectively. Scale bar is 5 μm. 100 cells were analyzed for each line over two independent experiments, bars represent the mean.

References

    1. McCullough J., Frost A., Sundquist W.I. Structures, Functions, and Dynamics of ESCRT-III/Vps4 Membrane Remodeling and Fission Complexes. Annu. Rev. Cell Dev. Biol. 2018;34:85–109. - PMC - PubMed
    1. Schöneberg J., Lee I.-H., Iwasa J.H., Hurley J.H. Reverse-topology membrane scission by the ESCRT proteins. Nat. Rev. Mol. Cell Biol. 2017;18:5–17. - PMC - PubMed
    1. Vietri M., Radulovic M., Stenmark H. The many functions of ESCRTs. Nat. Rev. Mol. Cell Biol. 2020;21:25–42. - PubMed
    1. Caillat C., Maity S., Miguet N., Roos W.H., Weissenhorn W. The role of VPS4 in ESCRT-III polymer remodeling. Biochem. Soc. Trans. 2019;47:441–448. - PubMed
    1. McCullough J., Clippinger A.K., Talledge N., Skowyra M.L., Saunders M.G., Naismith T.V., Colf L.A., Afonine P., Arthur C., Sundquist W.I. Structure and membrane remodeling activity of ESCRT-III helical polymers. Science. 2015;350:1548–1551. - PMC - PubMed

Publication types

MeSH terms

Substances