. 2021 Jan 11;31(1):150-162.e7.
doi: 10.1016/j.cub.2020.10.012. Epub 2020 Nov 12.

Astroglial Calcium Signaling Encodes Sleep Need in Drosophila

Affiliations

Astroglial Calcium Signaling Encodes Sleep Need in Drosophila

Ian D Blum et al. Curr Biol. .

Abstract

Sleep is under homeostatic control, whereby increasing wakefulness generates sleep need and triggers sleep drive. However, the molecular and cellular pathways by which sleep need is encoded are poorly understood. In addition, the mechanisms underlying both how and when sleep need is transformed to sleep drive are unknown. Here, using ex vivo and in vivo imaging, we show in Drosophila that astroglial Ca2+ signaling increases with sleep need. We demonstrate that this signaling is dependent on a specific L-type Ca2+ channel and is necessary for homeostatic sleep rebound. Thermogenetically increasing Ca2+ in astrocytes induces persistent sleep behavior, and we exploit this phenotype to conduct a genetic screen for genes required for the homeostatic regulation of sleep. From this large-scale screen, we identify TyrRII, a monoaminergic receptor required in astrocytes for sleep homeostasis. TyrRII levels rise following sleep deprivation in a Ca2+-dependent manner, promoting further increases in astrocytic Ca2+ and resulting in a positive-feedback loop. Moreover, our findings suggest that astrocytes then transmit this sleep need to a sleep drive circuit by upregulating and releasing the interleukin-1 analog Spätzle, which then acts on Toll receptors on R5 neurons. These findings define astroglial Ca2+ signaling mechanisms encoding sleep need and reveal dynamic properties of the sleep homeostatic control system.

Keywords: Drosophila; astrocyte; astroglial; calcium; homeostasis; homeostatic; sleep.


Conflict of interest statement

Declaration of Interests The authors declare no competing interests.

Figures

Figure 1.
Figure 1.. Ca2+ signaling in astrocytes correlates with sleep need.
(A) Representative confocal images of pre-photoconversion (Pre-PC) and post-photoconversion (Post-PC) CaMPARI2 signal in the antennal lobe (AL) at ZT0 in the presence or absence of sleep deprivation (SD) from R86E01-GAL4>UAS-CaMPARI2-L398T flies. (B-E) CaMPARI2 signal (Fold R/G) from astrocyte processes (B and D) or cell bodies (C and E) from Superior Medial Protocerebrum (SMP) or AL from R86E01-GAL4>UAS-CaMPARI2-L398T flies at ZT0-3 or ZT12–15 under baseline conditions (AL: n=5 for ZT0-3 and n=6 for ZT12-15; SMP: n=5 for ZT0-3 and n=6 for ZT12-15) or after 12 hrs of SD (AL: n=6 for ZT0-3 and ZT12-15; SMP: n=6 for ZT0-3 and ZT12-15). (F and G) Representative 2-photon images (left) and event traces (right) of SMP from non-sleep-deprived control (F) and sleep-deprived (G) R86E01-GAL4>UAS-myr-GCaMP6s flies at ZT0-2. Each image is the mean intensity of an entire recording from in vivo 2-photon Ca2+-imaging experiments. Data-driven regions of interest (ROIs) that were used to extract event traces are highlighted in white. Corresponding traces and ROIs are numbered. (H) Frequency of events for control (gray) and sleep-deprived (magenta) flies (n=9 flies for control and n=7 flies for SD) expressing membrane-bound GCaMP6s in astrocytes. Scale bars denote 10 μm in all images. For all bar graphs throughout manuscript, mean ± SEM is shown. In this and subsequent Figures, “*”, “**”, “***”, and “ns” denote P<0.05, P<0.01, P<0.001, and not significant, respectively. See also Figure S1.
Figure 2.
Figure 2.. Ca2+ signaling in astrocytes is required for sleep homeostasis.
Mechanical deprivation mini-screen of astrocyte Ca2+-related channels, transporters, and exchangers. Relative change in sleep rebound for R86E01-GAL4>UAS-RNAi flies expressed as a percentage of sleep rebound observed in R86E01-GAL4>UAS-empty vector flies. (B) Sleep recovery curves for R86E01-GAL4>iso31 (gray) vs. R86E01-GAL4>UAS-Ca-α1D-RNAi#1 (green) and R86E01-GAL4>UAS-Ca-α1D-RNAi#2 (magenta) flies. (C and D) Sleep recovered (%) (C) and daily sleep amount (D) for R86E01-GAL4>iso31 (n=54), iso31>UAS-Ca-α1D-RNAi#1 (n=46), R86E01-GAL4>UAS-Ca-α1D-RNAi#1 (n=46), iso31>UAS-Ca-α1D-RNAi#2 (n=63) and R86E01-GAL4>UAS-Ca-α1D-RNAi#2 (n=50) flies. For B-D, N=3 independent trials, with similar results obtained for each trial. (E) Pixel-by-pixel heatmap of CaMPARI2 photoconversion signal in the AL region at ZT0-3 following 12 hr SD in R86E01-GAL4>UAS-CaMPARI2-L398T flies, in the presence or absence of UAS-Ca-α1D-RNAi#1. Dotted squares highlight Ca2+ signals from fine astrocyte processes, and white arrows denote cell bodies. Scale bars denote 10 μm. (F and G) Quantification of average CaMPARI2 signal (Fold R/G) from ROIs targeting astrocyte processes (F) or cell bodies (G) represented in (E). See also Figure S2.
Figure 3.
Figure 3.. Astrocyte activation induces both proximate and delayed sleep.
(A) Sleep profile for iso31>UAS-dTrpA1 (gray) vs alrm-GAL4>UAS-dTrpA1 flies (magenta). Highlighted period denotes 12 hr dTrpA1 activation at 28ºC. (B and C) Sleep amount over a 12 hr period during (B) or 6 hr after (C) dTrpA1 activation for iso31>UAS-dTrpA1 (n=81), alrm-GAL4>UAS-dTrpA1 (n=40), and R86E01-GAL4>UAS-dTrpA1 flies (n=29). For the number of independent trials, N=3, 3, and 2 for iso31>UAS-dTrpA1, alrm-GAL4>UAS-dTrpA1, and R86E01-GAL4>UAS-dTrpA1 respectively. Similar results were obtained in each trial. (D) Sleep profile for iso31>UAS-dTrpA1 (gray) vs R58H05-AD;R46C03-DBD>UAS-dTrpA1 (cyan). Highlighted period denotes 12 hr dTrpA1 activation at 29ºC. (E and F) Sleep amount over a 12 hr period during (B) or 6 hr after (C) dTrpA1 activation for iso31>UAS-dTrpA1 (n=94) and R58H05-AD;R46C03-DBD>UAS-dTrpA1 (n=79) flies. For D-F, N=3 independent trials, with similar results obtained for each trial. See also Figure S3.
Figure 4.
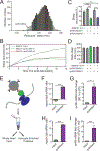
Figure 4.. tyrRII is upregulated with sleep need and required in astrocytes for homeostatic sleep rebound.
(A) Histogram for RNAi genetic screen for alrm-GAL4>UAS-dTrpA1, UAS-RNAi flies (n=3,207 genes, n=4 flies per genotype) showing “rebound” sleep (6 hr post-activation) induced by 1 hr of heat (31°C) from ZT0–1, as described in the STAR Methods. The amount of “rebound sleep” for alrm-GAL4>UAS-TyrRII-RNAi#1-expressing flies is noted. Bars in gray denote values lying +/− 2.5 SD from the mean. (B) Sleep recovery curves for R86E01-GAL4>iso31 (gray) vs R86E01-GAL4>UAS-TyrRII-RNAi#1 (green) and R86E01-GAL4>UAS-TyrRII-RNAi#2 (magenta) flies after overnight (12 hr) SD. (C and D) Sleep recovered (%) (C) and daily sleep amount (D) for R86E01-GAL4>iso31 (n=51), iso31>UAS-TyrRII-RNAi#1 (n=40), R86E01-GAL4>UAS-TyrRII-RNAi#1 (n=43), iso31>UAS-TyrRII-RNAi#2 (n=46), and R86E01-GAL4>UAS-TyrRII-RNAi#2 (n=46). For the number of independent trials, N=3, 3, 3, 4, and 4 for R86E01-GAL4>iso31, iso31>UAS-TyrRII-RNAi#1, R86E01-GAL4>UAS-TyrRII-RNAi#1, iso31>UAS-TyrRII-RNAi#2, and R86E01-GAL4>UAS-TyrRII-RNAi #2, respectively. Similar results were obtained in each trial. (E) Schematic of translating ribosomal affinity purification (TRAP) procedure for isolating actively translating mRNA from genetically-defined astrocytes in whole fly heads. (F) Relative ratio of astrocyte marker (repo) and neural marker (nSyb) mRNA level in whole head flowthrough (input, n=3 replicates) vs astrocyte-TRAP (pulldown, n=3 replicates) samples from sleep deprivation experiment. (G) Relative change in tyrRII mRNA level in astrocyte-TRAP (pulldown) vs whole head (input) samples from R86E01-GAL4>UAS-Rpl10a::EGFP flies which were sleep-deprived (“SD”, n=3 replicates) vs non-sleep deprived (“no SD”, n=3 replicates). (H) Relative ratio of astrocyte marker (repo) and neural marker (nSyb) mRNA level in whole head flowthrough (input, n=3 replicates) vs astrocyte-TRAP (pulldown, n=3 replicates) samples from experiments where astrocytes are thermogenetically activated. (I) Relative fold change in tyrRII mRNA level in astrocyte-TRAP (pulldown) vs whole head (input) samples from thermogenetically activated alrm-QF2>QUAS-dTrpA1; R86E01-GAL4>UAS-Rpl10a::EGFP (n=3 replicates) vs iso31>QUAS-dTrpA1; R86E01-GAL4>UAS-Rpl1a::EGFP (“ctrl”, n=3 replicates) flies. See also Figure S4 and Table S1.
Figure 5.
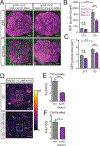
Figure 5.. Astrocytic TyrRII is upregulated with sleep need and participates in a positive-feedback calcium signaling mechanism
(A) Representative images of TyrRII::GFP signal at the AL in the presence or absence of 12 hr sleep deprivation from iso31>UAS-Ca-α1D RNAi#1, Mi{PT-GFSTF.2}TyrRIIMI12699/+ or R86E01-GAL4>UAS-Ca-α1D RNAi#1, Mi{PT-GFSTF.2}TyrRIIMI12699/+ flies. Whole-mount brains were collected from ZT0–1 and immunostained with anti-GFP (green) and anti-BRP (magenta). (B and C) Number (B) and size (C) of TyrRII::GFP puncta in the AL under baseline (ZT0) or SD conditions with (magenta) or without (gray) Ca-α1D knockdown (n=8 for all groups and conditions). (D) Pixel-by-pixel heatmap of CaMPARI2 photoconversion signal in the AL region from ZT0-3 following 12 hr SD in R86E01-GAL4>UAS-CaMPARI2-L398T flies, in the presence (n=9) and absence (n=10) of UAS-TyrRII-RNAi#2. Dotted squares highlight Ca2+ signals from fine astrocyte processes, and white arrows denote cell bodies. (E and F) Quantification of CaMPARI2 signal (Fold R/G) from astrocyte processes (E) or cell bodies (F). Scale bars denote 20 μm in (A) and 10 μm in (D). See also Figure S4.
Figure 6.
Figure 6.. Spatzle, an IL-1 analog, is upregulated in astrocytes with sleep need and required for homeostatic sleep rebound.
(A and B) Representative images of GCaMP (upper panels) and tdTomato (lower panels) fluorescence intensity (A) and relative GCaMP fluorescence intensity (B) in the R5 ring of iso31>UAS-dTrpA1; R58H05-QF2>QUAS-GCaMP6s, QUAS-mtdTomato::3XHA (ctrl, n=5) vs alrm-GAL4>UAS-dTrpA1; R58H05-QF2>QUAS-GCaMP6s, QUAS-mtdTomato::3XHA (n=4) flies at ZT3–5 after 12 hrs of heat treatment from ZT12–24 at 28°C. For (A), dashed lines indicate the R5 ring, and scale bar denotes 20 μm. (C) Relative change in spz mRNA level in sleep-deprived (“SD”, n=3 replicates) vs non-sleep deprived (“no SD”, n=3 replicates) flies from astrocyte-TRAP (pulldown) vs whole head (input) samples. Control repo/nSyb ratios for this experiment are provided in Figure 4F. (D) Relative fold change in spz mRNA level in thermogenetically activated alrm-GAL4>UAS-dTrpA1 (n=3 replicates) vs iso31>UAS-dTrpA1 (n=3 replicates) flies from astrocyte-TRAP (pulldown) vs whole head (input) samples. Control repo/nSyb ratios for this experiment are provided in Figure 4H. (D) Sleep recovery curve for R86E01-GAL4>iso31 (gray), R86E01-GAL4>UAS-spz-RNAi#1 (green), and R86E01-GAL4>UAS-spz-RNAi#2 (magenta) flies. (F and G) Sleep recovered (%) (F) and daily sleep amount (G) for R86E01-GAL4>iso31 (n=56), iso31>UAS-spz-RNAi#1 (n=48), R86E01-GAL4>UAS-spz-RNAi#1 (n=65), iso31>UAS-spz-RNAi#2 (n=50), and R86E01-GAL4>UAS-spz-RNAi#2 (n=85) flies. For the number of independent trials, N=3, 3, 3, 4, and 4 for R86E01-GAL4>iso31, iso31>UAS-spz-RNAi#1, R86E01-GAL4>UAS-spz-RNAi#1, iso31>UAS-spz-RNAi#2, and R86E01-GAL4>UAS-spz-RNAi#2, respectively. Similar results were obtained for each trial. See also Figure S5 and Figure S6.
Figure 7.
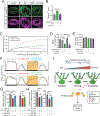
Figure 7.. Astrocytes signal sleep need to the R5 sleep drive circuit via the Toll receptor.
(A and B) Representative images of GCaMP (upper panels) and tdTomato (lower panels) fluorescence intensity (A) and relative GCaMP fluorescence intensity (B) in the R5 ring of R58H05-GAL4>UAS-GCaMP7s, UAS-CD4::tdTomato flies from ZT3–5 in the absence (no SD, n=8) or presence (SD, n=8) of 24 hrs SD vs R58H05-GAL4>UAS-GCaMP7s, UAS-CD4::tdTomato, UAS-Toll-miR (SD + Toll miR, n=7) following 24 hrs SD. For (A), dashed lines indicate the R5 ring, and scale bar denotes 20 μm. (C) Sleep recovery curve of R58H058-GAL4>iso31 (gray), R58H05-GAL4>UAS-Toll-RNAi (green), and R58H05-GAL4>UAS-Toll-miR (magenta). (D and E) Sleep recovered (%) (D) and daily sleep amount (E) for R58H05-GAL4>iso31 (n=84), iso31>UAS-Toll-RNAi (n=84), R58H05-GAL4>UAS-Toll-RNAi (n=100), iso31>UAS-Toll-miR (n=76), and R58H05-GAL4>UAS-Toll-miR (n=79) flies. For the number of independent trials, N=4, 3, 3, 3, and 3 for R58H05-GAL4>iso31, iso31>UAS-Toll-RNAi, R58H05-GAL4>UAS-Toll-RNAi, iso31>UAS-Toll-miR, and R58H05-GAL4>UAS-Toll-miR, respectively. (F) Sleep profile for alrm-QF2>QUAS-dTrpA1 (2nd); iso31>UAS-TNT (gray), iso31>QUAS-dTrpA1 (2nd); R58H05-AD;R46C03-DBD>UAS-TNT (red), and alrm-QF2>QUAS-dTrpA1 (2nd); R58H05-AD;R46C03-DBD>UAS-TNT flies (cyan) in upper panel. Sleep profile for alrm-QF2>QUAS-dTrpA1 (3rd); iso31>UAS-TNT (gray), iso31>QUAS-dTrpA1 (3rd); R72G06-GAL4>UAS-TNT (red), and alrm-QF2>QUAS-dTrpA1 (3rd); R72G06-GAL4>UAS-TNT flies (green) in lower panel. Highlighted period denotes 12 hr dTrpA1 activation at 28ºC. (G and H) (Left) Sleep amount over a 12 hr period during (G) or 6 hr after (H) dTrpA1 activation for alrm-QF2>QUAS-dTrpA1 (2nd); iso31>UAS-TNT (n=94), iso31>QUAS-dTrpA1 (2nd); R58H05-AD;R46C03-DBD>UAS-TNT (n=88), and alrm-QF2>QUAS-dTrpA1 (2nd); R58H05-AD;R46C03-DBD>UAS-TNT flies (n=93). (Right) Sleep amount over a 12 hr period during (G) or 6 hr after (H) dTrpA1 activation for alrm-QF2>QUAS-dTrpA1 (3rd); iso31>UAS-TNT (n=54), iso31>QUAS-dTrpA1 (3rd); R72G06-GAL4>UAS-TNT (n=46), and alrm-QF2>QUAS-dTrpA1 (3rd); R72G06-GAL4>UAS-TNT flies (n=76). For F-H, N=3 independent trials, with similar results obtained for each trial. (I) Model for astroglial Ca2+ signaling in the homeostatic regulation of sleep. Neural activity is increased during wakefulness and sensed by astrocytes, resulting in increased Ca2+ in the processes, which requires specific voltage-gated Ca2+ channels (“Baseline”). Sleep loss generates protracted calcium signaling and leads to upregulation of TyrRII, sensitizing astrocytes to the actions of monoamines that are associated with wakefulness and further increasing Ca2+ levels in these cells (“Priming”). When sufficient sleep need has accumulated, as measured by heightened levels of astroglial Ca2+, transcription/translation of Spz is upregulated (“Potentiated”). Spz is then released and acts on Toll receptors in the R5 neurons to promote global sleep drive. See also Figure S6 and Figure S7.

Comment in

References

    1. Blanchard S, and Bronzino JD (2012). Anatomy and physiology. In Introduction to Biomedical Engineering (Third Edition), Enderle JD and Bronzino JD, eds. (Boston: Academic Press; ), pp. 75–132.
    1. Reichert S, Pavón Arocas O, and Rihel J. (2019). The neuropeptide galanin Is required for homeostatic rebound sleep following increased neuronal activity. Neuron 104, 370–384.e375. - PubMed
    1. Cirelli C, and Tononi G. (2019). Linking the need to sleep with synaptic function. Science. 366, 189–190. - PMC - PubMed
    1. Huber R, Ghilardi MF, Massimini M, and Tononi G. (2004). Local sleep and learning. Nature. 430, 78–81. - PubMed
    1. Rector DM, Schei JL, Van Dongen HP, Belenky G, and Krueger JM (2009). Physiological markers of local sleep. The European journal of neuroscience 29, 1771–1778. - PMC - PubMed

Publication types

MeSH terms

LinkOut - more resources