. 2021 Feb:103:25-32.
doi: 10.1016/j.ijid.2020.10.101. Epub 2020 Nov 10.

CCR5 inhibition in critical COVID-19 patients decreases inflammatory cytokines, increases CD8 T-cells, and decreases SARS-CoV2 RNA in plasma by day 14

Affiliations

CCR5 inhibition in critical COVID-19 patients decreases inflammatory cytokines, increases CD8 T-cells, and decreases SARS-CoV2 RNA in plasma by day 14

Bruce K Patterson et al. Int J Infect Dis. 2021 Feb.

Abstract

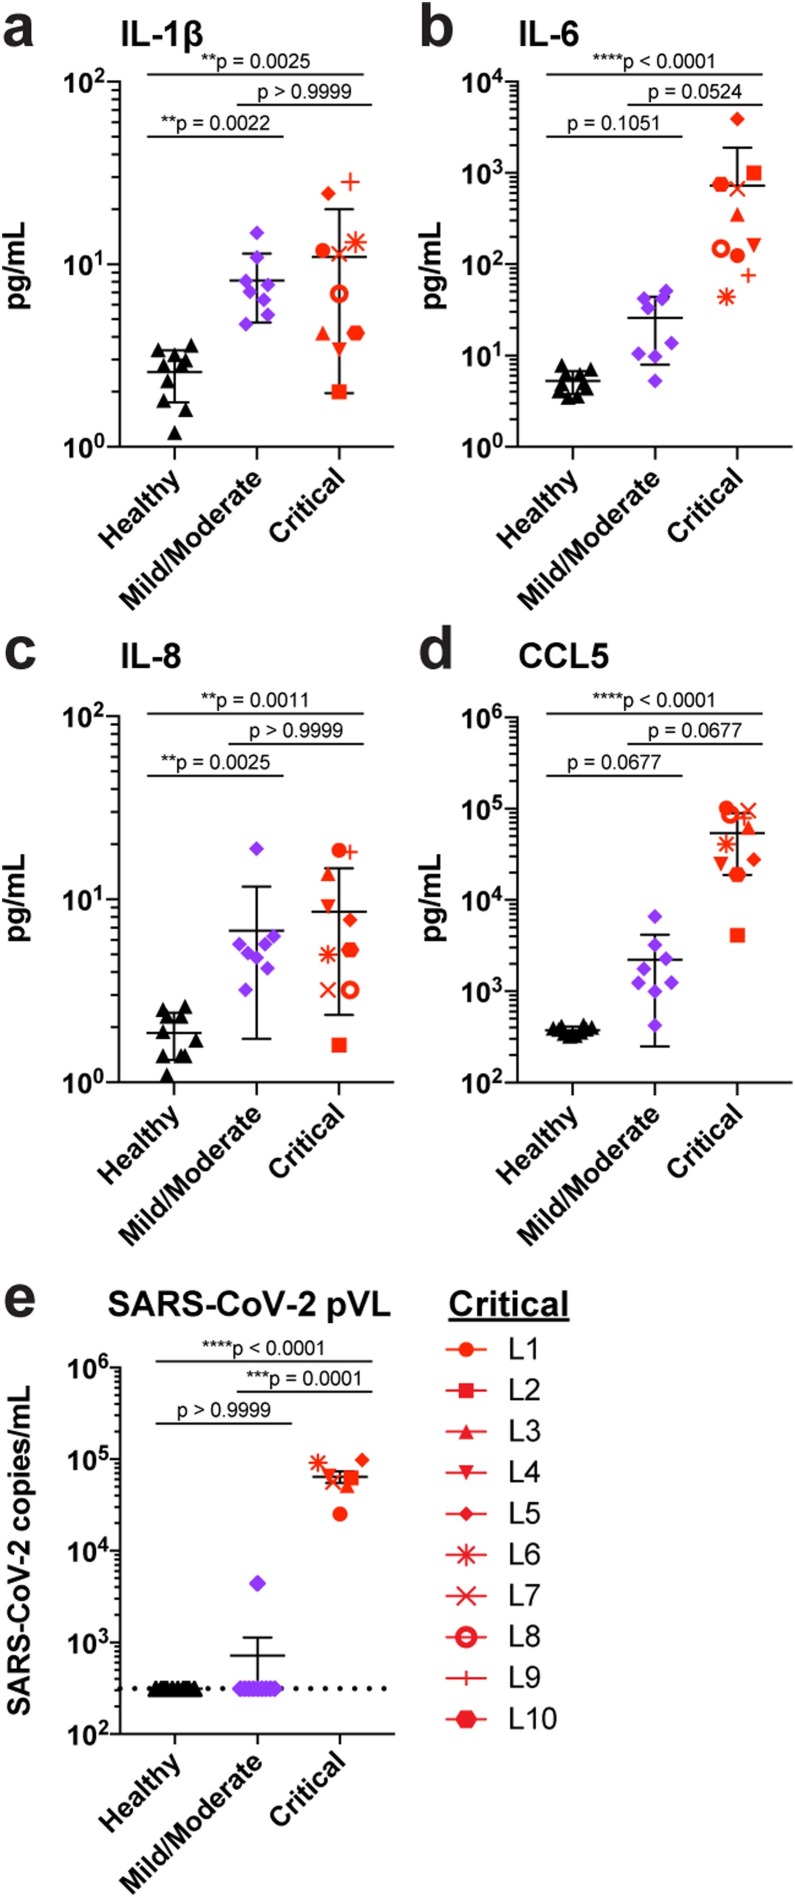
Objective: Infection with severe acute respiratory syndrome coronavirus 2 (SARS-CoV-2) is now a global pandemic. Emerging results indicate a dysregulated immune response. Given the role of CCR5 in immune cell migration and inflammation, we investigated the impact of CCR5 blockade via the CCR5-specific antibody leronlimab on clinical, immunological, and virological parameters in severe COVID-19 patients.

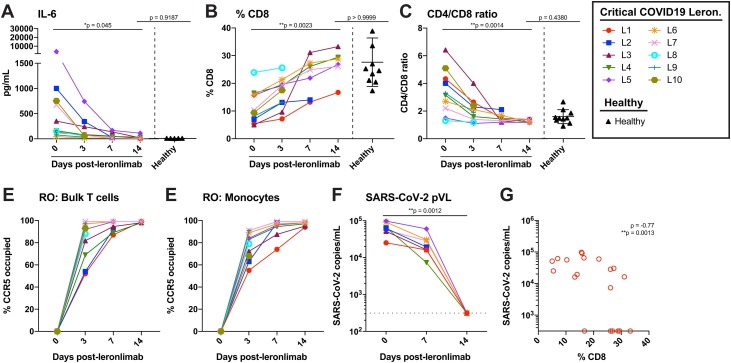
Methods: In March 2020, 10 terminally ill, critical COVID-19 patients received two doses of leronlimab via individual emergency use indication. We analyzed changes in clinical presentation, immune cell populations, inflammation, as well as SARS-CoV-2 plasma viremia before and 14 days after treatment.

Results: Over the 14-day study period, six patients survived, two were extubated, and one discharged. We observed complete CCR5 receptor occupancy in all donors by day 7. Compared with the baseline, we observed a concomitant statistically significant reduction in plasma IL-6, restoration of the CD4/CD8 ratio, and resolution of SARS-CoV2 plasma viremia (pVL). Furthermore, the increase in the CD8 percentage was inversely correlated with the reduction in pVL (r = -0.77, p = 0.0013).

Conclusions: Our study design precludes clinical efficacy inferences but the results implicate CCR5 as a therapeutic target for COVID-19 and they form the basis for ongoing randomized clinical trials.

Keywords: CCR5; COVID-19; Immunotherapy; Leronlimab; Plasma viral load.


Figures

Figure 1
Figure 1
Elevated cytokine, chemokine, and SARS-CoV-2 levels in critically ill COVID-19 patients. (A–E) Plasma levels of IL-1β (A), IL-6 (B), IL-8 (C), CCL5 (D), and SARS-CoV-2 RNA copies (E) in patients with mild/moderate (purple symbols, n = 8) and critical (red symbols, n = 10 in panels a–d, and n = 7 in panel e) COVID-19 disease compared with healthy controls (black symbols, n = 10). Dashed line indicates the LOD. Graphs show p-values calculated using Dunn’s Kruskal–Wallis test: *p ≤ 0.05, ** p ≤ 0.01, ***p ≤ 0.001, ****p ≤ 0.0001.
Figure 2
Figure 2
Reversal of immune dysfunction, CCR5 receptor occupancy, and decrease in SARS-CoV-2 plasma viral loads in critically ill COVID-19 patients after leronlimab administration. (A–C) Plasma levels of IL-6 (A), and peripheral blood CD8+ T cell percentages of CD3+ cells (B) and CD4/CD8 T cell ratio (C) at days 0 (n = 10), 3 (n = 10), 7 (n = 7), and 14 (n = 6) post-leronlimab administration. Healthy controls (n = 10) are shown in black triangles. Critically ill COVID-19 patients not treated with leronlimab are shown in panel A (right, open symbols, n = 5). Graphs show p-values calculated using Dunn’s Kruskal–Wallis test: not significant p > 0.05, *p ≤ 0.05, ** p ≤ 0.01, ***p ≤ 0.001, ****p ≤ 0.0001. (D–E) CCR5 receptor occupancy on peripheral blood bulk T cells (D), and monocytes (E). (F), SARS-CoV-2 plasma viral loads at days 0, 7, and 14 post-leronlimab (left panel, closed symbols, n = 7). Critically ill COVID-19 patients not treated with leronlimab are shown in panel F (right panel, open symbols, n = 5). Horizontal dashed line indicates the LOD. Graph show p-values calculated using the Mann–Whitney test: *p ≤ 0.05, ** p ≤ 0.01, ***p ≤ 0.001, ****p ≤ 0.0001. (G) Plot showing CD8 percentages in blood and SARS-CoV- 2 plasma viral load in seven critically ill COVID-19 patients at days 0, 7, and 14 post-leronlimab (n = 20). Graph shows rho (ρ) and p- values calculated by repeated measures correlation: *p ≤ 0.05, ** p ≤ 0.01, ***p ≤ 0.001, ****p ≤ 0.0001. The 95% confidence interval for the repeated measures correlation was −0.93 to 0.35.
Figure 3
Figure 3
Phenotyping and differential gene expression analyses based on scRNA-seq data. (A) Graph showing the proportion of each cell type in healthy control and leronlimab-treated COVID patient samples. (B) Heatmap of significantly differentially expressed genes (Wilcoxon adjusted p < 0.1) by contrasting either COVID day 0 vs. healthy control (HC) or COVID day 9 vs day 7 post-leronlimab treatment. (C) Venn diagram showing the overlap between genes identified from the contrasts shown.

References

    1. Akalin E., Azzi Y., Bartash R., Seethamraju H., Parides M., Hemmige V., et al. Covid-19 and kidney transplantation. N Engl J Med. 2020 doi: 10.1056/NEJMc2011117. - DOI - PMC - PubMed
    1. Aran D., Looney A.P., Liu L., Wu E., Fong V., Hsu A., et al. Reference-based analysis of lung single-cell sequencing reveals a transitional profibrotic macrophage. Nat Immunol. 2019;20:163–172. - PMC - PubMed
    1. Channappanavar R., Perlman S. Pathogenic human coronavirus infections: causes and consequences of cytokine storm and immunopathology. Semin Immunopathol. 2017;39:529–539. - PMC - PubMed
    1. Chen L., Zhang Q., Yu C., Wang F., Kong X. Functional roles of CCL5/RANTES in liver disease. Liver Res. 2020;4:28–34.
    1. Chua R.L., Lukassen S., Trump S., Hennig B.P., Wendisch D., Pott F., et al. COVID-19 severity correlates with airway epithelium-immune cell interactions identified by single-cell analysis. Nat Biotechnol. 2020;8:970–979. - PubMed