Observational Study
. 2020 Dec 9;6(50):eabe3024.
doi: 10.1126/sciadv.abe3024. Print 2020 Dec.

Distinct inflammatory profiles distinguish COVID-19 from influenza with limited contributions from cytokine storm

Affiliations
Observational Study

Distinct inflammatory profiles distinguish COVID-19 from influenza with limited contributions from cytokine storm

Philip A Mudd et al. Sci Adv. .

Abstract

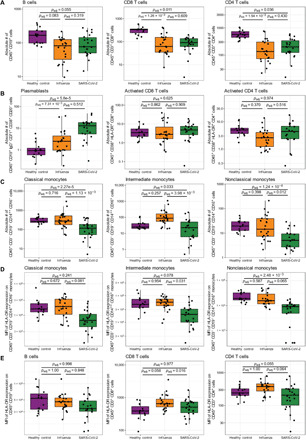
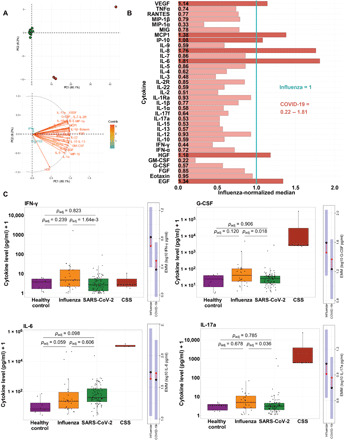
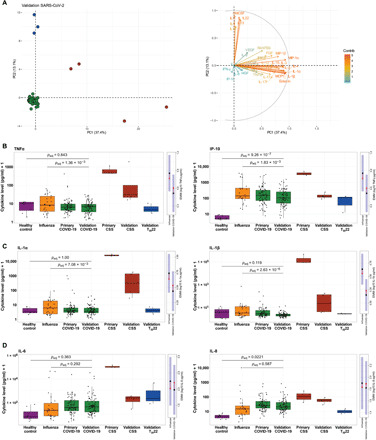
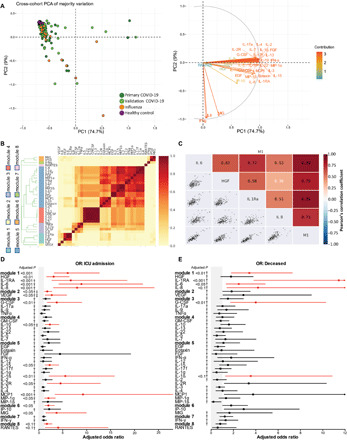
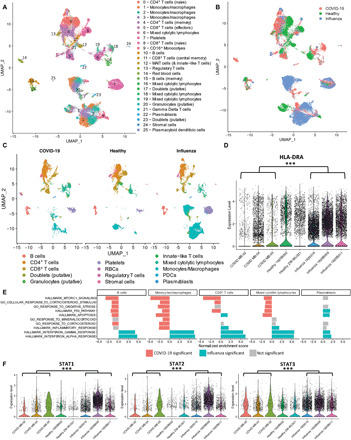
We pursued a study of immune responses in coronavirus disease 2019 (COVID-19) and influenza patients. Compared to patients with influenza, patients with COVID-19 exhibited largely equivalent lymphocyte counts, fewer monocytes, and lower surface human leukocyte antigen (HLA)-class II expression on selected monocyte populations. Furthermore, decreased HLA-DR on intermediate monocytes predicted severe COVID-19 disease. In contrast to prevailing assumptions, very few (7 of 168) patients with COVID-19 exhibited cytokine profiles indicative of cytokine storm syndrome. After controlling for multiple factors including age and sample time point, patients with COVID-19 exhibited lower cytokine levels than patients with influenza. Up-regulation of IL-6, G-CSF, IL-1RA, and MCP1 predicted death in patients with COVID-19 but were not statistically higher than patients with influenza. Single-cell transcriptional profiling revealed profound suppression of interferon signaling among patients with COVID-19. When considered across the spectrum of peripheral immune profiles, patients with COVID-19 are less inflamed than patients with influenza.


Figures

Fig. 1
Fig. 1. Evaluation of circulating lymphocyte and monocyte subpopulations in select healthy controls (N = 15), acute influenza-infected subjects (N = 23), and acute SARS-CoV-2–infected subjects (N = 22).
Absolute numbers of (A) B cells, CD8+ T cells, and CD4+ T cells; (B) circulating B cell plasmablasts, activated CD8+ T cells, and activated CD4+ T cells; and (C) classical, intermediate, and nonclassical monocytes were quantified by flow cytometry. Surface expression of the major histocompatibility complex class 2 molecule, HLA-DR, on the surface of the indicated subpopulations of circulating monocytes (D) and lymphocytes (E) as measured by geometric mean fluorescence intensity (MFI) using flow cytometry. Presented P values are from pairwise comparisons of estimated marginal means of linear regression models that adjust for ethnicity, sex, age, and all comorbidities (immunocompromised, end-stage renal disease, chronic lung disease, chronic heart failure, and diabetes mellitus). P values were adjusted for multiple comparisons using Tukey’s method. For comparisons between COVID-19 and influenza, the models also include days of symptom duration at study enrollment as a covariate. In each case, raw values are plotted on the log10 scale.
Fig. 2
Fig. 2. Selective cytokine up-regulation in patients with COVID-19 from the primary cohort.
(A) Top: PCA of 35 cytokines measured in COVID-19 subjects from the primary cohort. Red circles: patients with CSS; green dots: all other subjects. Samples with missing cytokine data were excluded. Bottom: corresponding PCA loadings indicating effects of each cytokine. (B) Relative cytokine abundance plot, with each cytokine normalized to the respective median cytokine level in influenza subjects. The normalized median cytokine level in influenza patients (1.0) is represented by the vertical blue line. Bar graphs represent the normalized median COVID-19 cytokine level relative to the normalized median influenza cytokine level. Light red bars: cytokine levels lower in COVID-19 than influenza patients (normalized median < 1, n = 28); dark red bars: cytokines levels greater in patients with COVID-19 than in patients with influenza (normalized median > 1, n = 7). (C) Box plots show cytokine concentrations in healthy, influenza, COVID-19, and CSS subjects, with raw values plotted on the log10 scale. P values are from estimated marginal means (EMM) comparisons, averaging over all demographic and clinical factors included as covariates and adjusted for multiple comparisons. To the right of each box plot are EMM plots for the influenza–COVID-19 comparison. Black dot: estimated marginal mean for the log10 concentration of the cytokine, averaged over the levels of all other covariates; blue shading: corresponding 95% confidence interval; red arrows: SE in one direction, with overlapping SE arrows indicating no significant difference between the EMM of a given cytokine in influenza subjects versus COVID-19 subjects.
Fig. 3
Fig. 3. Selective cytokine up-regulation in COVID-19–infected patients from the validation cohort.
(A) Left: PCA of all 35 cytokines measured in the COVID-19 validation cohort. Red circles represent samples with CSS cytokine profiles, blue dots represent samples with TH22 cytokine profiles, and green dots represent the remainder of subjects. Samples with missing cytokine data were excluded. Right: The corresponding PCA loading plot, in which each cytokine has a vector/arrow which points in the direction of increasing cytokine levels. The color and length of the vector represent how strongly each cytokine contributes to a principal component. (B to D) Box plots show cytokine concentrations in healthy, influenza, primary COVID-19, validation COVID-19, primary CSS, validation CSS, and validation TH22 groups for all 35 cytokines measured, with raw values plotted on the log10 scale. Presented P values are from estimated marginal means (EMM) comparisons, averaging over all demographic and clinical factors that were included as covariates and P values adjusted for multiple comparisons. Although TH22 samples were visualized separately, they were included as validation COVID-19 samples in the underlying statistical analyses. To the right of each box plot are EMM plots for the influenza–COVID-19 comparison; the black dot represents the estimated marginal mean for the log10 concentration of the cytokine for a given condition, averaged over the levels of all other covariates (e.g., age, sex, and ethnicity), and the blue shading represents the corresponding 95% confidence interval. The red arrows represent the SE in one direction, with overlapping SE arrows indicating no significant difference between the EMM of a given cytokine in influenza subjects versus COVID-19 subjects.
Fig. 4
Fig. 4. Cross-cohort comparisons.
(A) Left: PCA of 35 cytokines measured across all patient groups in both primary and validation cohorts; all samples with complete cytokine data were included in the analysis, but only the majority of sample variation is included in the visualization. Right: corresponding PCA loadings indicating effects of each cytokine. (B) Correlations of log10 absolute cytokine values are visualized as the proportion of times cytokine pairs clustered together during hierarchical clustering over 1,000 permutations for all COVID-19 patients across cohorts. Colors alongside the dendrogram and cytokine names denote module membership, whereas colors within the heatmap correspond to the ratio of coclustering. (C) Cytokine cocorrelations for all cytokines assigned to Module 1 (M1) are assessed using Pearson’s correlation coefficient. (D and E) Forest plots depicting the adjusted odds ratios obtained from multivariate logistic regression analysis between cytokines and various correlates of COVID-19 disease severity. (D) Cytokine associations with ICU admission. (E) Cytokine associations with death. Logistic regression models used absolute log10-transformed cytokine values and included age, sex, ethnicity, days since symptom onset at enrollment, all reported comorbidities, and cohort as covariates. Gray shading indicates the area of the plots where odds ratios are less than 1, indicative of negative associations. Adjusted odds ratios are indicated with points, and confidence lines encompass the range between the lower and upper limits. Red indicates significance at false discovery rate < 0.1, † indicates that age was a significant covariate, and ‡ indicates that day of sampling after symptom onset was significant.
Fig. 5
Fig. 5. Single-cell gene expression analyses of PBMCs from COVID-19–infected, influenza-infected, and healthy participants demonstrate profound differences in the relative abundance and transcriptional activity of cell subsets across conditions.
(A) Uniform Manifold Approximation and Projection (UMAP) plots depict transcriptional clusters, which (B) vary transcriptionally as a function of condition despite the presence of nearly all subsets across various conditions, as evidenced in (C). (D) Violin plots demonstrate significant down-regulation of HLA-DRA among all cells from COVID-19–infected patients compared to influenza-infected patients (with healthy controls included for reference). Asterisks indicate significance at Bonferroni-corrected P values < 0.001. (E) GSEA analysis of gene expression differences between COVID-19 and influenza groups across major cell subsets. In direct comparison to cells from influenza-infected patients, transcriptional patterns among cells from COVID-19–infected patients reveal significant up-regulation (red bars) of metabolic pathways, stress pathways, and glucocorticoid signaling pathways across major cell subsets, particularly monocytes/macrophages. In contrast, interferon pathways were significantly down-regulated (blue bars) among subsets from COVID-19–infected patients compared to those from influenza-infected patients. Gray bars indicate that tests for enrichment did not meet statistical significance for a particular subset. (F) Violin plots demonstrate significant down-regulation of STAT1, STAT2, and STAT3 among monocytes/macrophages from COVID-19–infected patients compared to influenza-infected patients (with healthy controls included for reference). Asterisks (***) indicate significance at Bonferroni-corrected P values of <0.001.

Update of

References

    1. Chen N., Zhou M., Dong X., Qu J., Gong F., Han Y., Qiu Y., Wang J., Liu Y., Wei Y., Xia J., Yu T., Zhang X., Zhang L., Epidemiological and clinical characteristics of 99 cases of 2019 novel coronavirus pneumonia in Wuhan, China: A descriptive study. Lancet 395, 507–513 (2020). - PMC - PubMed
    1. Guan W.-J., Ni Z.-Y., Hu Y., Liang W.-H., Ou C.-Q., He J.-X., Liu L., Shan H., Lei C.-L., Hui D. S. C., Du B., Li L.-J., Zeng G., Yuen K.-Y., Chen R.-C., Tang C.-L., Wang T., Chen P.-Y., Xiang J., Li S.-Y., Wang J.-L., Liang Z.-J., Peng Y.-X., Wei L., Liu Y., Hu Y.-H., Peng P., Wang J.-M., Liu J.-Y., Chen Z., Li G., Zheng Z.-J., Qiu S.-Q., Luo J., Ye C.-J., Zhu S.-Y., Zhong N.-S.; China Medical Treatment Expert Group for Covid-19 , Clinical characteristics of Coronavirus Disease 2019 in China. N. Engl. J. Med. 382, 1708–1720 (2020). - PMC - PubMed
    1. Huang C., Wang Y., Li X., Ren L., Zhao J., Hu Y., Zhang L., Fan G., Xu J., Gu X., Cheng Z., Yu T., Xia J., Wei Y., Wu W., Xie X., Yin W., Li H., Liu M., Xiao Y., Gao H., Guo L., Xie J., Wang G., Jiang R., Gao Z., Jin Q., Wang J., Cao B., Clinical features of patients infected with 2019 novel coronavirus in Wuhan, China. Lancet 395, 497–506 (2020). - PMC - PubMed
    1. Grasselli G., Zangrillo A., Zanella A., Antonelli M., Cabrini L., Castelli A., Cereda D., Coluccello A., Foti G., Fumagalli R., Iotti G., Latronico N., Lorini L., Merler S., Natalini G., Piatti A., Ranieri M. V., Scandroglio A. M., Storti E., Cecconi M., Pesenti A.; COVID-19 Lombardy ICU Network , Baseline characteristics and outcomes of 1591 patients infected with SARS-CoV-2 admitted to ICUs of the Lombardy Region, Italy. JAMA 323, 1574–1581 (2020). - PMC - PubMed
    1. Bhatraju P. K., Ghassemieh B. J., Nichols M., Kim R., Jerome K. R., Nalla A. K., Greninger A. L., Pipavath S., Wurfel M. M., Evans L., Kritek P. A., West T. E., Luks A., Gerbino A., Dale C. R., Goldman J. D., O’Mahony S., Mikacenic C., Covid-19 in critically ill patients in the Seattle Region - Case series. N. Engl. J. Med. 382, 2012–2022 (2020). - PMC - PubMed

Publication types

MeSH terms