. 2020 Nov 13;6(46):eabc2530.
doi: 10.1126/sciadv.abc2530. Print 2020 Nov.

Multiscale dynamics of colloidal deposition and erosion in porous media

Affiliations

Multiscale dynamics of colloidal deposition and erosion in porous media

Navid Bizmark et al. Sci Adv. .

Abstract

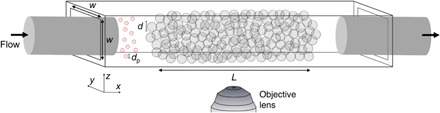
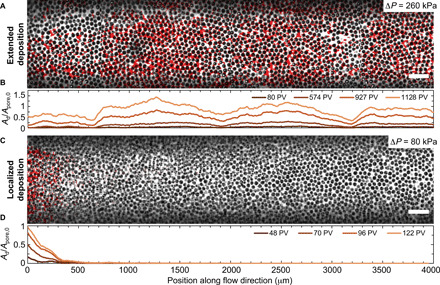
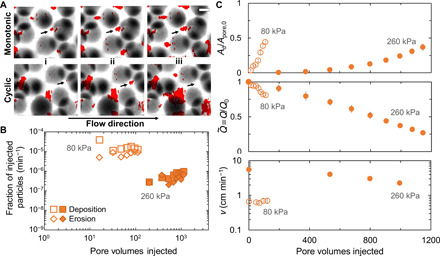
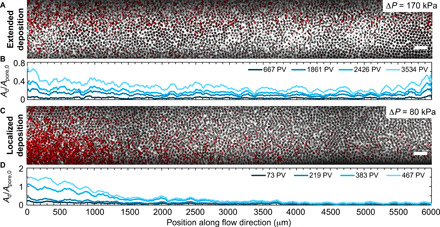
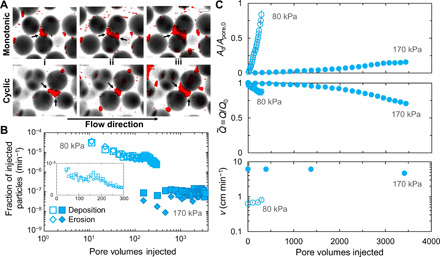
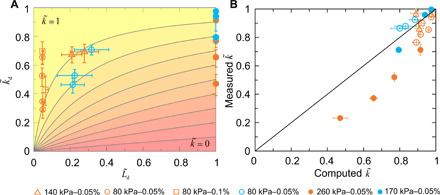
Diverse processes-e.g., environmental pollution, groundwater remediation, oil recovery, filtration, and drug delivery-involve the transport of colloidal particles in porous media. Using confocal microscopy, we directly visualize this process in situ and thereby identify the fundamental mechanisms by which particles are distributed throughout a medium. At high injection pressures, hydrodynamic stresses cause particles to be continually deposited on and eroded from the solid matrix-notably, forcing them to be distributed throughout the entire medium. By contrast, at low injection pressures, the relative influence of erosion is suppressed, causing particles to localize near the inlet of the medium. Unexpectedly, these macroscopic distribution behaviors depend on imposed pressure in similar ways for particles of different charges, although the pore-scale distribution of deposition is sensitive to particle charge. These results reveal how the multiscale interactions between fluid, particles, and the solid matrix control how colloids are distributed in a porous medium.


Figures

Fig. 1
Fig. 1. Schematic of experimental setup.
Our experiments are performed using 3D porous media composed of glass beads of diameter d between 38 and 45 μm, densely packed within thin-walled square quartz capillaries with cross-sectional length w = 1 mm. A dilute colloidal suspension containing particles of diameter dp = 1 μm is injected through the pore space at a fixed imposed pressure drop. The fluorescent particles are visualized at scales ranging from that of individual pores to the overall porous medium using confocal microscopy.
Fig. 2
Fig. 2. Macroscopic deposition profile of positively charged colloidal particles is tuned by injection pressure.
Confocal micrographs show extended (A) and localized (C) deposition profiles after t = 3.1 and 1.9 hours for amine-functionalized polystyrene particles injected at 260 or 80 kPa, respectively. Black circles show cross sections through the beads making up the porous media, white space shows pore space, and red shows deposited colloidal particles. Corresponding line traces in (B) and (D) show the amount of deposition at each position along the flow direction, quantified by Ad/Apore,0, where Ad is the laterally averaged area occupied by deposited particles and Apore,0 is the pore space area before colloidal injection. Traces show Ad with a running average over every 100 μm along the length of the medium to minimize noise; different traces are shown for images obtained every 2 min in (B) and 3 min in (D), which we represent by the total number of suspension PVs injected. The traces exhibit some spatial fluctuations that likely reflect the influence of packing heterogeneities in the disordered media. In some cases, Ad/Apore,0 slightly exceeds one due to the nonzero thickness of the optical slice. For clarity, we only show the deposition profile for the first 4000 μm of the media, shorter than their full lengths. Flow direction is from left to right, and the scale bars represent 200 μm.
Fig. 3
Fig. 3. Deposition and erosion of positively charged colloidal particles at the pore scale.
(A) Arrows in the upper and lower sequences of micrographs show monotonic deposition and cyclic deposition–erosion of particles upstream of a bead, respectively, at 260 kPa. (i) to (iii) show micrographs after the injection of 675, 903, and 1074 total PVs of the colloidal suspension. Black circles show cross sections through the beads making up the porous media, white space shows pore space, and red shows deposited colloidal particles. Scale bar, 20 μm. (B) Rates of particle deposition (squares) and erosion (diamonds), calculated by subtracting successive images, are shown as a function of total PVs injected for 260 and 80 kPa, indicated by the filled and open symbols, respectively. (C) Top, middle, and bottom panels show the fraction of the pore space area occupied by deposited particles Ad/Apore,0, the volumetric flow rate Q normalized by its initial value (1.5 ml/hour for 260 kPa and 0.15 ml/hour for 80 kPa), and the interstitial flow speed, respectively, as they vary with the total PVs injected. Experiments at 260 and 80 kPa are indicated by filled and open symbols, respectively. All data are for amine-functionalized polystyrene particles. Error bars in (C) reflect uncertainty arising from binarizing the micrographs or from variation in flow rate measurements, as detailed in the Supplementary Materials. Error bars that are not observable in (C) are smaller than the symbol size.
Fig. 4
Fig. 4. Macroscopic deposition profile of negatively charged colloidal particles is tuned by injection pressure.
Confocal micrographs show extended (A) and localized (C) deposition profiles after t = 5.6 and 16.7 hours for carboxyl-functionalized polystyrene particles injected at 170 or 80 kPa, respectively. Black circles show cross sections through the beads making up the porous media, white space shows pore space, and red shows deposited colloidal particles. Corresponding line traces in (B) and (D) show the amount of deposition at each position along the flow direction, quantified by Ad/Apore,0, where Ad is the laterally averaged area occupied by deposited particles and Apore,0 is the pore space area before colloidal injection. Traces show Ad with a running average over every 100 μm along the length of the medium to minimize noise; different traces are shown for images obtained every 3 min in (B) and 2 min in (D), which we represent by the total number of suspension PVs injected. The traces exhibit some spatial fluctuations that likely reflect the influence of packing heterogeneities in the disordered media. In some cases, Ad/Apore,0 slightly exceeds one due to the nonzero thickness of the optical slice. For clarity, we only show the deposition profile for the first 6000 μm of the media, shorter than their full lengths. Flow direction is from left to right, and the scale bars represent 200 μm.
Fig. 5
Fig. 5. Deposition and erosion of negatively charged colloidal particles at the pore scale.
(A) Arrows in the upper and lower sequences of micrographs show monotonic deposition and cyclic deposition–erosion of particles upstream of a bead, respectively, at 170 kPa. (i) to (iii) show micrographs after the injection of 610, 1376, and 2603 total PVs of colloidal suspension. Black circles show cross sections through the beads making up the porous media, white space shows pore space, and red shows deposited colloidal particles. Scale bar, 20 μm. (B) Rates of particle deposition (squares) and erosion (diamonds), calculated by subtracting successive images, are shown as a function of total PVs injected for 170 and 80 kPa, indicated by the filled and open symbols, respectively. (C) Top, middle, and bottom panels show the fraction of the pore space area occupied by deposited particles Ad/Apore,0, the volumetric flow rate Q normalized by its initial value (1.2 ml/hour for 170 kPa and 0.16 ml/hour for 80 kPa), and the interstitial flow speed, respectively, as they vary with the total PVs injected. Experiments at 170 and 80 kPa are indicated by filled and open symbols, respectively. All data are for carboxyl-functionalized polystyrene particles. Error bars in (C) reflect uncertainty arising from binarizing the micrographs or from variation in flow rate measurements, as detailed in the Supplementary Materials. Error bars that are not observable in (C) are smaller than the symbol size.
Fig. 6
Fig. 6. Pore-scale and macroscopic features of colloidal deposition control overall flow behavior.
(A) Color map showing the normalized overall permeability of the medium, k˜k/k0, calculated using Eq. 2 of the main text for different values of the normalized permeability and length of the particle-deposited region, k~dkd/k0 and L~dLd/L, respectively. Yellow represents k˜=1, while pink represents k˜=0. (B) Measurements of the overall permeability of the medium, represented by the vertical axis, are in reasonable agreement with the prediction of Eq. 2, represented by the horizontal axis. Diagonal line shows a one-to-one relation. The deviation of the measurements from this relation as deposition progresses and k˜ decreases likely arises from the simplifying assumption that the deposited and pristine regions can be treated separately, with a homogeneous permeability in each; in reality, the amount of deposition varies spatially as well. Different points in both panels represent different experiments carried out for amine- or carboxyl-functionalized particles (orange or blue), at different imposed pressures, and using different particle volume fractions, as indicated by the legend underneath. Multiple points show different time points of each experiment. Error bars reflect uncertainty arising from binarizing the micrographs, defining a threshold for Ld, or from variation in flow rate measurements, as detailed in the Supplementary Materials.

Similar articles

Cited by

References

    1. Phenrat T., Kim H.-J., Fagerlund F., Illangasekare T., Tilton R. D., Lowry G. V., Particle size distribution, concentration, and magnetic attraction affect transport of polymer-modified Fe0 nanoparticles in sand columns. Environ. Sci. Technol. 43, 5079–5085 (2009). - PubMed
    1. Zhao X., Liu W., Cai Z., Han B., Qian T., Zhao D., An overview of preparation and applications of stabilized zero-valent iron nanoparticles for soil and groundwater remediation. Water Res. 100, 245–266 (2016). - PubMed
    1. Kanel S. R., Grenèche J.-M., Choi H., Arsenic(V) removal from groundwater using nano scale zero-valent iron as a colloidal reactive barrier material. Environ. Sci. Technol. 40, 2045–2050 (2006). - PubMed
    1. Zhang H., Nikolov A., Wasan D., Enhanced oil recovery (EOR) using nanoparticle dispersions: Underlying mechanism and imbibition experiments. Energy Fuel 28, 3002–3009 (2014).
    1. Tang R., Kim C. S., Solfiell D. J., Rana S., Mout R., Velázquez-Delgado E. M., Chompoosor A., Jeong Y., Yan B., Zhu Z.-J., Kim C., Hardy J. A., Rotello V. M., Direct delivery of functional proteins and enzymes to the cytosol using nanoparticle-stabilized nanocapsules. ACS Nano 7, 6667–6673 (2013). - PMC - PubMed

LinkOut - more resources