. 2021 Jan 15;224(Pt 2):jeb229377.
doi: 10.1242/jeb.229377.

FreeClimber: automated quantification of climbing performance in Drosophila

Affiliations

FreeClimber: automated quantification of climbing performance in Drosophila

Adam N Spierer et al. J Exp Biol. .

Abstract

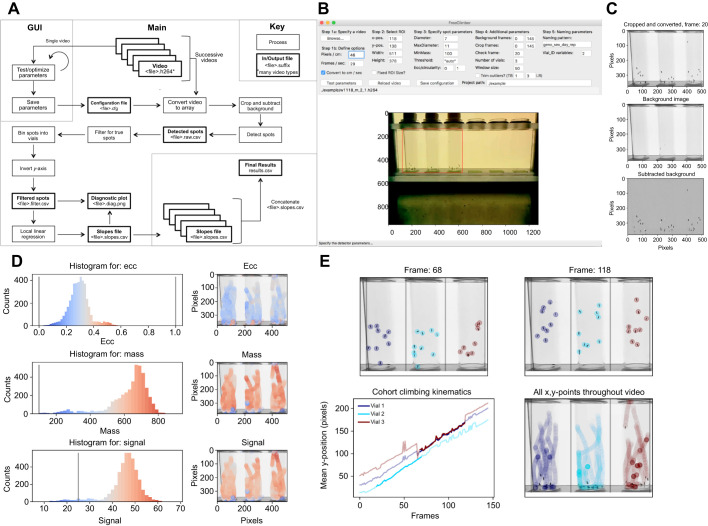
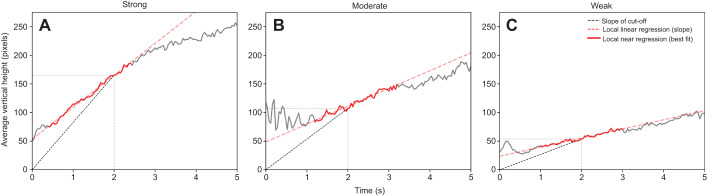
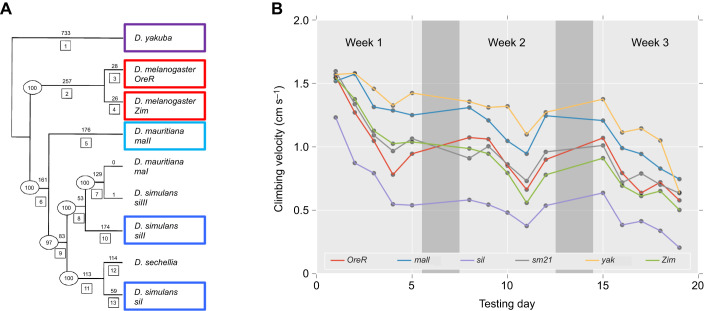
Negative geotaxis (climbing) performance is a useful metric for quantifying Drosophila health. Manual methods to quantify climbing performance are tedious and often biased, while many available computational methods have challenging hardware or software requirements. We present an alternative: FreeClimber. This open source, Python-based platform subtracts a video's static background to improve detection for flies moving across heterogeneous backgrounds. FreeClimber calculates a cohort's velocity as the slope of the most linear portion of a mean vertical position versus time curve. It can run from a graphical user interface for optimization or a command line interface for high-throughput and automated batch processing, improving accessibility for users with different expertise. FreeClimber outputs calculated slopes, spot locations for follow-up analyses (e.g. tracking), and several visualizations and plots. We demonstrate FreeClimber's utility in a longitudinal study for endurance exercise performance in Drosophila mitonuclear genotypes using six distinct mitochondrial haplotypes paired with a common D. melanogaster nuclear background.

Keywords: Automated behavioral analysis; Insect locomotion; Longitudinal performance screen; Python; RING assay; Rapid iterative negative geotaxis assay; Spot detection.


Conflict of interest statement

Competing interestsThe authors declare no competing or financial interests.

Figures

Fig. 1.
Fig. 1.
Overview of FreeClimber platform. (A) Flow diagram of FreeClimber's processes. (B) The graphical user interface (GUI) is designed for parameter optimization with the region of interest (ROI) outlined in red. (C) Visualization of background subtraction shows the original image recolored and cropped (top), the static background matrix (middle) and the final subtracted image used for spot detection (bottom). (D) Optimization plots visualize the distribution and location of each spot and its respective metric: ecc (eccentricity, roundness), mass and signal. (E) Visualization of spot locations in the first and last frames of the most linear segment of all flies climbing (top), the most linear portion (darker shade) of the mean-vertical position versus the frame curve plotted over all frames (lighter shade) for an indicated vial (lower-left), and all x,y-coordinates throughout the video (lower-right). Note: with the exception of A, all figure panels are generated as outputs or from screenshots of FreeClimber.
Fig. 2.
Fig. 2.
Local linear regression provides an objective measure of climbing performance. Mean vertical position versus time (velocity, solid gray line) plots for a cohort of flies measured at (A) 5 days, (B) 10 days and (C) 20 days post-eclosion. The slope of the standard, time-based cut-off at 2 s (black dashed line) is steeper than the line of best fit (red dashed line) during the most linear 2 s of a 5 s climb (red solid line). Note: these figure panels were not generated by FreeClimber.
Fig. 3.
Fig. 3.
Mitochondrial haplotypes show a differential response to endurance exercise conditioning and resistance to endurance fatigue. (A) Phylogenetically distinct mitochondrial haplotypes were derived from four clades (D. melanogaster, red; D. simulans, blue; D. mauritiana, cyan; and D. yakuba, purple). Phylogenetic tree modified from Ballard (2000) with sm21 as a subgroup of siII. (B) These mitochondrial haplotypes, on a common nuclear background (D. melanogaster w1118), were subjected to a 3 week endurance exercise conditioning program. Flies were tested on weekdays (light gray) before exercise conditioning on a Power Tower, and allowed to rest on weekends (dark gray). Points represent the mean velocity for all flies of a genotype across replicates (n=1007 videos total). As there was no significant conditioning effect (P=0.83; Table S1), conditions were averaged together. Most mitotypes began at roughly the same starting velocity, though differed in their age-associated performance decline; yak;w1118 (yak, yellow) and maII;w1118 (maII, blue) were the strongest overall, while siI;w1118 (siI, purple) was the weakest. Note: the color codes differ between A and B, and these figure panels were not generated by FreeClimber.

References

    1. Ballard J. W. O. (2000). Comparative genomics of mitochondrial DNA in members of the Drosophila melanogaster subgroup. J. Mol. Evol. 51, 48-63. 10.1007/s002390010066 - DOI - PubMed
    1. Bellen H. J., Levis R. W., He Y. C., Carlson J. W., Evans-Holm M., Bae E., Kim J., Metaxakis A., Savakis C., Schulze K. L. et al. (2011). The Drosophila gene disruption project: progress using transposons with distinctive site specificities. Genetics 188, U731-U341 10.1534/genetics.111.126995 - DOI - PMC - PubMed
    1. Cao W. Z., Song L., Cheng J. J., Yi N., Cai L. Y., Huang F. D. and Ho M (2017). An automated rapid iterative negative geotaxis assay for analyzing adult climbing behavior in a Drosophila Model of neurodegeneration. J. Vis. Exp. 127, 56507 10.3791/56507 - DOI - PMC - PubMed
    1. Chenouard N., Smal I., De Chaumont F., Maška M., Sbalzarini I. F., Gong Y., Cardinale J., Carthel C., Coraluppi S. and Winter M (2014). Objective comparison of particle tracking methods. Nat. Methods 11, 281 10.1038/nmeth.2808 - DOI - PMC - PubMed
    1. Chow C. Y. and Reiter L. T (2017). Etiology of human genetic disease on the fly. Trends Genet. 33, 391-398. 10.1016/j.tig.2017.03.007 - DOI - PubMed

Publication types

LinkOut - more resources