. 2020 Dec 9;40(50):9692-9700.
doi: 10.1523/JNEUROSCI.1885-20.2020. Epub 2020 Nov 13.

Mapping the Dynamic Recruitment of Spinal Neurons during Fictive Locomotion

Affiliations

Mapping the Dynamic Recruitment of Spinal Neurons during Fictive Locomotion

Vladimir Rancic et al. J Neurosci. .

Abstract

The basic rhythmic activity that underlies stepping is generated by a neural network, situated in the spinal cord, known as the locomotor central pattern generator (CPG). While a series of lesion experiments have demonstrated that the mammalian locomotor CPG is distributed throughout the ventral portion of the caudal spinal cord, the specific transverse distribution of this neural network is unclear. Here we evoke fictive locomotor activity of various frequencies in upright spinal cords prepared from male and female neonatal mice. This preparation enables us to use an imaging approach to identify locomotor-related cells across the transverse plane of the spinal cord. Results indicate that there is a clear shift in the recruitment of cells toward the ventromedial, and away from the ventrolateral, spinal cord as the frequency of fictive locomotion increases. Surprisingly, the analysis of multiple frequencies of fictive locomotion in the same spinal cord indicates that few neurons are involved in locomotor outputs across multiple speeds. Collectively, these experiments allow us to map the transverse distribution of the locomotor CPG and highlight the pattern of dynamic recruitment that occurs within this neural circuit as the frequency is altered. Our findings are consistent with data indicating that there is a speed-dependent recruitment of interneuronal populations during locomotion and suggest that the locomotor CPG is not a static network, but rather the specific cells recruited vary extensively based on demand.SIGNIFICANCE STATEMENT In this article, we use an imaging approach to identify all those cells that are rhythmically active at the same frequency as fictive locomotion recorded from the ventral roots of the isolated spinal cord. These experiments allow us to map the distribution of locomotor-related cells across the transverse plane of the spinal cord and identify the recruitment pattern of these cells as the frequency of locomotor outputs is altered. Our results indicate that there are drastic changes in the specific neurons activated at different frequencies and provide support for the concept that the locomotor central pattern generator is a modular network with speed-dependent recruitment of interneuronal components.

Keywords: CPG; interneuron; locomotion.


Figures

Figure 1.
Figure 1.
A–C, Different frequencies of fictive locomotion evoked with NMDA/5-HT. Slow (A; evoked with 3.9 μm NMDA, 10 μm 5-HT), medium (B; evoked with 5 μm NMDA, 10 μm 5-HT), and fast (C; evoked with 10 μm NMDA, 10 μm 5-HT) bouts of fictive locomotion are marked by alternation of left and right flexor-related (L2) ventral root activity. This can be seen in the ENG recordings (left) and group polar plots (right), in which each point represents the vector from an individual experiment.
Figure 2.
Figure 2.
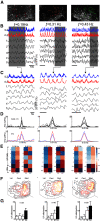
Distribution of locomotor-related cells at different frequencies of fictive locomotion. A, Ventral hemi-cords after injection of Ca2+ indicator in which locomotor-related neurons are identified during a bout of slow (red circles), medium (orange circles), and fast (green circles) fictive locomotion. Scale bar, 50 µm. B, Alternating ENG activity in the left and right L2 ventral roots, and Ca2+ oscillations (represented as ΔF/F) in five locomotor-related cells (specific cells are identified in A) can be seen during slow (left, evoked with 3 μm NMDA, 30 μm 5-HT), medium (middle, evoked with 2 μm NMDA, 10 μm 5-HT), and fast (right, evoked with 10 μm NMDA, 7 μm 5-HT) bouts of fictive locomotion. C, Shaded region for each set of traces is expanded. Calibration: B, 10 s; C, 5 s. D, Spectral analysis indicates that the primary frequency of oscillation for the five oscillatory cells (top plots) is the same as that for the ventral roots (bottom plots) for slow, medium, and fast fictive locomotion. E, Cross-correlation matrices in which the activity of four LR cells is related to ipsilateral (iL2) and contralateral (cL2) ventral root activity for two spinal cords during slow, medium, and fast fictive locomotion. Scale to the right applies to all plots, with values of 1.0 indicating completely in phase and −1.0 indicating completely out of phase. F, Contour plots indicating the distribution of all locomotor-related cells in multiple spinal cords at slow (n = 23), medium (n = 46), and fast (n = 26) frequency of fictive locomotion. Vertical gray lines divide the hemi-cord into lateral, central, and medial sectors. G, Mean number of LR cells (±SD) per preparation in the lateral (L), central (C), and medial (M) sectors as well as the total number of LR cells (Tot) at each frequency.
Figure 3.
Figure 3.
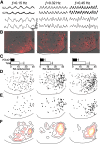
Dynamic changes in recruitment pattern between slow and medium frequencies of fictive locomotion. A, Slow (left) and medium (right) speeds of fictive locomotion evoked in the same spinal cord via bath application of 5-HT and NMDA. Immediately below the ventral root recordings from the left (lL2) and right (rL2) ventral roots, Ca2+ activity (represented as ΔF/F) in three cells in the ventromedial spinal cord is illustrated. Cell 1 is locomotor related (in phase with rL2) during both slow and medium frequencies of fictive locomotion. Cell 2 is locomotor related (in phase with rL2) during the slow, but not the medium, frequency. Cell 3 is locomotor related (in phase with rL2) during the medium, but not the slow, frequency of fictive locomotion. B, Ventral hemi-cords after the injection of Ca2+ indicator in which LR cells are identified during a bout of slow (red circles) and medium (orange circles) fictive locomotion. Those cells that are LR during bouts of both slow and medium frequencies of fictive locomotion are surrounded by a black circle. Scale bar, 50 µm. Cells 1, 2, and 3 from A are identified in both images. C, D, Dot (C) and contour (D) plots indicating the location and distribution of all LR cells at each speed of fictive locomotion in eight spinal cords. Dots with black centers indicate those cells that are LR at both speeds. E, Dot plot indicating that all cells that were LR at both slow and medium frequencies of fictive locomotion in the eight spinal cords investigated. Vertical gray lines divide the hemi-cord into lateral, central, and medial sectors. F, Mean number of LR cells (±SD) per preparation in spinal cords locomoting at slow (red) and medium (orange) frequencies as well as the mean number that are LR at both speeds (black).
Figure 4.
Figure 4.
Dynamic changes in recruitment pattern between medium and fast frequencies of fictive locomotion. A, Medium (left) and fast (right) speeds of fictive locomotion evoked in the same spinal cord via bath application of 5-HT and NMDA. Immediately below the ventral root recordings from the left (lL2) and right (rL2) ventral roots, Ca2+ activity (represented as ΔF/F) in three LR cells in the ventromedial spinal cord is illustrated. Cell 1 bursts in phase with lL2 during both medium and fast frequencies of fictive locomotion. Cell 2 bursts in phase with rL2 during the medium but not the fast frequency. Cell 3 bursts in phase with lL2 during the fast, but not the medium, frequency of fictive locomotion. B, Ventral hemi-cords after the injection of Ca2+ indicator. LR cells are indicated by orange (left-medium frequency) or green (right-fast frequency) circles with cells that are LR at both frequencies surrounded by a black circle. Scale bar, 50 µm. Cells 1, 2, and 3 from A are identified in both images. C, D, Dot (C) and contour (D) plots indicating the location and distribution of all LR cells at either speed of fictive locomotion. Dots with black centers indicate those cells that are LR at both speeds. E, Dot plot indicating that all cells that were LR at both medium and fast frequencies of fictive locomotion (n = 10 spinal cords). F, Mean number of LR cells (±SD) per preparation in spinal cords locomoting at medium (orange) and fast (green) frequencies as well as the mean number that are LR at both speeds (black).
Figure 5.
Figure 5.
Recruitment pattern of glutamatergic neurons is altered as locomotor speed increases. A, Slow (left), medium (middle), and fast (right) fictive locomotion (evoked via bath application of 5-HT and NMDA) in spinal cords from VGlut2Cre:ROSA26tdtomato mice. Below the ENG recordings from left (lL2) and right (rL2) Ca2+ activity (represented as ΔF/F) from two LR cells is illustrated. For each frequency of fictive locomotion cell 1 is VGlut2+ and cell 2 is VGlut2. B, Ventral hemi-cords of VGlut2Cre:ROSA26tdtomato mice in which VGlut2+ cells appear red. LR cells are identified during a bout of fictive locomotion, with open circles indicating VGlut2 LR cells and filled circles indicated VGlut2+ LR cells. Scale bar, 50 µm. Cells 1 and 2 from A are indicated for each frequency of fictive locomotion. C, Bar graphs indicating the mean number of LR cells as well as VGlut2+ LR cells at each locomotor frequency (n = 10 for each fictive locomotor frequency). D, E, Dot plots indicating the distribution of all LR cells at each speed of fictive locomotion (D) in which VGlut2+ LR cells are indicated by filled circles and VGlut2 by open circles; VGlut2+ cells alone are illustrated in E to draw attention to the medial shift in the recruitment of these cells as fictive locomotor speed increases. F, Contour plot to accompany E, which highlights the distribution of VGlut2+ LR cells.

References

    1. Alvarez-Maubecin V, García-Hernández F, Williams JY, Van B (2000) Functional coupling between neurons and glia. J Neurosci 20:4091–4098. 10.1523/JNEUROSCI.20-11-04091.2000 - DOI - PMC - PubMed
    1. Ampatzis K, Song J, Ausborn J, El Manira A (2014) Separate microcircuit modules of distinct v2a interneurons and motoneurons control the speed of locomotion. Neuron 83:934–943. 10.1016/j.neuron.2014.07.018 - DOI - PubMed
    1. Amzica F, Massimini M, Manfridi A (2002) Spatial buffering during slow and paroxysmal sleep oscillations in cortical networks of glial cells in vivo. J Neurosci 22:1042–1053. 10.1523/JNEUROSCI.22-03-01042.2002 - DOI - PMC - PubMed
    1. Antri M, Mellen N, Cazalets JR (2011) Functional organization of locomotor interneurons in the ventral lumbar spinal cord of the newborn rat. PLoS One 6:e20529 10.1371/journal.pone.0020529 - DOI - PMC - PubMed
    1. Atallah BV, Scanziani M (2009) Instantaneous modulation of gamma oscillation frequency by balancing excitation with inhibition. Neuron 62:566–577. 10.1016/j.neuron.2009.04.027 - DOI - PMC - PubMed

Publication types

Grants and funding

LinkOut - more resources