. 2020 Dec 1;117(48):30159-30170.
doi: 10.1073/pnas.2012025117. Epub 2020 Nov 13.

From particle attachment to space-filling coral skeletons

Affiliations

From particle attachment to space-filling coral skeletons

Chang-Yu Sun et al. Proc Natl Acad Sci U S A. .

Abstract

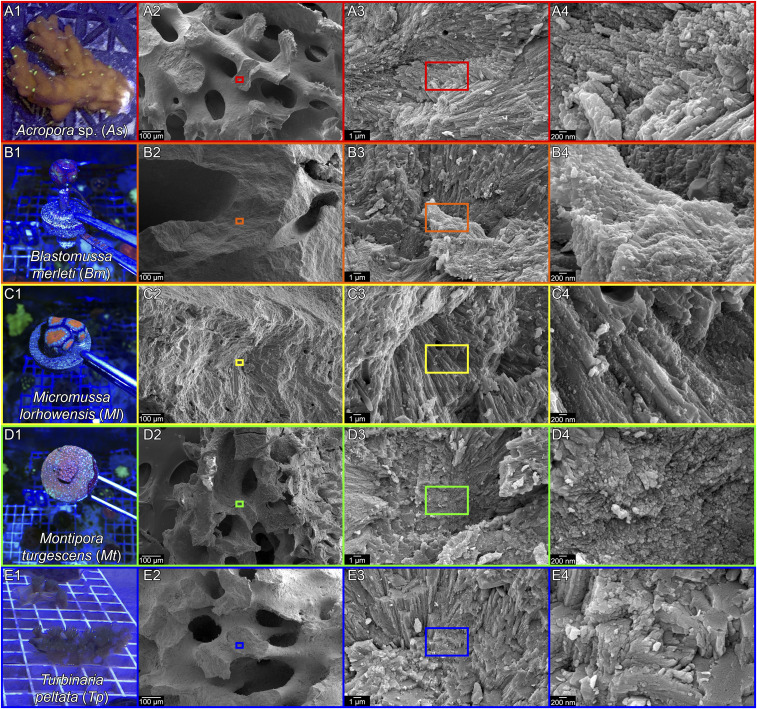
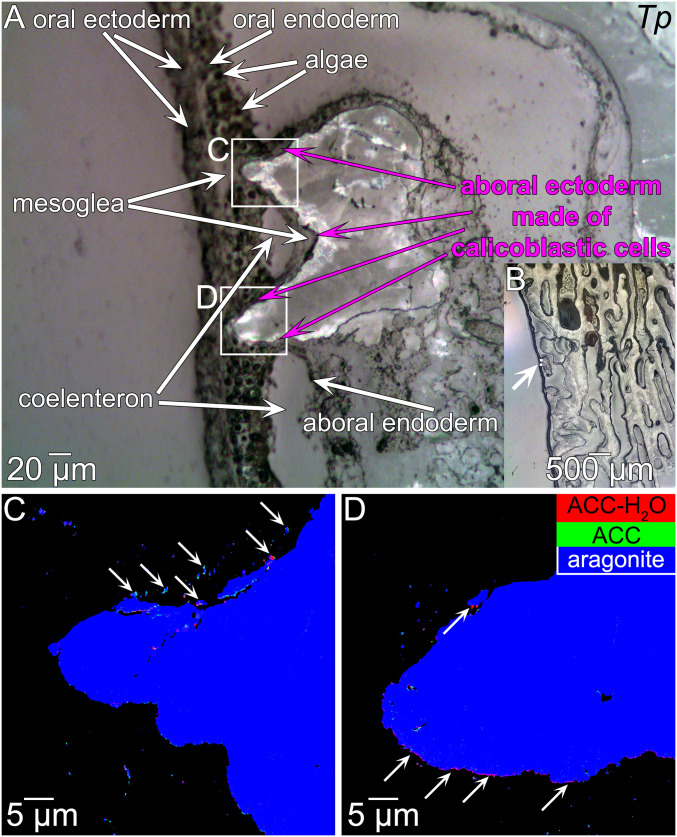
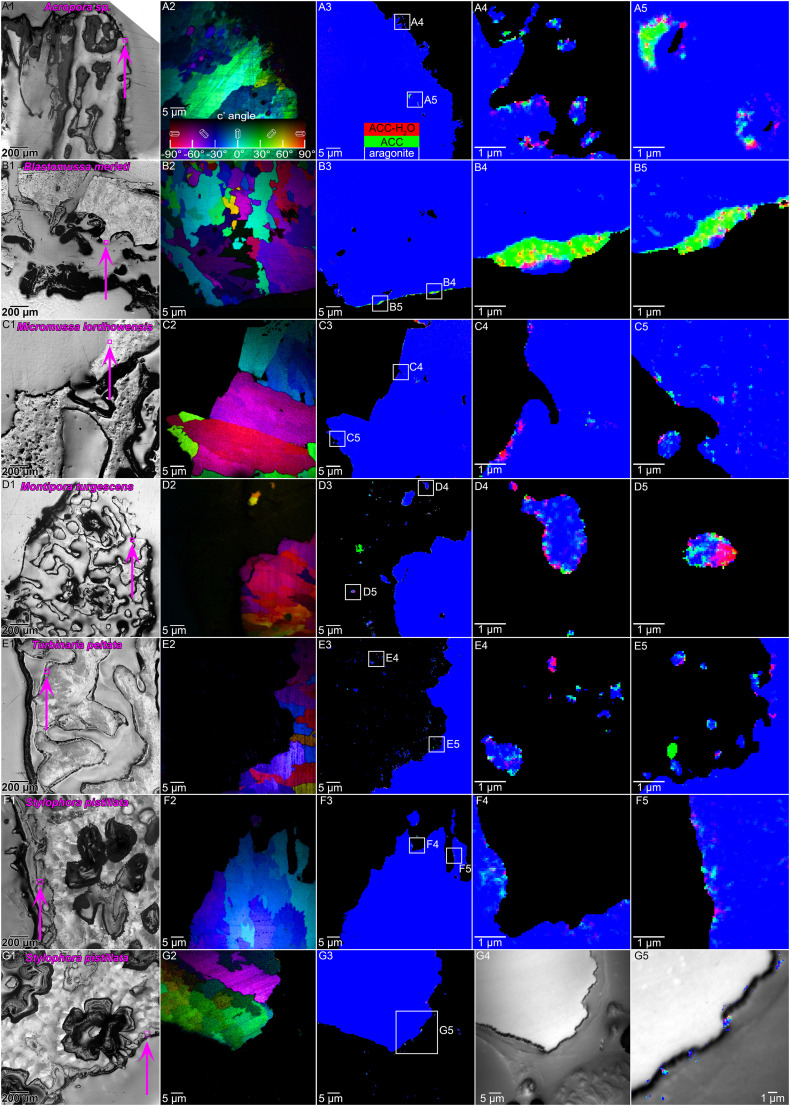
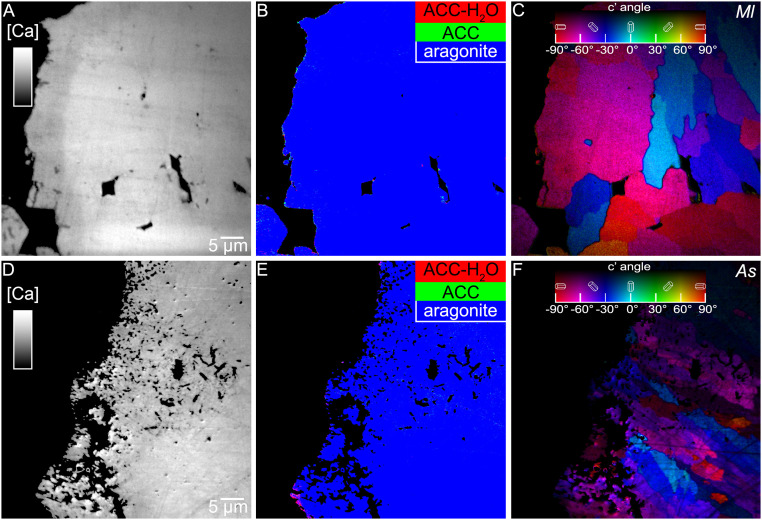
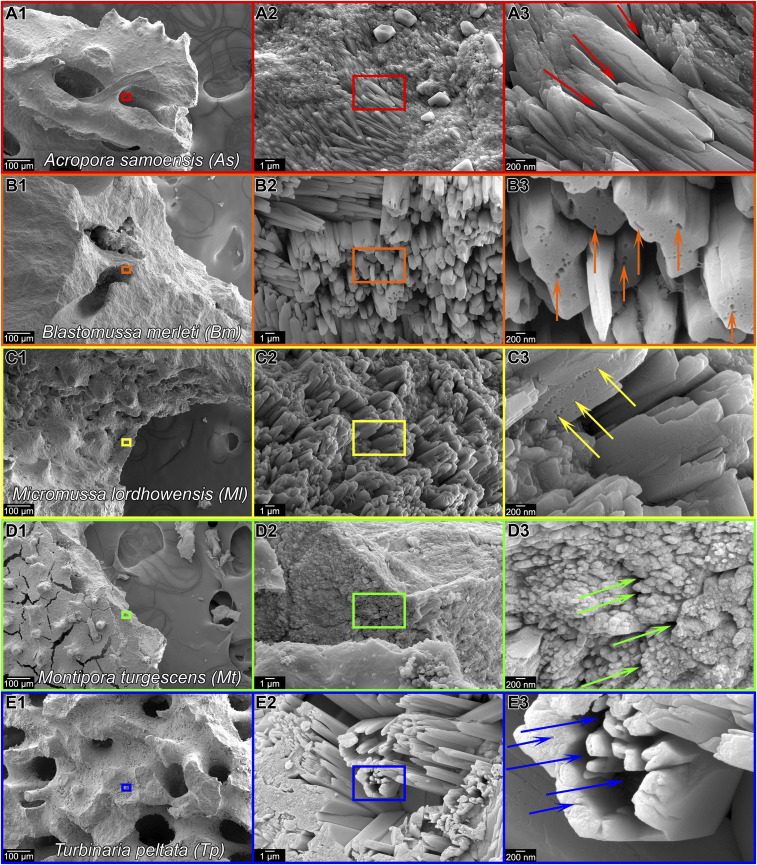
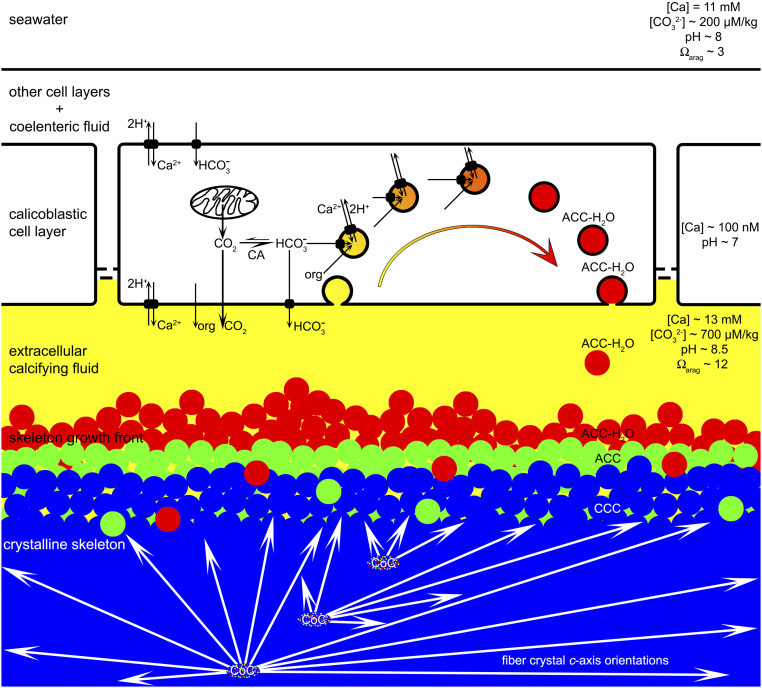
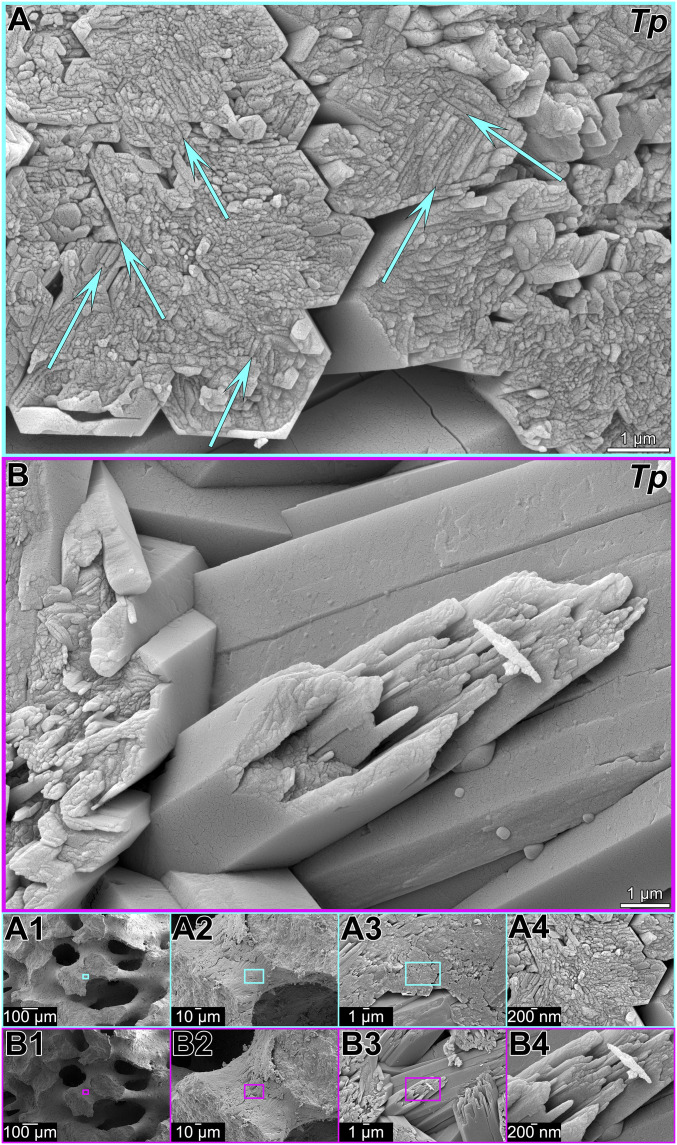
Reef-building corals and their aragonite (CaCO3) skeletons support entire reef ecosystems, yet their formation mechanism is poorly understood. Here we used synchrotron spectromicroscopy to observe the nanoscale mineralogy of fresh, forming skeletons from six species spanning all reef-forming coral morphologies: Branching, encrusting, massive, and table. In all species, hydrated and anhydrous amorphous calcium carbonate nanoparticles were precursors for skeletal growth, as previously observed in a single species. The amorphous precursors here were observed in tissue, between tissue and skeleton, and at growth fronts of the skeleton, within a low-density nano- or microporous layer varying in thickness from 7 to 20 µm. Brunauer-Emmett-Teller measurements, however, indicated that the mature skeletons at the microscale were space-filling, comparable to single crystals of geologic aragonite. Nanoparticles alone can never fill space completely, thus ion-by-ion filling must be invoked to fill interstitial pores. Such ion-by-ion diffusion and attachment may occur from the supersaturated calcifying fluid known to exist in corals, or from a dense liquid precursor, observed in synthetic systems but never in biogenic ones. Concomitant particle attachment and ion-by-ion filling was previously observed in synthetic calcite rhombohedra, but never in aragonite pseudohexagonal prisms, synthetic or biogenic, as observed here. Models for biomineral growth, isotope incorporation, and coral skeletons' resilience to ocean warming and acidification must take into account the dual formation mechanism, including particle attachment and ion-by-ion space filling.

Keywords: PEEM; aragonite; biomineral; coral skeleton formation; spectromicroscopy.


Conflict of interest statement

The authors declare no competing interest.

Figures

Fig. 1.
Fig. 1.
Photographs and SEM images of the five new coral species analyzed here. The photographs in A1E1 show living corals still in the aquarium. For each coral, the genus, species, and their abbreviations are in A1E1. The SEM images were acquired on fractured surfaces to show the nanoparticulate nature of all skeletons. Boxes in A2E2 and A3E3 indicate the position where the images in A3E3 and A4E4 were acquired. All species display 50 to 400 nm nanoparticles (A4E4).
Fig. 2.
Fig. 2.
Tissues, mature, and forming skeleton from T. peltata (Tp). (A and B) PLM images. The boxes in a indicate were the data in C and D were acquired. The micrograph in A is labeled with all relevant and recognizable tissue components. Starting from the outside (seawater side of the polyp), there are four layers of distinct tissues: Oral ectoderm and oral endoderm, which are separated by a layer of mesoglea, aboral endoderm and aboral ectoderm, separated by another layer of mesoglea. The coelenteron is the space separating the oral from the aboral layers. The fourth tissue in direct or close contact with the growing skeleton is the aboral ectoderm, or calicoderm because it is made of calicoblastic cells, which closely envelope the skeleton (magenta arrows). The arrow in B points to the two areas in C and D. (C and D) Component maps, obtained by PEEM at the Ca L-edge, in which the mineral phases in each pixel are represented by color, according to the legend in D. Notice in C and D the nanoparticles outside the skeleton, which are clearly in the tissue region, especially at the top of C (arrows). A layer of red (ACC-H2O) nanoparticles lines the bottom of the skeleton in D (arrows). In A, the band at the growth front of the skeleton is interpreted to be bright and colorful in PLM due to birefringence of nano- or microsize anisotropic particles in the porous aggregate.
Fig. 3.
Fig. 3.
Amorphous precursors in the six coral species in Table 1. (A1G1) PLM image of each polished sample where the area in A2G2 and A3G3 is indicated by a magenta box and arrow. (A2G2) PIC map where color indicates crystal orientation according to the color legend in A2. (A3G3) PEEM component map where color indicates mineral phases in each 60-nm pixel, according to the color legend in A3. (A4F4 and A5F5) Details from white boxes in A3F3, magnifying the few still amorphous pixels. (G) Amorphous precursor particles in tissue. (G4) PEEM image including the skeleton growth front and tissue components as labeled in SI Appendix, Fig. S5. (G5) Overlaid image and map from G3 and G4 of the calicoblastic cell layer enveloping the growth front of the skeleton. Mature skeleton aragonite and epoxy were removed for clarity. Notice all three phases in intracellular Ca-rich particles.
Fig. 4.
Fig. 4.
Comparison of [Ca] maps, component maps, and PIC maps of the same area at the growth surfaces of fresh, forming skeletons of M. lordhowensis (Ml) (A–C) and Acropora sp. (As) (D–F). (A) Notice the 7- to 8-µm-thick low-[Ca] band at the forming surface in a (left edge). As indicated by the grayscale bar, brightness is proportional to [Ca], but is not calibrated. Resin with no Ca is black, crystalline aragonite is bright gray in mature skeleton (right side). (D) [Ca] map showing the 15-µm-wide microporous band at the forming surface (left). In D the [Ca] is identical in the microporous and the space-filled regions (left and right, respectively), indicating that each particle on the left is fully dense, but particles do not fill space, they are interspersed with the embedding resin. (B and E) Component maps showing a few amorphous pixels at the growing surfaces. The low-[Ca] band in a is mostly crystalline aragonite (blue pixels) in the component map in B. Also, in E, most pixels are evenly crystalline aragonite (blue), in both the microporous layer and the bulk mature skeleton. (C and F) PIC map, where the orientation of the aragonite crystal in each 60-nm pixel is measured and quantitatively displayed in color, including hue and brightness, corresponding to in-plane and off-plane angles in polar coordinates.
Fig. 5.
Fig. 5.
SEM images of the native surface of forming coral skeletons. Increasing magnifications reveal micro- and nanoscale porosity of surfaces as indicated by arrows at the high-magnification images in A3E3. In D1 and D2 the dried and cracked tissue is visible (bottom left) but the magnified region is on the skeleton surface (D3).
Fig. 6.
Fig. 6.
Model of coral skeleton formation combining nanoparticles and ion-by-ion growth. The values for calcium and carbonate concentrations ([Ca], [CO32-]), pH, and supersaturation with respect to aragonite (Ωarag) in calcifying fluid and seawater were measured by Sevilgen et al. (26). The CF is endocytosed into a calicoblastic cell from its apical side (bottom) by macropinocytosis (25), enriched in Ca, HCO3, other ions, organics; protons are removed, so ACC-H2O nanoparticles can form (red). These are then exocytosed into the CF and attach to the growing skeleton. Gradually the solid aggregate of nanoparticles and ions dehydrates (green), crystallizes (blue), and ion attachment fills interstitial spaces. Crystalline fibers radiate from CoCs, and form spherulites (21), as each crystal fiber grows at the expense of the amorphous precursor phases. All three phases persist in CoCs.
Fig. 7.
Fig. 7.
SEM images of the native surface of T. peltata (Tp) skeleton showing the dual mechanism of particle attachment and ion-by-ion filling in forming coral skeleton fibers. The outer surface of each fiber in A and B appears as a euhedral pseudohexagonal prism, with a smooth lateral surface that is space-filling; thus, it must have grown by both particle attachment and ion-by-ion filling. Interspersed with euhedral crystals are nonspace-filling nanoparticles. Increasing magnification images in A1A4 and B1B4 show where on the native surface the images in A and B were acquired. Particles may attach preferentially in euhedral pseudohexagonal prism geometry, thus, surfaces parallel to the outer pseudohexagonal edges are recognizable, as indicated by arrows in A. A false-color version of B is presented as SI Appendix, Fig. S3 to indicate space-filling and nonspace-filling crystals, both of which have at least one nanoparticulate side.

References

    1. Hoegh-Guldberg O., et al. , Coral reefs under rapid climate change and ocean acidification. Science 318, 1737–1742 (2007). - PubMed
    1. Pandolfi J. M., Connolly S. R., Marshall D. J., Cohen A. L., Projecting coral reef futures under global warming and ocean acidification. Science 333, 418–422 (2011). - PubMed
    1. Hughes T. P., et al. , Global warming and recurrent mass bleaching of corals. Nature 543, 373–377 (2017). - PubMed
    1. Scheufen T., Krämer W. E., Iglesias-Prieto R., Enríquez S., Seasonal variation modulates coral sensibility to heat-stress and explains annual changes in coral productivity. Sci. Rep. 7, 1–15 (2017). - PMC - PubMed
    1. Carpenter K. E., et al. , One-third of reef-building corals face elevated extinction risk from climate change and local impacts. Science 321, 560–563 (2008). - PubMed

Publication types