. 2020 Nov 13;11(1):5794.
doi: 10.1038/s41467-020-19400-w.

Characterization of the pathoimmunology of necrotizing enterocolitis reveals novel therapeutic opportunities

Affiliations

Characterization of the pathoimmunology of necrotizing enterocolitis reveals novel therapeutic opportunities

Steven X Cho et al. Nat Commun. .

Abstract

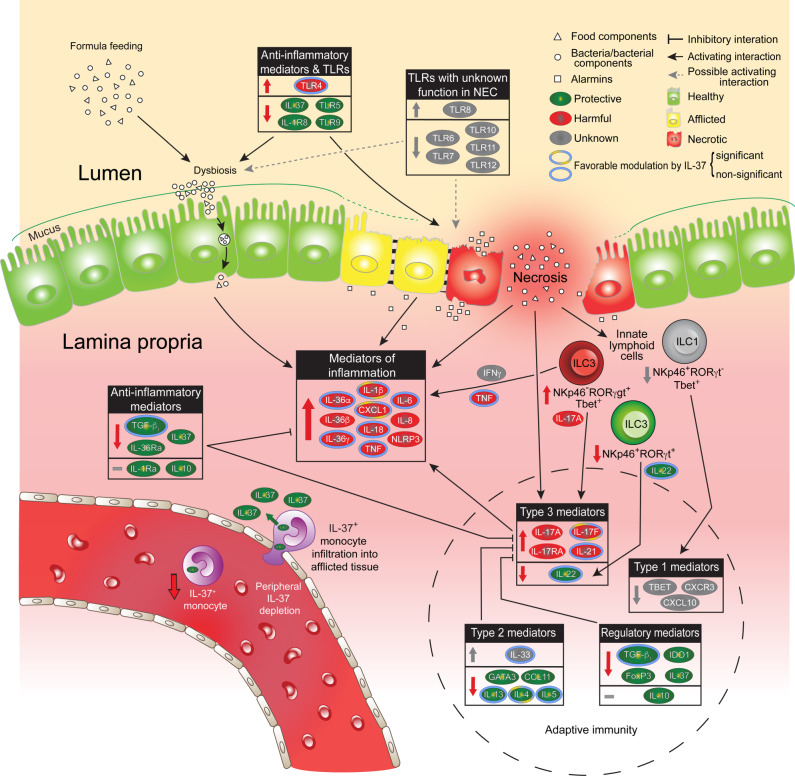
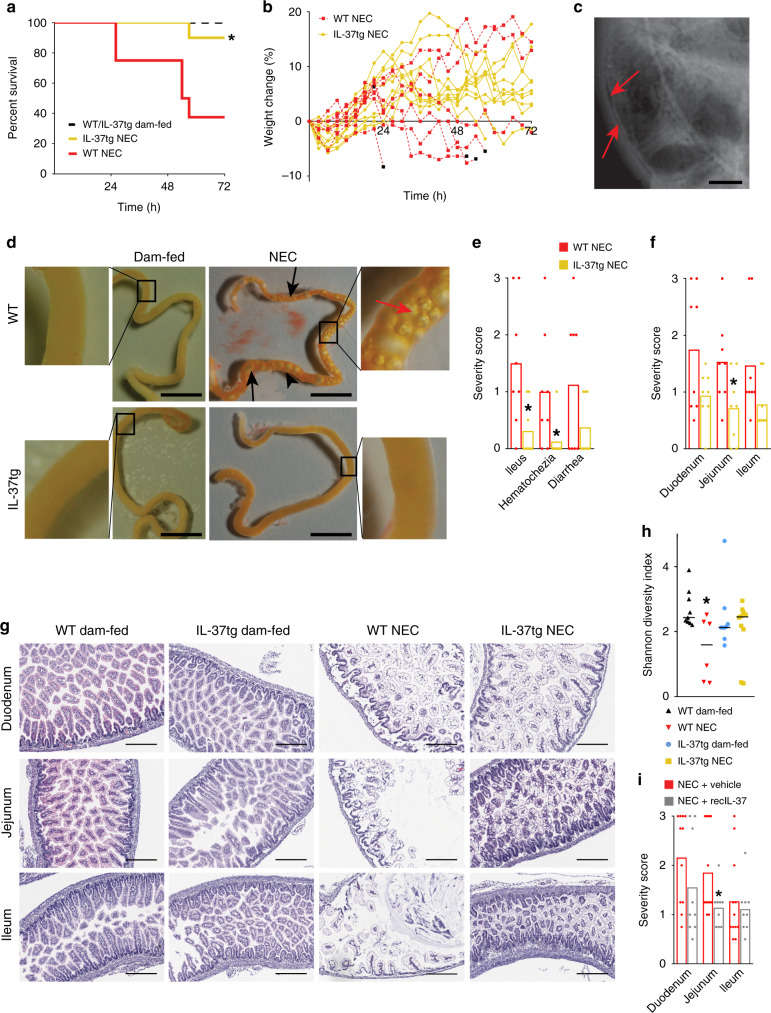
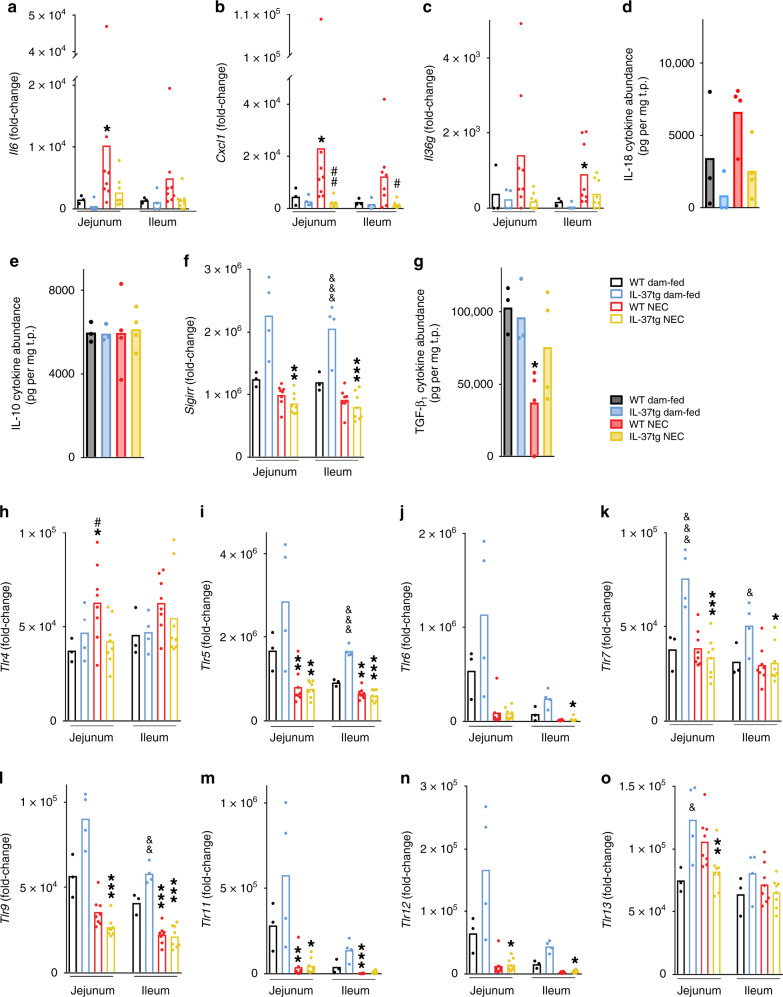
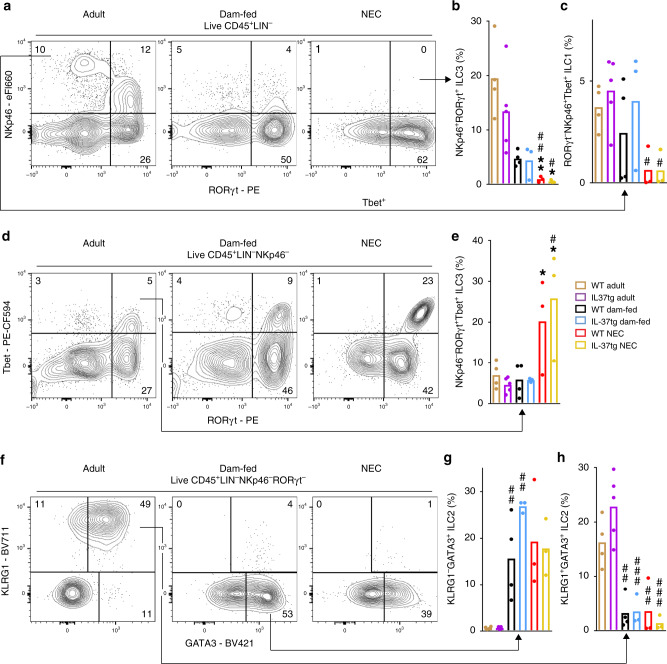
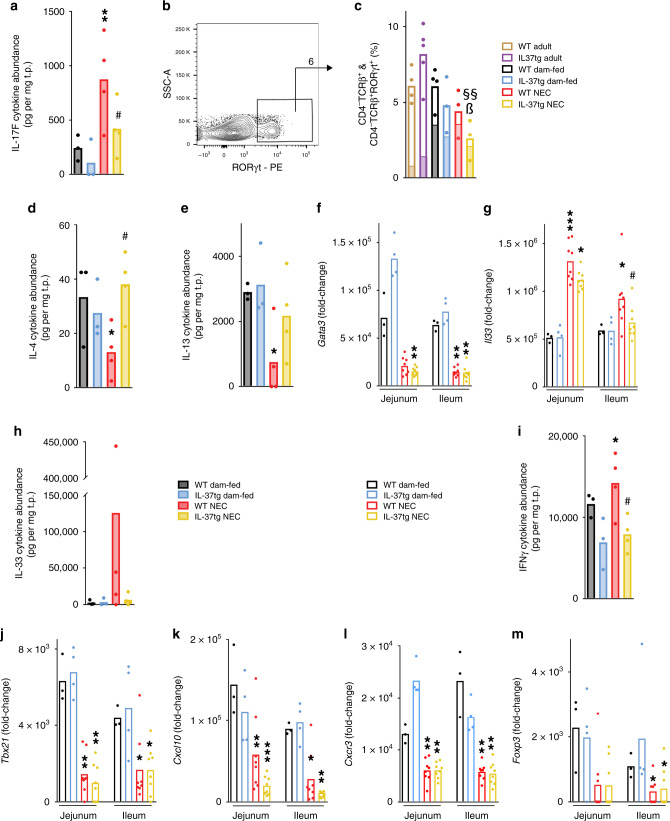
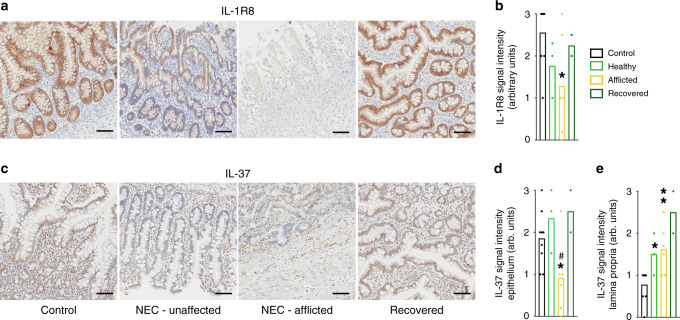
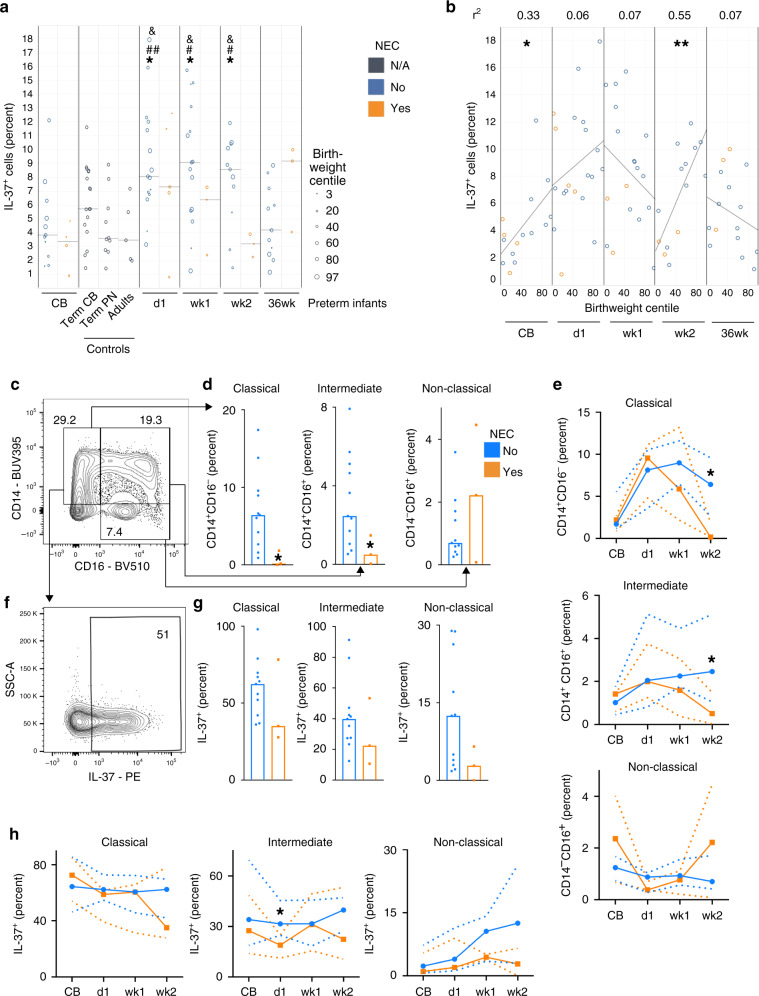
Necrotizing enterocolitis (NEC) is a severe, currently untreatable intestinal disease that predominantly affects preterm infants and is driven by poorly characterized inflammatory pathways. Here, human and murine NEC intestines exhibit an unexpected predominance of type 3/TH17 polarization. In murine NEC, pro-inflammatory type 3 NKp46-RORγt+Tbet+ innate lymphoid cells (ILC3) are 5-fold increased, whereas ILC1 and protective NKp46+RORγt+ ILC3 are obliterated. Both species exhibit dysregulation of intestinal TLR repertoires, with TLR4 and TLR8 increased, but TLR5-7 and TLR9-12 reduced. Transgenic IL-37 effectively protects mice from intestinal injury and mortality, whilst exogenous IL-37 is only modestly efficacious. Mechanistically, IL-37 favorably modulates immune homeostasis, TLR repertoires and microbial diversity. Moreover, IL-37 and its receptor IL-1R8 are reduced in human NEC epithelia, and IL-37 is lower in blood monocytes from infants with NEC and/or lower birthweight. Our results on NEC pathomechanisms thus implicate type 3 cytokines, TLRs and IL-37 as potential targets for novel NEC therapies.


Conflict of interest statement

Monash University, Hudson Institute (A.M.E., J.C.W., C.A.N.-P., and M.F.N.) and F. Hoffmann-La Roche (F.S., A.B., G.T. and L.L.) hold two patent families on IL-37, namely PCT/AU2016/050495 (Monash and Hudson only) and EP19218657.5 (Monash, Hudson, and Roche). No other conflicts of interest exist for these authors. All other authors declare that no conflict of interest exists.

Figures

Fig. 1
Fig. 1. Overview of innate and adaptive immunity in NEC and of the protective effects of IL-37.
Colored arrows within boxes and next to ILC designations and IL-37+ monocyte within blood vessel: Color indicates consequences of NEC-induced changes as protective (green), harmful (red), or unknown (gray); direction denotes increase (upwards), decrease (downwards), and no change (flat line). The green arrow on monocyte crossing endothelial barrier signifies the release of IL-37 into the subepithelial tissue. Colored rings around cytokines indicate prevention of increase or decrease, or restoration to baseline by IL-37 (i.e., favorable modulation by IL-37); no border, not affected by IL-37 or not assessed in this regard. The dashed circular line encloses changes and effects pertaining to adaptive immunity. Interactions depicted by black and gray connectors make no claim to be comprehensive; interactions relevant to the data reported in this paper are prioritized. Categorization into protective, harmful, and unknown is based on current knowledge of prototypical function; see ref. and references in the text.
Fig. 2
Fig. 2. IL-37tg mice are protected from NEC.
ah Newborn IL-37tg and WT mouse pups were randomized into dam-fed or NEC groups. Dam-fed pups remained with the dam; NEC pups received 3-hourly formula feeds and cold stress and asphyxia twice daily. Data are from three independent experiments with n = 8 mice for WT NEC and 10 for IL-37tg NEC. a Percent survival and b percent weight change of IL-37tg vs WT mice subjected to NEC; log-rank test P-value: *P < 0.05. Black squares denote death endpoints. The starting weights of WT and IL-37tg pups were similar. c X-ray of a human infant with NEC. Red arrows indicate pneumatosis intestinalis; also note dilated bowel loops indicative of ileus. d Representative photographs of small intestines from mice of each experimental group immediately following excision at the time of death or experimental endpoint. Black arrows denote luminal air bubbles, red arrows pneumatosis intestinalis (gas trapped in the intestinal wall), scale bars are 1 cm, side panels are ×5 magnifications. eg n = 8 pups for both WT NEC and IL-37tg NEC. Student’s t-test or Mann–Whitney U test P-values: *P < 0.05 for IL-37tg vs WT. e, f, i, h Graphs show measurements in individual pups as dots, bars indicate means (e, f, i) or medians (h). e Clinical scoring of NEC-associated parameters (0–3 scale, no to severe pathology, see “Methods” section). f Histological scoring of intestinal regions in NEC mice (0–3 scale; see “Methods” section, Supplementary Fig. 1 and panel g). g Representative photomicrographs of intestinal sections from each of the four groups, e.g., showing a healthy mucosa in WT dam-fed mice (score 0), mild vacuolation in an otherwise relatively healthy mucosa in IL-37 NEC jejunum (score 1), an advanced disease in WT NEC duodenum (score 2) and severe NEC with tissue disintegration in WT NEC ileum (score 3). Magnification ×100; scale bars indicate a 300 µm. h Shannon diversity index representing the intra-group microbiome diversity (alpha-diversity) within each of the four experimental groups. n = 9 pups for WT and IL-37tg dam-fed, 6 for WT NEC and 10 for IL-37tg NEC; non-parametric t-test (Monte Carlo permutation) P-value: *P < 0.05 for WT dam-fed vs WT NEC. i Newborn WT pups were randomized to either receive 12-hourly subcutaneous injections of recIL-37 (40 µg/kg) or vehicle, then subjected to the same model as in ah. Intestinal sections were obtained at the experimental endpoint and scored as above. Data are from three independent experiments; n = 12 for NEC + vehicle, 9 for NEC + recIL-37; Mann–Whitney U test P-value: *P < 0.05 for recIL-37 vs vehicle.
Fig. 3
Fig. 3. Pro- and anti-inflammatory mediators and TLRs in murine NEC and their modulation by IL-37.
Intestinal tissue lysates from NEC or dam-fed pups collected at experimental endpoint or time of death were measured for gene expression (ac, f, ho, open bars) and protein abundance (d, e, g, filled bars) by multiplex real-time PCR and multiplex ELISA, respectively. Functionally, ad are pro-inflammatory, eg anti-inflammatory mediators, and ho are TLRs. Data are from three independent experiments. Dots indicate data from individual mice and bars depict means. One-way ANOVA or ANOVA on ranks P-values: *P < 0.05; **P < 0.01; ***P < 0.001 for IL-37tg or WT NEC compared to dam-fed controls (see “Methods” section). #P < 0.05; ##P < 0.01 for IL-37tg NEC compared to WT NEC. &P < 0.05; &&P < 0.01; &&&P < 0.001 for IL-37tg dam-fed compared to WT dam-fed. ac, f, ho Real-time PCR results for the indicated genes were normalized to Hprt1 and depicted as fold-change relative to the lowest expressed gene (see “Methods” section). n = 3 for WT dam-fed, 4 for IL-37tg dam-fed, 8 for both WT and IL-37tg NEC. d, e, g Ileal cytokine abundance of the indicated protein is normalized to total protein (see “Methods” section). n = 3 for both WT and IL-37tg dam-fed, 4 for both WT and IL-37tg NEC.
Fig. 4
Fig. 4. Developmental and NEC-associated changes in intestinal ILC subtypes.
Lamina propria cells were isolated from the small intestine of 3 day-old pups (n = 4 for WT dam-fed and 3 each for IL-37tg dam-fed, WT and IL-37tg NEC from 3 independent experiments) and adult mice (n = 4 for WT and 5 for IL-37tg from 2 independent experiments) before being subjected to flow cytometric analysis. Cells were stained for NKp46, RORγt, and Tbet to identify ILC1 (a, c) and ILC3 (a, b, d, e) and for KLRG1 and GATA3 to assess ILC2 (fh). a, d, f Plots show one representative result per group; arrows indicate the source quadrants of the percentage graphs, which are calculated as a percentage under total live CD45+ cells. b, c, e, g, h Percentage of NKp46+RORγt+ ILC3 (b), RORγtNKp46+Tbet+ ILC1 (c), NKp46RORγt+Tbet+ ILC3 (e), KLRG1+GATA3+ ILC2 (g), and KLRG1GATA3+ ILC2 (h) is shown as data from individual mice (dots) and means (bars). One-way ANOVA or ANOVA on ranks P-values (for details, see “Methods” section): *P < 0.05; **P < 0.01 for IL-37tg or WT NEC compared to dam-fed controls. #P < 0.05; ##P < 0.01; ###P < 0.001 for IL-37tg or WT NEC or dam-fed compared to adult mice. &P < 0.05 for adult IL-37tg compared to adult WT.
Fig. 5
Fig. 5. Markers of adaptive immunity in NEC.
Intestinal tissue lysates were assayed for gene expression (open bars) by multiplex real-time PCR and protein abundance (filled bars) by multiplex ELISA or flow cytometry assessing mediators of adaptive immune type 3 (ac), type 2 (dh), type 1 (il) and regulatory (m) polarization. a, dm One-way ANOVA or ANOVA on ranks P-values: *P < 0.05; **P < 0.01, and ***P < 0.001 for IL-37tg or WT NEC compared to dam-fed mice. #P < 0.05 for IL-37tg NEC compared to WT NEC. &&&P < 0.001 for IL-37tg dam-fed compared to WT dam-fed. a, d, e, h, i Ileal protein abundance of the indicated mediators is depicted as individual values (dots) and means (bars) normalized to total protein (t.p.). n = 3 pups for both WT and IL-37tg dam-fed, 4 for both WT and IL-37tg NEC. b, c Flow cytometric analysis for T cells on the same cells as in Fig. 4 was performed. As in Fig. 4, data are from n = 2–3 independent experiments; n = 4 mice for WT adult, 5 for IL-37tg adult, 4 for WT dam-fed, and 3 each for IL-37tg dam-fed, WT, and IL-37tg NEC. b Representative gating plot for CD4TCRβ+RORγt+ cells, which originate from the live CD45+ lymphocyte gate; arrow indicates the source of the solid color fill in the graph. c Measurements from individual mice (dots) and means (open bars) of CD4TCRβ+ cell percentages under live CD45+ lymphocytes are shown. One-way ANOVA P-values: §§P < 0.01 for IL-37tg NEC compared to IL-37tg adult mice. ßP < 0.05 for IL-37tg NEC compared to dam-fed (see “Methods” section). Solid color fill represents the mean percentage within each bar that is RORγt+, i.e., the RORγt+ fraction among CD4TCRβ+ cells. Statistics for solid bars by one-way ANOVA (not shown in the figure): P < 0.001 for each of the groups of pups compared to adults. f, g, jm Real-time PCR results were normalized to Hprt1 and the indicated genes are graphed as fold-change relative to the lowest expressed gene (see “Methods” section). Dots indicate data from individual mice, bars indicate means. n = 3 mice for WT dam-fed, 4 for IL-37tg dam-fed, 8 for both WT and IL-37tg NEC.
Fig. 6
Fig. 6. Innate and adaptive immunity in human NEC.
Intestinal tissue sections were collected from infants with acute surgical NEC (n = 6 healthy/afflicted, n = 4 necrotic), from the same infants upon recovery from NEC (at reanastomosis of the stoma, n = 2), and from infants who underwent intestinal surgery for non-inflammatory diseases other than NEC (n = 5). For further clinical information, see Supplementary Table 1. The resection specimens were assessed for gene expression by multiplex real-time PCR. a Upper panel, acute NEC specimens were macroscopically divided into healthy (green arrow), afflicted (orange arrow) and necrotic (red arrow) sections; one exemplary resection specimen is shown. Lower panel, exemplary specimen at time of reanastomosis. Categories of mediators shown are: innate immunity (bi); type 1 (jm); type 2 (n); and type 3 (o, p) adaptive immunity. bp Real-time PCR results were normalized to ACTB and graphed as fold-change relative to the lowest expressed gene. Measurements of individual infants are depicted as dots, bars are medians. One-way ANOVA on ranks P-values: *P < 0.05; **P < 0.01, and ***P < 0.001 for healthy, afflicted or necrotic acute NEC compared to non-NEC controls. #P < 0.05 and ##P < 0.01 for healthy NEC vs afflicted or necrotic NEC (see “Methods” section).
Fig. 7
Fig. 7. Intestinal IL-37 and IL-1R8 in human NEC infants.
Immunohistochemical assessment of IL-1R8 (a, b) and IL-37 (ce) in samples from the same infants, namely non-NEC controls (control, n = 9), largely healthy NEC tissue (unaffected, n = 3), NEC-afflicted tissue (afflicted, n = 6) and samples from intestines after NEC recovery (recovered, n = 2). “Afflicted” also comprises the necrotic group in the immunohistochemistry experiments. a, c One representative image for each group is shown. Scale bars: 50 µm. b, d, e Quantification of the signal intensity of IL-1R8 (b) or IL-37 in the epithelium (d) or the lamina propria (e). Bars plotted indicate means of individual signal intensity values, which are shown as dots. One-way ANOVA P-values: *P < 0.05 and **P < 0.01 for healthy or afflicted acute NEC compared to non-NEC controls. #P < 0.05 for healthy vs afflicted sections in acute NEC.
Fig. 8
Fig. 8. IL-37 abundance in blood cells from human NEC infants.
Peripheral blood was obtained from the second cohort of premature infants (gestational age 24–29 weeks, n = 21; note that some time points are not available for some preterm infants; for exact n at each time point see dots in panels and Source Data file) at the indicated time points, from healthy term infants at birth (n = 17) and at 4–16 weeks of age (n = 10), as well as from healthy adult volunteers (n = 5). The percentage of IL-37+ leukocytes among viable CD45+ cells was determined by flow cytometry. CB cord blood, Term healthy term infants, PN postnatal, d1 day 1, wk1/2 week 1/2, 36wk 36 weeks of corrected gestational age. a, b IL-37+ percentages are graphed for each individual infant (circles) with medians indicated by gray lines. Student’s t-test P-values: *P < 0.05 for indicated preterm time point vs preterm CB. #P < 0.05 and ##P < 0.01 for indicated preterm time point vs term PN. &P < 0.05 for indicated preterm time point vs adults. b Correlation of birthweight centile with IL-37+ percentage at the indicated time points. Pearson correlation P-values: *P < 0.05; **P < 0.01. ch Analysis of monocyte subtypes and their IL-37+ percentages at the week 2 time point (c, d, f, g) or longitudinally (e, h). Mann–Whitney U test P-values: *P < 0.05 for NEC vs non-NEC. ce Quantification of monocyte subtypes under viable CD45+ cells, and fh of IL-37+ percentages under the indicated viable CD45+ monocyte subtypes; c, f Exemplary plots of gating strategies, with percentages indicated by numbers within or next to boxed fields. d, g Quantification of individual infants shown by dots, bars denote medians. e, h Median values across the indicated time points are shown by solid lines, dotted lines are interquartile ranges (IQRs).

References

    1. Stoll BJ, et al. Neonatal outcomes of extremely preterm infants from the NICHD Neonatal Research Network. Pediatrics. 2010;126:443–456. doi: 10.1542/peds.2009-2959. - DOI - PMC - PubMed
    1. Patel RM, et al. Causes and timing of death in extremely premature infants from 2000 through 2011. N. Engl. J. Med. 2015;372:331–340. doi: 10.1056/NEJMoa1403489. - DOI - PMC - PubMed
    1. Fitzgibbons SC, et al. Mortality of necrotizing enterocolitis expressed by birth weight categories. J. Pediatr. Surg. 2009;44:1072–1075. doi: 10.1016/j.jpedsurg.2009.02.013. - DOI - PubMed
    1. Blakely ML, et al. Postoperative outcomes of extremely low birth-weight infants with necrotizing enterocolitis or isolated intestinal perforation: a prospective cohort study by the NICHD Neonatal Research Network. Ann. Surg. 2005;241:984–989. doi: 10.1097/01.sla.0000164181.67862.7f. - DOI - PMC - PubMed
    1. Hall NJ, Eaton S, Pierro A. Royal Australasia of Surgeons Guest Lecture. Necrotizing enterocolitis: prevention, treatment, and outcome. J. Pediatr. Surg. 2013;48:2359–2367. doi: 10.1016/j.jpedsurg.2013.08.006. - DOI - PubMed

Publication types

MeSH terms

LinkOut - more resources