

Molecular estimation of neurodegeneration pseudotime in older brains
- PMID: 33188183
- PMCID: PMC7666177
- DOI: 10.1038/s41467-020-19622-y
Molecular estimation of neurodegeneration pseudotime in older brains
Erratum in
-
Author Correction: Molecular estimation of neurodegeneration pseudotime in older brains.Nat Commun. 2020 Dec 3;11(1):6307. doi: 10.1038/s41467-020-20261-6. Nat Commun. 2020. PMID: 33273466 Free PMC article.
Abstract
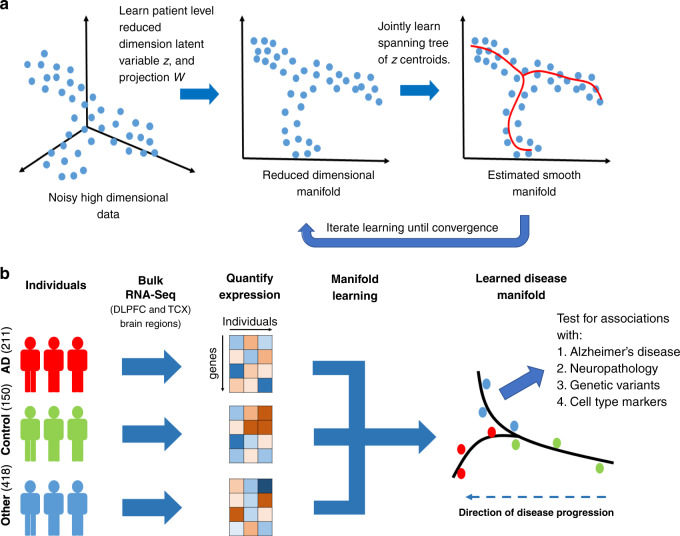
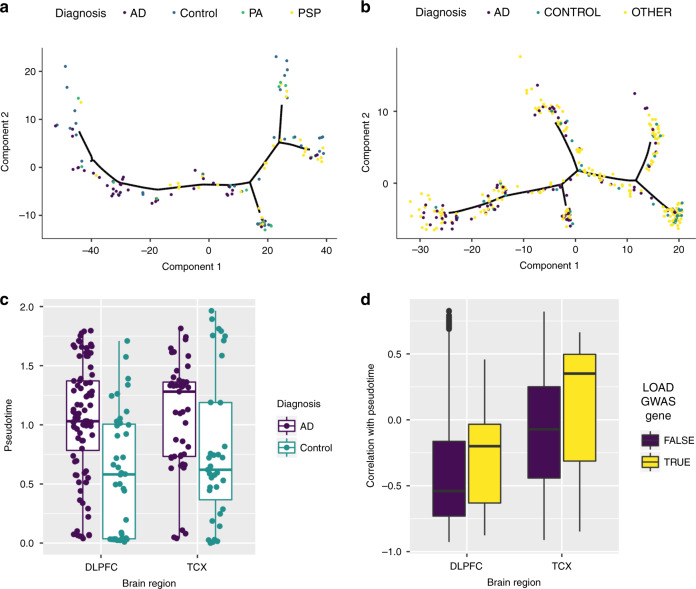
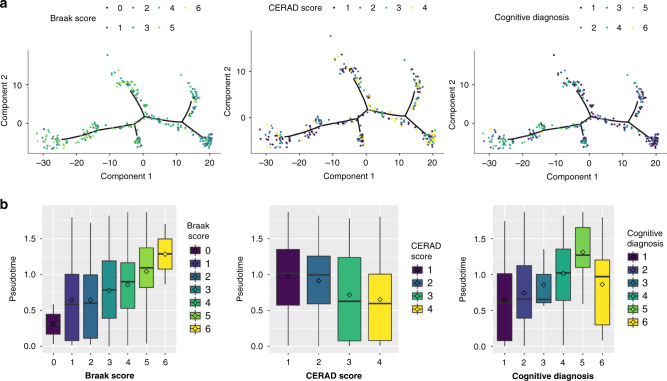
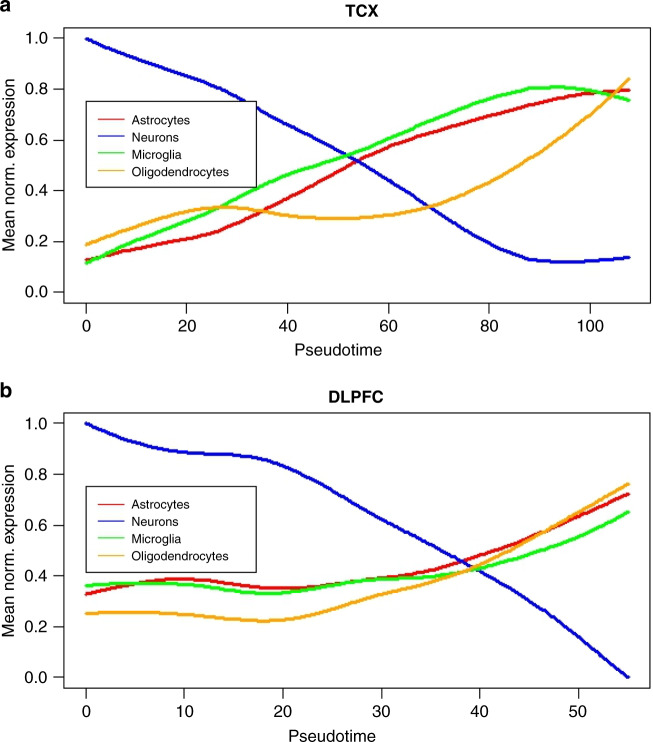
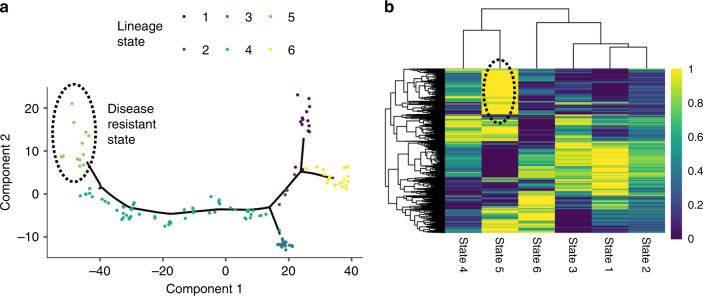
The temporal molecular changes that lead to disease onset and progression in Alzheimer's disease (AD) are still unknown. Here we develop a temporal model for these unobserved molecular changes with a manifold learning method applied to RNA-Seq data collected from human postmortem brain samples collected within the ROS/MAP and Mayo Clinic RNA-Seq studies. We define an ordering across samples based on their similarity in gene expression and use this ordering to estimate the molecular disease stage-or disease pseudotime-for each sample. Disease pseudotime is strongly concordant with the burden of tau (Braak score, P = 1.0 × 10⁻⁵), Aβ (CERAD score, P = 1.8 × 10⁻⁵), and cognitive diagnosis (P = 3.5 × 10⁻⁷) of late-onset (LO) AD. Early stage disease pseudotime samples are enriched for controls and show changes in basic cellular functions. Late stage disease pseudotime samples are enriched for late stage AD cases and show changes in neuroinflammation and amyloid pathologic processes. We also identify a set of late stage pseudotime samples that are controls and show changes in genes enriched for protein trafficking, splicing, regulation of apoptosis, and prevention of amyloid cleavage pathways. In summary, we present a method for ordering patients along a trajectory of LOAD disease progression from brain transcriptomic data.
Conflict of interest statement
The authors declare no competing interests.
Figures
References
Publication types
MeSH terms
Grants and funding
- U01 AG046152/AG/NIA NIH HHS/United States
- P50 AG016574/AG/NIA NIH HHS/United States
- U01 AG032984/AG/NIA NIH HHS/United States
- R01 AG017917/AG/NIA NIH HHS/United States
- RF1 AG051504/AG/NIA NIH HHS/United States
- P30 AG010161/AG/NIA NIH HHS/United States
- U01 AG046139/AG/NIA NIH HHS/United States
- P01 AG017216/AG/NIA NIH HHS/United States
- R01 AG018023/AG/NIA NIH HHS/United States
- U54 AG054345/AG/NIA NIH HHS/United States
- R01 AG023571/AG/NIA NIH HHS/United States
- R01 AG030146/AG/NIA NIH HHS/United States
- U24 AG061340/AG/NIA NIH HHS/United States
- R01 AG061796/AG/NIA NIH HHS/United States
- R01 AG032990/AG/NIA NIH HHS/United States
- RF1 AG063540/AG/NIA NIH HHS/United States
- R01 NS080820/NS/NINDS NIH HHS/United States
- RF1 AG057443/AG/NIA NIH HHS/United States
- P01 AG003949/AG/NIA NIH HHS/United States
- U24 NS072026/NS/NINDS NIH HHS/United States
- P30 AG019610/AG/NIA NIH HHS/United States
- P50 AG025711/AG/NIA NIH HHS/United States
- U01 AG006786/AG/NIA NIH HHS/United States
- R01 AG036836/AG/NIA NIH HHS/United States
- R01 AG015819/AG/NIA NIH HHS/United States
LinkOut - more resources
Full Text Sources
