. 2020 Nov 13;11(1):5755.
doi: 10.1038/s41467-020-19602-2.

A translational program that suppresses metabolism to shield the genome

Affiliations

A translational program that suppresses metabolism to shield the genome

Nathan C Balukoff et al. Nat Commun. .

Abstract

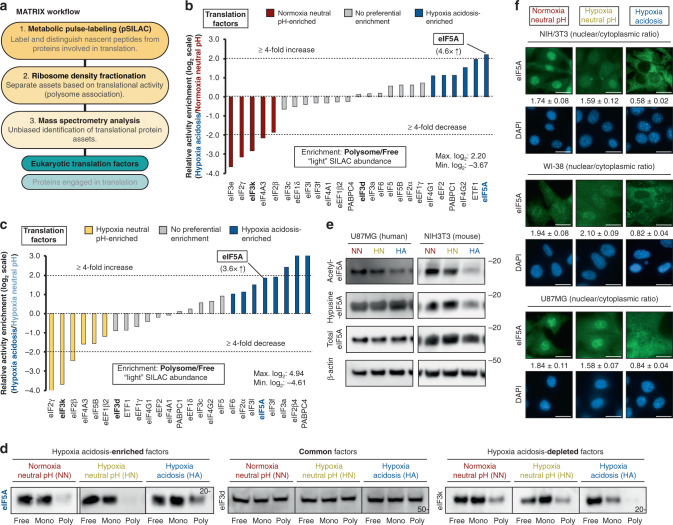
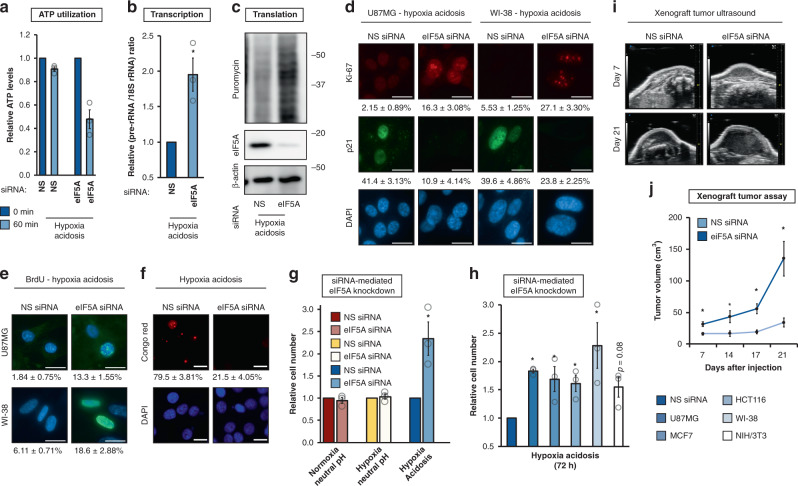
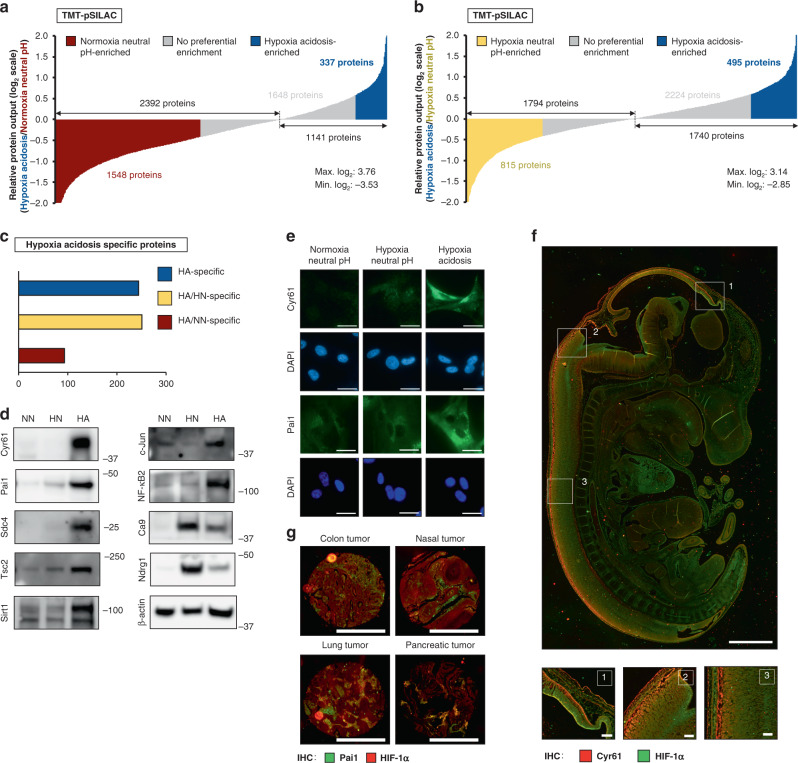
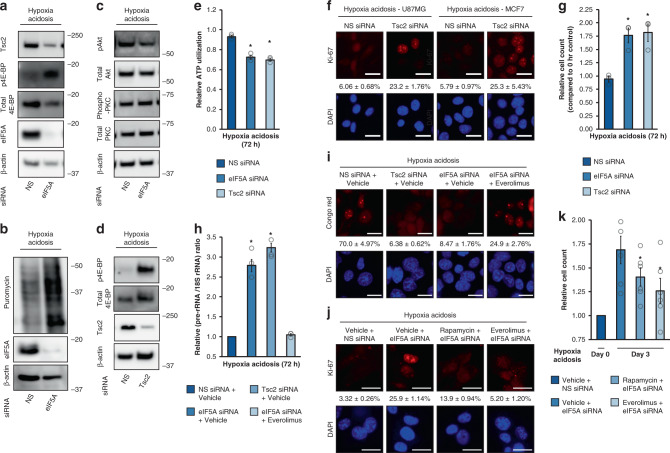
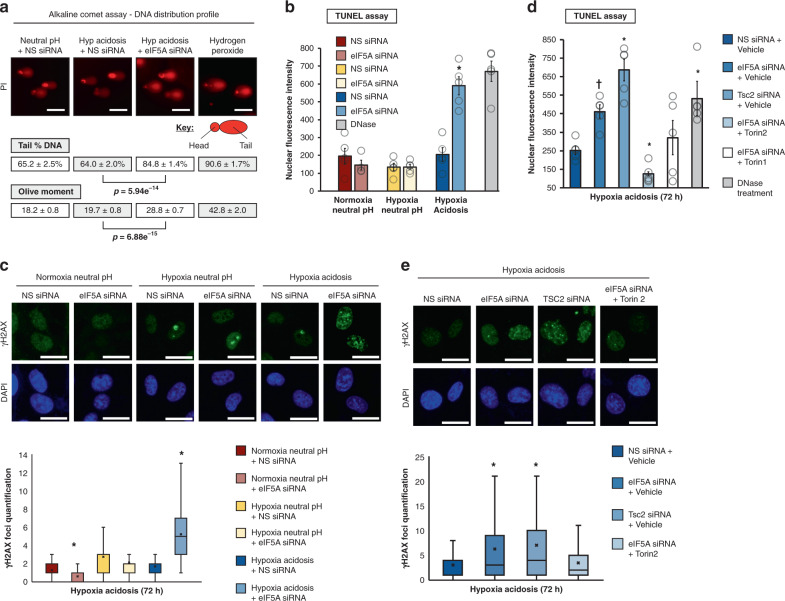
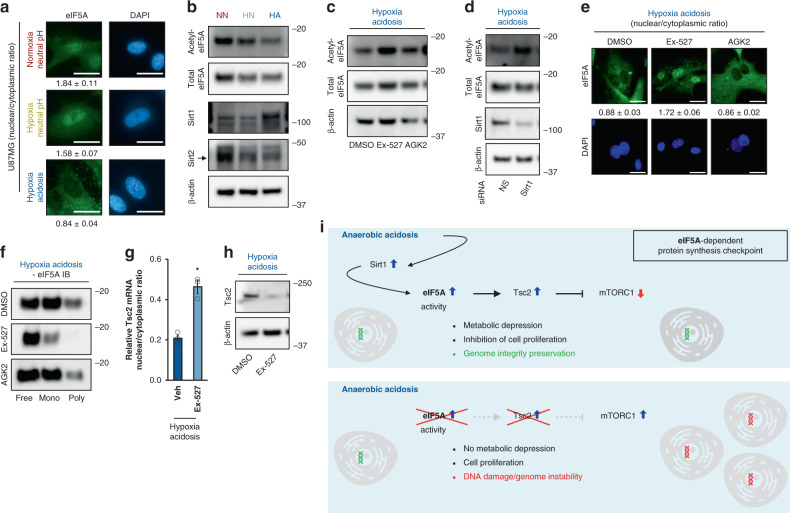
Translatome reprogramming is a primary determinant of protein levels during stimuli adaptation. This raises the question: what are the translatome remodelers that reprogram protein output to activate biochemical adaptations. Here, we identify a translational pathway that represses metabolism to safeguard genome integrity. A system-wide MATRIX survey identified the ancient eIF5A as a pH-regulated translation factor that responds to fermentation-induced acidosis. TMT-pulse-SILAC analysis identified several pH-dependent proteins, including the mTORC1 suppressor Tsc2 and the longevity regulator Sirt1. Sirt1 operates as a pH-sensor that deacetylates nuclear eIF5A during anaerobiosis, enabling the cytoplasmic export of eIF5A/Tsc2 mRNA complexes for translational engagement. Tsc2 induction inhibits mTORC1 to suppress cellular metabolism and prevent acidosis-induced DNA damage. Depletion of eIF5A or Tsc2 leads to metabolic re-initiation and proliferation, but at the expense of incurring substantial DNA damage. We suggest that eIF5A operates as a translatome remodeler that suppresses metabolism to shield the genome.


Conflict of interest statement

The authors declare no competing interests.

Figures

Fig. 1
Fig. 1. MATRIX analysis reveals eIF5A-adaptive engagement during anaerobic acidosis.
a Workflow schematic of MATRIX, an unbiased, high-throughput platform that measures the activity of translational assets. MATRIX analysis of differential translation-factor utilization in human cells (U87MG) exposed to hypoxia acidosis (1% O2, pH 6.0, 24 h) compared to b basal (21% O2, pH 7.4, 24 h) and c hypoxia-neutral pH (1% O2, pH 7.4, 24 h) conditions, using the ratio of heavy polysome to free abundance as the readout. Hypoxia acidosis-activated translation factors (dark-blue bars), basal-activated translation factors (red bars), and hypoxia-neutral pH-activated translation factors (light-blue bars). d Representative immunoblots of U87MG ribosome-density fractions from indicated conditions. Mono: monosome fraction. Poly: polysome fractions. f Representative immunoblots of U87MG were subjected to indicated treatments. e Representative images of eIF5A immunocytochemistry in human (WI-38, U87MG) and mouse (NIH/3T3) cell lines subjected to indicated treatments. Data represent mean ± SEM (n = 3). Scale bars: 20 μm.
Fig. 2
Fig. 2. eIF5A enables metabolic depression during anaerobic acidosis.
a Relative ATP utilization, b transcriptional intensity, and c translational intensity in U87MG replete or depleted of eIF5A under hypoxia acidosis conditions. a, b NS nonsilencing. Data represent mean ± SEM (n = 3). An asterisk indicates p = 0.024, 0.028 (a, b) compared to NS siRNA, two-sided student’s t test. d Ki-67 and p21 immunocytochemistry, e DNA replication (BrdU staining), and f Congo red staining for A bodies in U87MG replete or depleted of eIF5A under hypoxia acidosis conditions (72 h) (n = 5). Quantitation in (d) and (e) represents mean ± SEM (n = 7, 5). Scale bars: 20 μm. g Effect of eIF5A knockdown on steady-state cell numbers in U87MG subjected to indicated treatments. NS nonsilencing. Data represent mean ± SEM (n = 3). An asterisk indicates p = 0.035 compared to NS siRNA, two-sided student’s t test. h Effect of eIF5A knockdown on steady-state cell numbers in human and mouse cell lines under hypoxia acidosis conditions. NS nonsilencing. Data represent mean ± SEM (n = 3). An asterisk indicates p = 0.001, 0.001, 0.047, and 0.025 (U87MG, MCF7, HCT116, and WI-38) compared to the corresponding NS siRNA, two-sided student’s t test. i Representative ultrasound images and j tumor volume measurements of mouse xenograft tumor-formation assays using MCF7 replete or depleted of eIF5A and pretreated with hypoxia acidosis for 72 h. Data represent mean ± SEM (n = 6). An asterisk indicates p = 0.021, 0.031, 0.004, and 0.014 (days 7, 14, 17, and 21) compared to NS siRNA, two-sided student’s t test.
Fig. 3
Fig. 3. TMT-pSILAC identifies the translatome of anaerobic acidosis-dependent metabolic depression.
Proteomic output analysis by TMT-pSILAC followed by mass spectrometry cells subjected to hypoxia acidosis (HA) versus a basal normoxia-neutral pH (NN) and b hypoxia-neutral pH (HN) conditions. HA enrichment: ≥1.5× increase; NN/HN enrichment: ≤0.75× decrease. c Graph depicting HA-enriched proteins (≥1.5× increase), blue = proteins that are upregulated in HA compared to both conditions, yellow proteins that are upregulated in HA compared to HN but not NN, red = proteins that are upregulated in HA compared to NN but not HA. Representative d immunoblots and e immunocytochemistry images of hypoxia-acidosis (HA)-specific translatome targets in U87MG. NN normoxia-neutral pH, HN hypoxia-neutral pH, n = 5. Scale bars: 20 μm. f Representative images of Cyr61 (HA-specific marker, red) and HIF-1α (classic hypoxia marker, green) immunohistochemistry in embryonic day 12 (ED12) CD1 mouse embryo. Scale bars: 1000 μm. Enlarged images of indicated sections (top) are presented on bottom panels (n = 3). Scale bars: 100 μm. g Representative images of Pai1 (HA-specific marker, green) and HIF-1α (hypoxia marker, red) immunohistochemistry in human hypoxic tumor core sections (n = 3). Scale bars: 1000 μm.
Fig. 4
Fig. 4. eIF5A suppresses global metabolism and proliferation through Tsc2/mTORC1.
ac Representative immunoblots of U87MG replete or depleted of eIF5A under hypoxia-acidosis conditions (n = 3). d Representative immunoblots of U87MG replete or depleted of Tsc2 under hypoxia-acidosis conditions (n = 3). e Effects of eIF5A and Tsc2 knockdown on cellular ATP levels under hypoxia-acidosis conditions. NS nonsilencing. Data represent mean ± SEM (n = 3). An asterisk indicates p = 0.024 and 0.012 (eIF5A siRNA and Tsc2 siRNA) compared to NS siRNA, two-sided student’s t test. f Representative images of Ki-67 immunocytochemistry in U87MG (left panel) and MCF7 (right panel) replete or depleted of Tsc2 under hypoxia-acidosis conditions. NS nonsilencing. Data represent mean ± SEM (n = 5). Scale bars: 20 μm. Effect of Tsc2 knockdown on U87MG g cell number, h transcriptional intensity, and i Congo red staining for A bodies. Scale bars: 20 μm. NS nonsilencing. Data represent mean ± SEM (n = 3 (g, h); n = 5 (i)). An asterisk indicates p = 0.046 and 0.042, p = 0.007 and 0.002 (g, h eIF5A siRNA and Tsc2 siRNA) compared to NS siRNA, two-sided student’s t test. j Representative images of Ki-67 immunocytochemistry in U87MG replete or depleted of eIF5A and treated with mTORC1 inhibitors rapamycin and everolimus under hypoxia-acidosis conditions. NS nonsilencing. Data represent mean ± SEM (n = 5). Scale bars: 20 μm. k Effect of mTORC1 inhibition on eIF5A-replete or -depleted U87MG cell number under hypoxia-acidosis conditions. NS nonsilencing. Data represent mean ± SEM (n = 6). An asterisk indicates p = 0.026 and 0.022 (Rapamycin + eIF5A siRNA, Everolimus + eIF5A siRNA) compared to Vehicle + eIF5A siRNA, two-sided student’s t test.
Fig. 5
Fig. 5. The eIF5A/Tsc2 axis averts DNA damage.
Assessment of the effect of eIF5A silencing on DNA damage by a alkaline comet analysis (n = 3) and b TUNEL measurements in U87MG subjected to indicated conditions. Data represent mean ± SEM (n = 5). Asterisk indicates p = 0.001 compared to NS siRNA, two-sided student’s t test. c (Top) Representative images of yH2AX foci in U87MG subjected to indicated conditions. Scale bars: 20 μm. (Bottom) analysis of yH2AX foci (n = 5), asterisk indicates p = 0.00001 and 0.00001 (NN eiF5A siRNA, HA eIF5A siRNA) compared to NS siRNA, two-sided Mann–Whitney U test. The top of the box denotes Q3, the bottom of the box represents Q1; middle line denotes median; X represents mean; bottom whisker denotes minimum: 1st quartile—(1.5*IQR); top whisker denotes maximum: 3rd quartile + (1.5*IQR). d TUNEL analyses of the effects of Tsc2 knockdown and mTORC1 inhibition (by Torin 1 and 2) on DNA damage in cells replete or depleted of eIF5A under hypoxia-acidosis conditions. Data represent mean ± SEM (n = 5). An asterisk indicates p = 0.005, 0.004, 0.002, and 0.027 (eIF5A siRNA + vehicle, Tsc2 siRNA + vehicle, and eIF5A siRNA + torin2) compared to NS siRNA + Vehicle. indicates p = 0.006 eIF5A siRNA compared to Vehicle and Tsc2 siRNA + Vehicle, two-sided student’s t test. e Top panel: representative images of yH2AX foci in U87MG cells depleted of Tsc2, and in eIF5A-replete or -depleted cells treated with mTORC1 inhibitors (Torin 1 and 2) under hypoxia-acidosis conditions. Bottom panel: analysis of yH2AX (n = 5), an asterix indicates p = 0.0005 and 0.00001 (eIF5A siRNA, tsc2 siRNA) compared to NS siRNA + vehicle, two-sided Mann–Whitney U test. Top of the box denotes Q3, the bottom of the box represents Q1; middle line denotes median; X represents mean; bottom whisker denotes minimum: 1st quartile—(1.5*IQR); top whisker denotes maximum: 3rd quartile + (1.5*IQR).
Fig. 6
Fig. 6. Mechanism of eIF5A-mediated Tsc2 protein induction.
a Co-immunoprecipitated mRNA levels of eIF5A-regulated and nonregulated mRNAs relative to IgG isotype control pulldown. Data represent mean ± SEM (n = 3). An asterisk indicates p = 0.005, 0.031, and 0.001 (Tsc2, c-Jun, and Sdc4) compared to IgG control, two-sided student’s t test. b Effect of eIF5A knockdown on mRNA subcellular localization of indicated mRNAs under hypoxia acidosis conditions. NS nonsilencing. Data represent mean ± SEM (n = 3). An asterisk indicates p = 0.007, 0.041, and 0.027 (Tsc2, c-Jun, and Sdc4) eIF5A siRNA compared to NS siRNA, two-sided student’s t test. c mRNA fluorescent in situ hybridization. NS nonsilencing. One-third exposure level was used for Tsc2 mRNA FISH under eIF5A siRNA conditions relative to all other conditions to avoid signal saturation (n = 5). Scale bars: 20 μm. d Effect of eIF5A knockdown on translation efficiencies of indicated mRNAs under hypoxia-acidosis conditions. NS nonsilencing. Data represent mean ± SEM (n = 3). An asterisk indicates p = 0.0.004, 0.002, and 0.006 (Tsc2, c-Jun, and Sdc4) eIF5A siRNA compared to NS siRNA, two-sided student’s t test. e Effect of leptomycin B treatment on eIF5A protein subcellular localization in U87MG under indicated conditions. Vehicle: DMSO (n = 5). Scale bars: 20 μm. f Effect of leptomycin B treatment on Tsc2 mRNA subcellular localization under hypoxia-acidosis conditions. Vehicle (Veh): DMSO. Data represent mean ± SEM (n = 5). An asterisk indicates p = 0.015 compared to DMSO vehicle, two-sided student’s t test. g Representative immunoblot of Tsc2 protein levels in U87MG treated with leptomycin B (n = 3).
Fig. 7
Fig. 7. pH-sensing Sirt1 modulates eIF5A through deacetylation.
a Representative images of eIF5A immunocytochemistry showing eIF5A subcellular localization in U87MG subjected to indicated conditions. Data represent mean ± SEM (n = 5). Scale bars: 20 μm. b Representative immunoblots of U87MG subjected to indicated conditions. NN normoxia-neutral pH, HN hypoxia neutral, HA hypoxia acidosis (n = 3). Representative c immunoblots (n = 3) and e immunocytochemistry images (n = 5) of U87MG were treated with the indicated compounds under the indicated conditions. Scale bars: 20 μm. Ex-527: Sirt1 inhibitor; AGK2: Sirt2 inhibitor; DMSO: vehicle. d Representative immunoblots of U87MG depleted of Sirt1 (n = 3). f Representative immunoblots of U87MG ribosome-density fractions treated with the indicated compounds. Mono: light monosome fraction. Poly: heavy-polysome fractions (n = 3). g Effect of Sirt1 inhibition (using ex-527) on Tsc2 mRNA subcellular localization under hypoxia-acidosis conditions. NS nonsilencing. Data represent mean ± SEM (n = 3). An asterisk indicates p < 0.05 compared with DMSO vehicle, two-sided student’s t test. h Representative immunoblots of U87MG treated with the Sirt1 inhibitor ex-527 (n = 3). i Summary model of the Sirt1/eIF5A/Tsc2/mTORC1 pathway that enables metabolic depression and proliferative inhibition during anaerobic acidosis to prevent DNA damage.

References

    1. Tan Z, Chu ZV, Chan YJA, Lu YE, Rancati G. Mammalian cells undergo endoreduplication in response to lactic acidosis. Sci. Rep. 2018;8:2890. doi: 10.1038/s41598-018-20186-7. - DOI - PMC - PubMed
    1. Dai C, Sun F, Zhu C, Hu X. Tumor environmental factors glucose deprivation and lactic acidosis induce mitotic chromosomal instability—an implication in aneuploid human tumors. PLoS ONE. 2013;8:e63054. doi: 10.1371/journal.pone.0063054. - DOI - PMC - PubMed
    1. Xiao H, Li TK, Yang JM, Liu LF. Acidic pH induces topoisomerase II-mediated DNA damage. Proc. Natl Acad. Sci. USA. 2003;100:5205–5210. doi: 10.1073/pnas.0935978100. - DOI - PMC - PubMed
    1. Morita T. Low pH leads to sister-chromatid exchanges and chromosomal aberrations, and its clastogenicity is S-dependent. Mutat. Res. 1995;334:301–308. doi: 10.1016/0165-1161(95)90067-5. - DOI - PubMed
    1. Dunwoodie SL. The role of hypoxia in development of the Mammalian embryo. Dev. Cell. 2009;17:755–773. doi: 10.1016/j.devcel.2009.11.008. - DOI - PubMed

Publication types

MeSH terms