. 2020 Nov 13;10(1):19814.
doi: 10.1038/s41598-020-76391-w.

Comparing distress of mouse models for liver damage

Affiliations

Comparing distress of mouse models for liver damage

Guanglin Tang et al. Sci Rep. .

Abstract

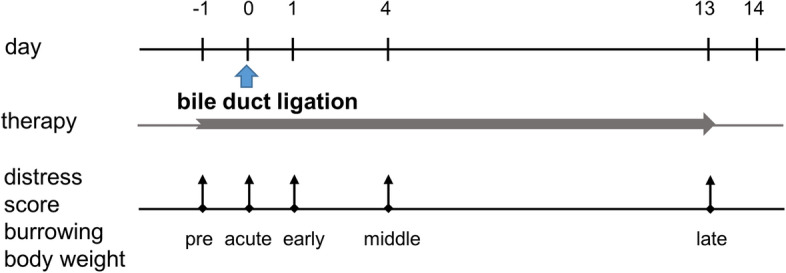
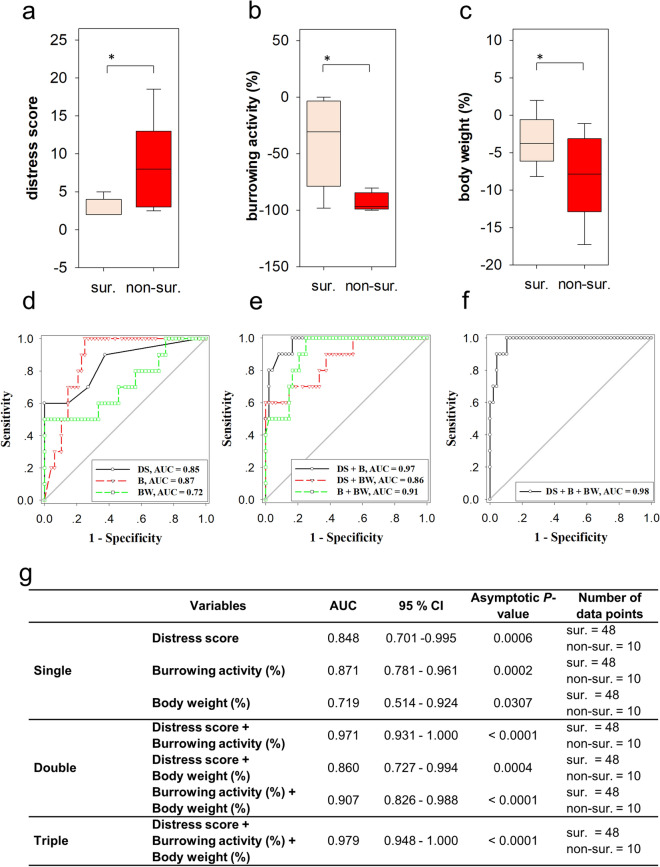
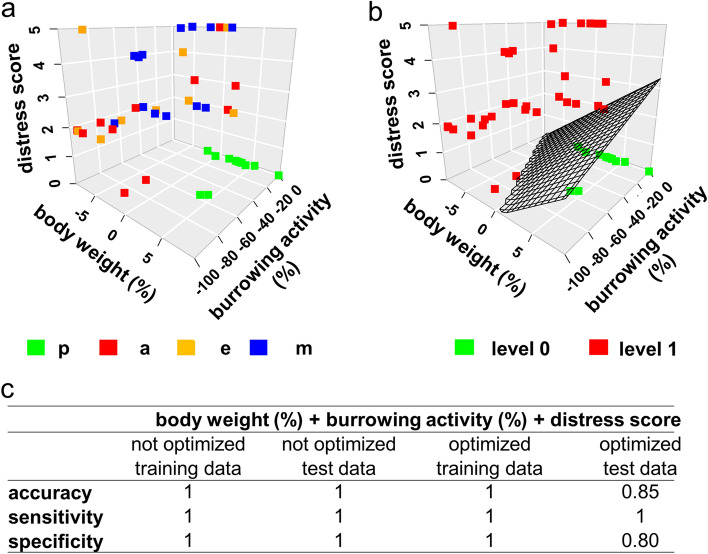
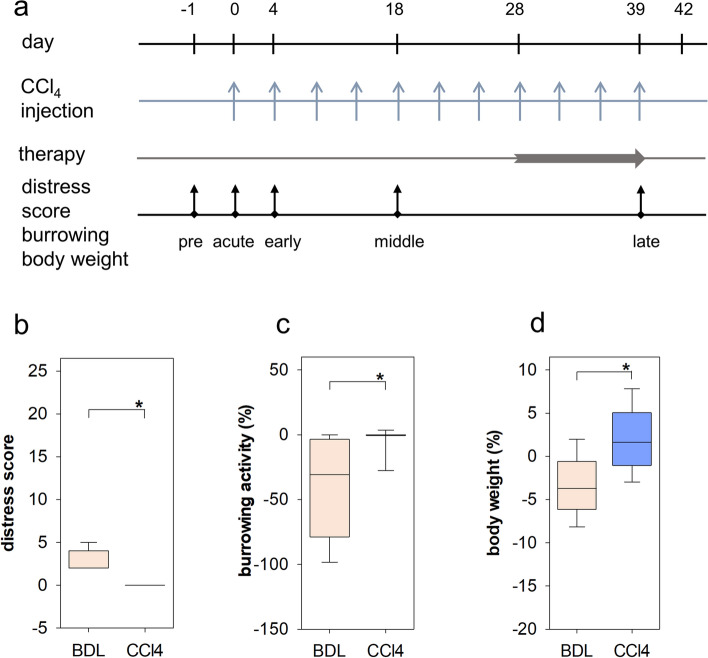
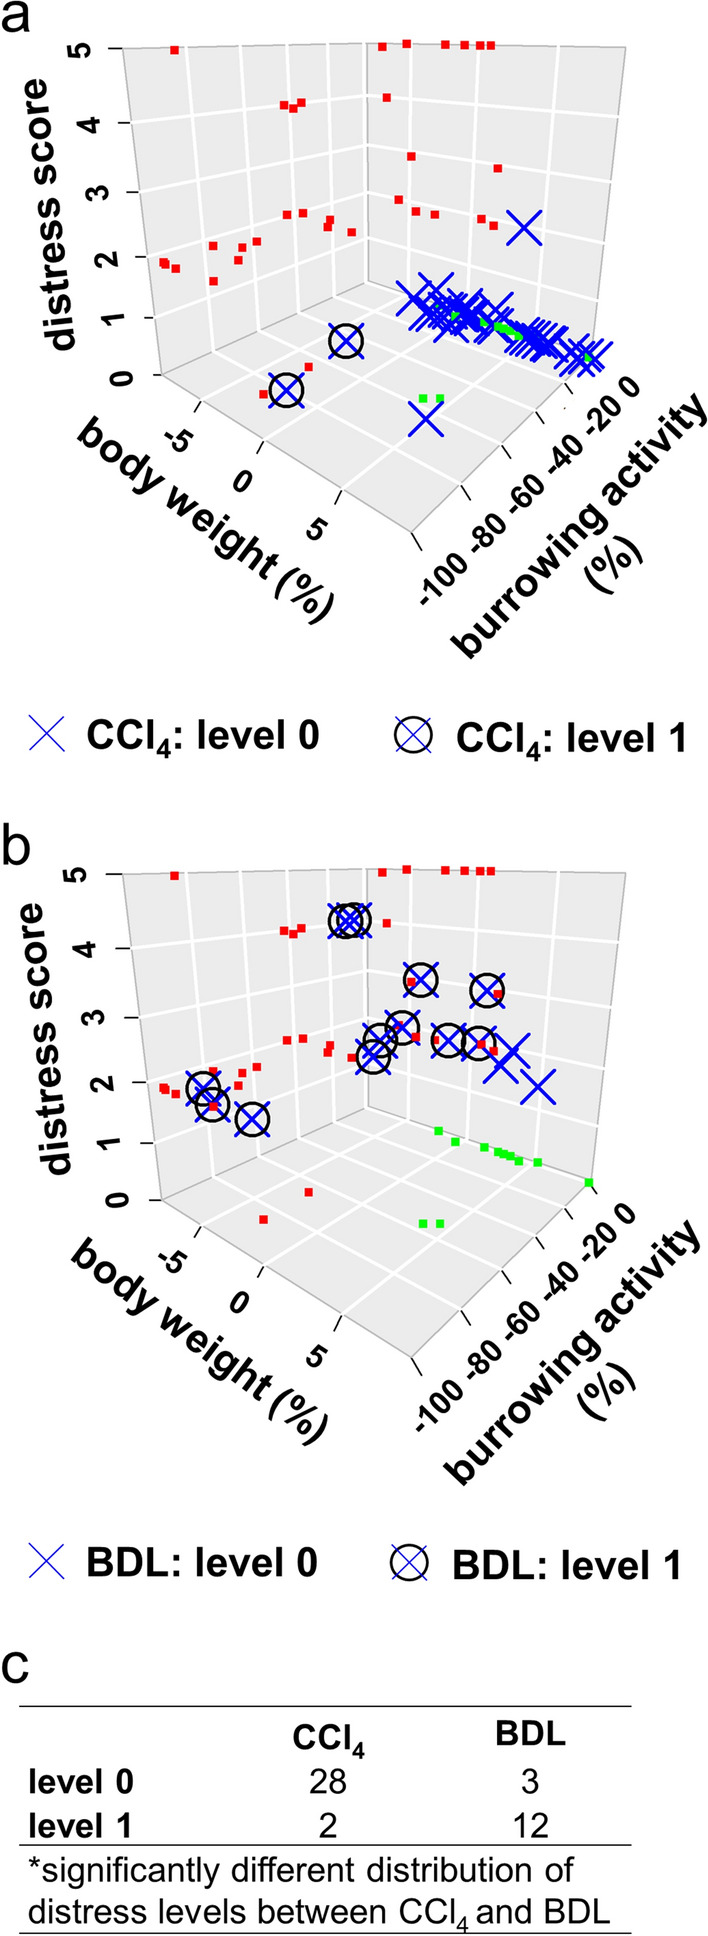
In order to foster animal welfare as well as high quality of research, many countries regulate by law that the severity of animal experiments must be evaluated and considered when performing biomedical research. It is well accepted that multiple parameters rather than a single readout parameter should be applied to describe animal distress or suffering. However, since the performance of readout parameters for animal distress is rarely defined and methods for multivariate analysis have only in rare cases been used, it is not known which methodology is most appropriate to define animal distress. This study used receiver operating characteristic curve analysis to quantify the performance of burrowing activity, body weight change and a distress score of mice after induction of liver damage by bile duct ligation or carbon tetrachloride. In addition, Support Vector Machine classification was used to compare the distress of these mouse models. This approach demonstrated that bile duct ligation causes much more distress than carbon tetrachloride-induced liver damage. This study, therefore, provides a prototype how to compare two animal models by considering several readout parameters. In the future these or similar methods for multivariate analysis will be necessary, when assessing and comparing the severity of animal models.


Conflict of interest statement

The authors declare no competing interests.

Figures

Figure 1
Figure 1
Scheme describing how the experiments for the bile duct ligation (BDL) animal model were performed. Surgery was done on day 0 and the distress parameters were evaluated during pre, acute, early, middle and late phase on the indicated days. Therapies with MCC950 or vehicle solution were performed by daily subcutaneous injection from day − 1 to day 13.
Figure 2
Figure 2
Distress before and after BDL. The distress score (a) was increased (Mann–Whitney rank sum test, P ≤ 0.001), burrowing activity (b) was decreased (Mann–Whitney rank sum test, P ≤ 0.001) and body weight (c) was also decreased (Mann–Whitney rank sum test, P ≤ 0.001), when comparing data taken before BDL (pre) to data taken after BDL (post). ROC curve analysis that computed the area under the curve (AUC) for single (d), two (e) or all three (f) distress parameters. The performance of single and multiple parameters is described by presenting the AUC, the 95% confidence interval (CI) and the asymptotic P-value (g). Data of 16 mice, pre: n = 16 data points, post: n = 48 data points.
Figure 3
Figure 3
Distress of survivors and non-survivors after BDL. The distress score (a) was increased (Mann–Whitney rank sum test, P ≤ 0.001), whereas burrowing activity (b) was decreased (Mann–Whitney rank sum test, P ≤ 0.001) and body weight (c) was also reduced (Mann–Whitney rank sum test, P = 0.031), when comparing data of survivors (sur.) to data of non-survivors (non-sur.). ROC curve analysis shows the area under the curve (AUC) for single (d), two (e) or all three (f) distress parameters. The performance of single and multiple parameters is described by presenting the AUC, the 95% confidence interval (CI) and the asymptotic P-value (g). Survivors: 16 mice, 48 data points; non-survivors: 10 mice, 10 data points.
Figure 4
Figure 4
Generation of a training model by SVM. Single data points (squares), which were derived from the training data set from identical animal previous (p) to BDL and at the acute (a), early (e), and middle (m) phase of cholestasis are presented in form of a three dimensional scatter plot (a). A discriminatory model was built by training a linear SVM kernel to the labelled data in order to differentiate between two levels (level 0 and level 1) of distress (b): The resulting classifier (hyperplane) discriminates between these two levels. The accuracy, sensitivity and specificity of the training model was characterised using either the training data themselves or a test data set and applying the hyperplane (not optimized) or an optimized hyperplane after a 5-times repeated tenfold cross validation (c). Training data set: n = 11 data points (pre), post: n = 33 data points (post); test data set: n = 5 data points (pre), post: n = 15 data points (post).
Figure 5
Figure 5
Distress of mice after CCl4 injections and after bile duct ligation. Scheme describing how the experiments for the CCl4 animal model were performed (a): CCl4 was injected sc on the indicated days, the distress parameters were evaluated during pre, acute, early, middle and late phase and a therapy with MCC950 or vehicle solution was performed as daily subcutaneous injections from day 28 to 39. The distress score (b) was decreased (Mann–Whitney rank sum test, P ≤ 0.001), whereas burrowing activity (c) was increased (Mann–Whitney rank sum test, P ≤ 0.001) and body weight loss (d) was decreased (Student’s t test, P ≤ 0.001) when comparing post-BDL to post-CCl4 animals. BDL: 16 mice = 48 data points; CCl4: 10 mice = 30 data points.
Figure 6
Figure 6
Comparing distress caused by CCl4 injections or bile duct ligation using SVM classification. In both plots green and red squares indicate distress level 0 or distress level 1 of the BDL training data set and crosses denote data classified as distress level 0, whereas circled crosses denote data classified as distress level 1. Blue crosses denote post-CCl4 (a) and post-BDL (b) distress. A 2 × 2 contingency table compares the distributions of predicted distress levels of post-CCl4 to the post-BDL test data set (c). A significantly different distribution of distress levels between these data sets has been determined by Fisher’s Exact Test, *P ≤ 0.001), CCl4: n = 30 data points; BDL: n = 15 data points.

Similar articles

Cited by

References

    1. 1National Research Council (US) Committee for the Update of the Guide for the Care and Use of Laboratory Animals. Guide for the Care and Use of Laboratory Animals (Eighth Edition). (National Academy of Sciences, 2011).
    1. 2Directive 2010/63/EU of the European Parliament and of the Council of 22 September 2010 on the protection of animals used for scientific purposes (Text with EEA relevance). Available from: https://eur-lex.europa.eu/LexUriServ/LexUriServ.do?uri=OJ:L:2010:276:003.... (2019).
    1. Diaz SL. Conducting and reporting animal experimentation: Quo vadis? Eur. J. Neurosci. 2018 doi: 10.1111/ejn.14091. - DOI - PubMed
    1. Smith AJ, Clutton RE, Lilley E, Hansen KEA, Brattelid T. PREPARE: Guidelines for planning animal research and testing. Lab. Anim. 2018;52:135–141. doi: 10.1177/0023677217724823. - DOI - PMC - PubMed
    1. Kilkenny C, Browne WJ, Cuthill IC, Emerson M, Altman DG. Improving bioscience research reporting: the ARRIVE guidelines for reporting animal research. PLoS Biol. 2010;8:e1000412. doi: 10.1371/journal.pbio.1000412. - DOI - PMC - PubMed

Publication types

Substances