. 2020 Dec 17;80(6):1055-1066.e6.
doi: 10.1016/j.molcel.2020.10.034. Epub 2020 Oct 29.

Nonstructural Protein 1 of SARS-CoV-2 Is a Potent Pathogenicity Factor Redirecting Host Protein Synthesis Machinery toward Viral RNA

Affiliations

Nonstructural Protein 1 of SARS-CoV-2 Is a Potent Pathogenicity Factor Redirecting Host Protein Synthesis Machinery toward Viral RNA

Shuai Yuan et al. Mol Cell. .

Abstract

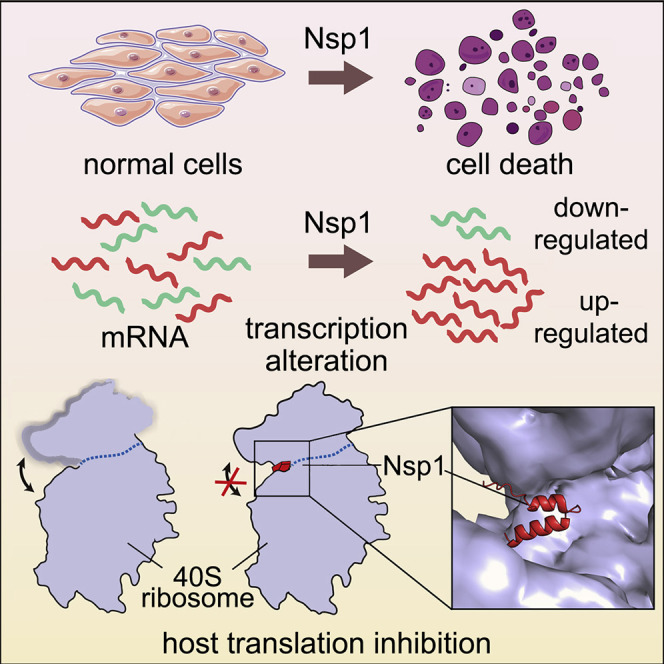
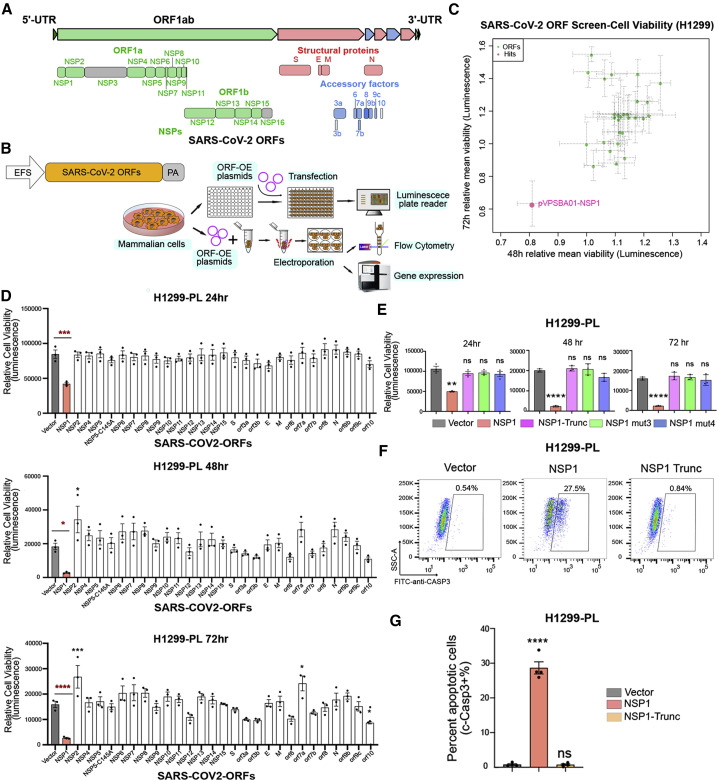
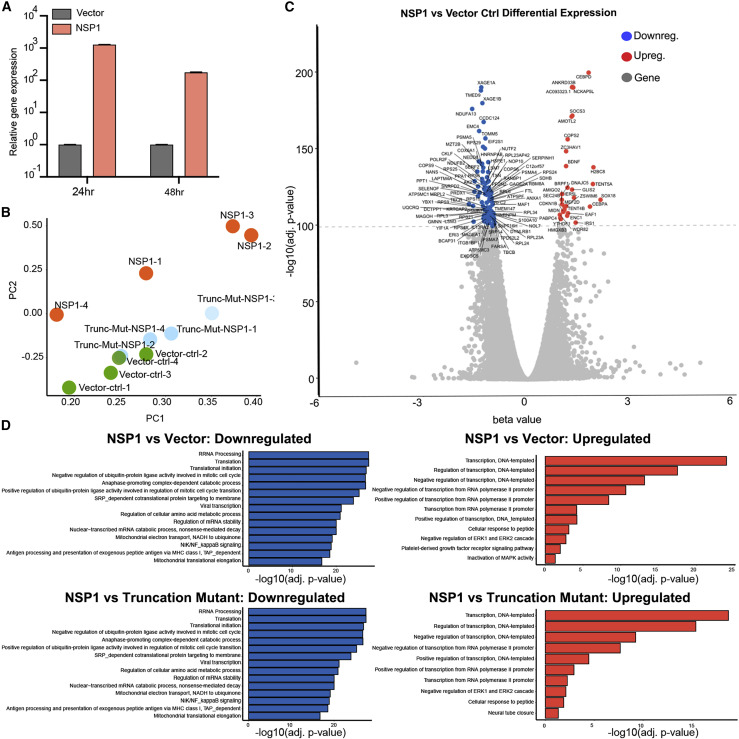
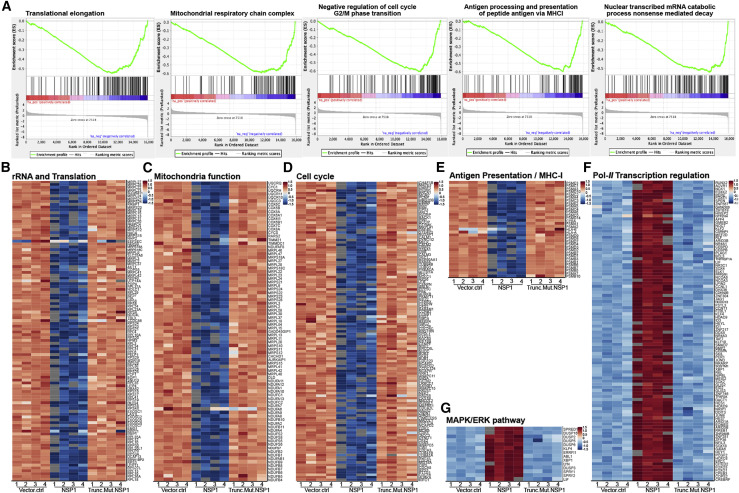
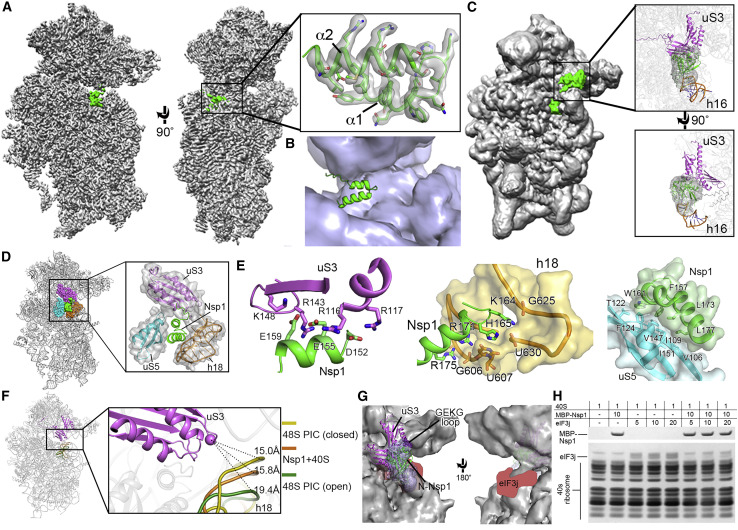
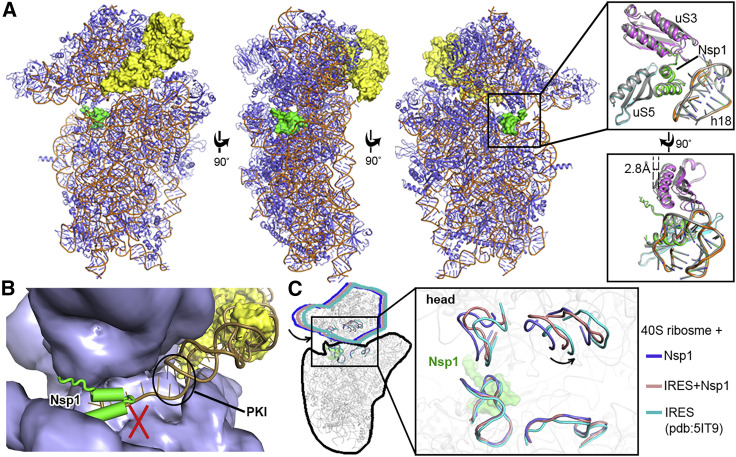
The causative virus of the COVID-19 pandemic, SARS-CoV-2, uses its nonstructural protein 1 (Nsp1) to suppress cellular, but not viral, protein synthesis through yet unknown mechanisms. We show here that among all viral proteins, Nsp1 has the largest impact on host viability in the cells of human lung origin. Differential expression analysis of mRNA-seq data revealed that Nsp1 broadly alters the cellular transcriptome. Our cryo-EM structure of the Nsp1-40S ribosome complex shows that Nsp1 inhibits translation by plugging the mRNA entry channel of the 40S. We also determined the structure of the 48S preinitiation complex formed by Nsp1, 40S, and the cricket paralysis virus internal ribosome entry site (IRES) RNA, which shows that it is nonfunctional because of the incorrect position of the mRNA 3' region. Our results elucidate the mechanism of host translation inhibition by SARS-CoV-2 and advance understanding of the impacts from a major pathogenicity factor of SARS-CoV-2.

Keywords: Nsp1; SARS-CoV-2; cell viability; cryo-EM; ribosome; transcriptome alteration; translation inhibition mechanism.


Conflict of interest statement

Declaration of Interests The authors declare no competing interests.

Figures

None
Graphical abstract
Figure 1
Figure 1
SARS-CoV-2 ORF Mini-screen Identified Nsp1 as a Key Viral Protein with Host Cell Viability Effect (A) Schematics of viral protein coding frames along SARS-CoV-2 genome. Colored ORFs indicate the ones used in this study, while two ORFs in gray are not (Nsp3 and Nsp16). (B) Schematics of molecular and cellular experiments of viral proteins. (C) Scatterplot of SARS-CoV-2 ORF mini-screen for host viability effect in H1299 cells, at 48 and 72 h post-ORF introduction. Each dot represents the mean normalized relative viability of host cells transfected with a viral protein encoding ORF. Dashed-line error bars indicate SDs (n = 3 replicates). Pink color indicates hits with p < 0.05 (one-way ANOVA, with multiple-group comparison). (D) Bar plot of firefly luciferase reporter measurement of viability effects of SARS-CoV-2 ORFs in H1299-PL cells, at 24, 48, and 72 h post-ORF introduction (n = 3 replicates). (E) Bar plot of firefly luciferase reporter measurement of viability effects of Nsp1 and three Nsp1 mutants (truncation, mut3: R124S/K125E and mut4: N128S/K129E) in H1299-PL cells, at 24, 48, and 72 h post-ORF introduction (left, middle, and right panels, respectively) (n = 3 replicates). (F) Flow cytometry plots of apoptosis analysis of Nsp1 and loss-of-function truncation mutant in H1299-PL cells, at 48 h post-ORF introduction. Percentage of apoptotic cells was gated as cleaved caspase-3-positive cells. (G) Quantification of flow-based apoptosis analysis of Nsp1 and loss-of-function truncation mutant in H1299-PL cells, at 48 h post-ORF introduction. For all bar plots in this figure, bar height represents mean value and error bars indicate standard error of the mean (SEM) (n = 3 replicates for each group). Statistical significance was accessed using ordinary one-way ANOVA, with multiple-group comparisons where each group was compared with empty vector control, with p values subjected to multiple-testing correction by FDR method (ns, not significant; p < 0.05, ∗∗p < 0.01, ∗∗∗p < 0.001, and ∗∗∗∗p < 0.0001). See also Figure S1.
Figure 2
Figure 2
Transcriptome Profiling of H1299 Cells Introduced with NSP1 and NSP1 Truncation Mutant by RNA-Seq (A) Quantitative PCR (qPCR) confirmation of NSP1 overexpression, at 24 and 48 h post-electroporation (n = 3 replicates). (B) Principal-component analysis (PCA) plot of the entire mRNA-seq dataset, showing separation between Nsp1, vector control, and Nsp1 truncation mutant groups, all electroporated into H1299-PL cells and harvested 24 h post-electroporation. RNA samples were collected as quadruplicates (n = 4 each group). (C) Volcano plot of differential expression between of Nsp1 versus vector control electroporated cells. Top differentially expressed genes (FDR-adjusted q < 1e-100) are shown with gene names. Upregulated genes are shown in orange. Downregulated genes are shown in blue. (D) Bar plot of top enriched pathway analysis by DAVID biological processes (BP). Nsp1 versus vector control (top) or Nsp1 versus Nsp1 mutant (bottom); highly downregulated (left) and upregulated (right) genes are shown (q < 1e-30). See also Figure S2.
Figure 3
Figure 3
Highly Differentially Expressed Genes between Nsp1, Vector Control, and Nsp1 Mutant Group in the Context of Top Major Enriched Pathways (A) Gene set enrichment plots of representative enriched pathways by GSEA. (B–E) Heatmap of Nsp1 highly repressed genes (q < 1e-30) in rRNA processing and translation (B), mitochondria function (C), cell cycle (D), and MHC-I antigen presentation processes (E). (F and G) Heatmap of Nsp1 highly induced genes (q < 1e-30) in polII-related transcription regulation processes (F) and the MAPK/ERK pathway (G). See also Figure S2.
Figure 4
Figure 4
Cryo-EM Structure of the Nsp1-40S Ribosome Complex (A) Overall density of the Nsp1-40S ribosome complex with Nsp1 (green) and 40S ribosome (gray). Inset shows C-Nsp1 with corresponding density with clear sidechain features. C-Nsp1 α helices (α1, aa 154–160; α2, aa 166–179) are labeled. (B) Cross section of the C-Nsp1 (green) within the mRNA entry channel. 40S ribosome is shown in surface, and C-Nsp1 is displayed in cartoon. (C) Overall density of Nsp1-40S ribosome complex at a lower contour level. Insets show the extra globular density with SARS-CoV Nsp1 N-terminal domain (PDB: 2HSX, green) fitted. Ribosomal protein uS3 (magenta) and rRNA h16 (orange) are shown in cartoon. (D) Overall structure of the C-Nsp1-40S ribosome complex, with C-Nsp1 (green surface) and the surrounding protein uS3 (magenta sphere representation), uS5 (cyan) and rRNA h18 (orange) highlighted. The inset shows zoomed-in view of C-Nsp1 in cartoon, with the surrounding 40S components in cartoon and surface to illustrate the mRNA entry channel. (E) Molecular interactions between C-Nsp1 and 40S ribosome components, including uS3, h18, and uS5. Proteins and rRNA are in the same color as in (D) and shown in cartoon, with binding pocket and hydrophobic interface depicted in surface. The interacting residues are shown in sticks. (F) The conformation of the 40S ribosome in the Nsp1-40S complex is similar to the close form in the 48S PIC. Q179 of uS3 (magenta cartoon) is displayed as a sphere. h18 is in cartoon and colored dark yellow (48S closed conformation), orange (Nsp1-40S ribosome complex), and dark green (48S open conformation), with distances to Q179 indicated by the dashes. (G) The N-terminal domain of Nsp1 covers uS3 surface on the solvent side. The cryo-EM density in this region is shown in blue surface with SARS-CoV Nsp1 N-terminal domain (PDB: 2HSX) fitted. uS3 (magenta) is depicted in cartoon. The GEKG loop (dark purple) is shown in sphere representation. The putative location of eIF3j is marked in red. (H) SDS-PAGE analysis of Nsp1 and eIF3j competition at different concentration ratios (indicated in the top table). See also Figures S3–S5.
Figure 5
Figure 5
Nsp1 Prevents Physiological Conformation of the 48S PIC (A) Overall structure of the Nsp1-40S-CrPV IRES complex. Nsp1 (green) and IRES (yellow) are presented in surface. The ribosome proteins (slate) and rRNA (orange) are shown in cartoon. The right insets display the conformation change in the Nsp1-binding region (cartoon representation) with or without the IRES. (B) The previously reported model of CrPV IRES (PDB: 5IT9; orange cartoon) fitted to 40S ribosome in the present of Nsp1 (green cartoon). 40S ribosome (slate) and the currently observed IRES (yellow) are presented in surface. (C) C-Nsp1 restricts the 40S ribosome head rotation. Superposition of the Nsp1-40S, Nsp1-40S-CrPV IRES, and IRES-40S (PDB: 5IT9) complexes is shown is cartoon. Zoomed view displays the head rotations represented by selected rRNA regions. C-Nsp1 (green) is displayed in surface. See also Figure S6.

References

    1. Adams P.D., Afonine P.V., Bunkóczi G., Chen V.B., Davis I.W., Echols N., Headd J.J., Hung L.W., Kapral G.J., Grosse-Kunstleve R.W. PHENIX: a comprehensive Python-based system for macromolecular structure solution. Acta Crystallogr. D Biol. Crystallogr. 2010;66:213–221. - PMC - PubMed
    1. Almeida M.S., Johnson M.A., Herrmann T., Geralt M., Wüthrich K. Novel beta-barrel fold in the nuclear magnetic resonance structure of the replicase nonstructural protein 1 from the severe acute respiratory syndrome coronavirus. J. Virol. 2007;81:3151–3161. - PMC - PubMed
    1. Astuti I., Ysrafil Severe acute respiratory syndrome coronavirus 2 (SARS-CoV-2): an overview of viral structure and host response. Diabetes Metab. Syndr. 2020;14:407–412. - PMC - PubMed
    1. Aylett C.H., Boehringer D., Erzberger J.P., Schaefer T., Ban N. Structure of a yeast 40S-eIF1-eIF1A-eIF3-eIF3j initiation complex. Nat. Struct. Mol. Biol. 2015;22:269–271. - PubMed
    1. Babaylova E., Malygin A., Gopanenko A., Graifer D., Karpova G. Tetrapeptide 60-63 of human ribosomal protein uS3 is crucial for translation initiation. Biochim. Biophys. Acta Gene Regul. Mech. 2019;1862:194411. - PubMed

Publication types

MeSH terms