. 2021 Jan 20;109(2):314-330.e4.
doi: 10.1016/j.neuron.2020.10.031. Epub 2020 Nov 13.

Mediodorsal and Ventromedial Thalamus Engage Distinct L1 Circuits in the Prefrontal Cortex

Affiliations

Mediodorsal and Ventromedial Thalamus Engage Distinct L1 Circuits in the Prefrontal Cortex

Paul G Anastasiades et al. Neuron. .

Abstract

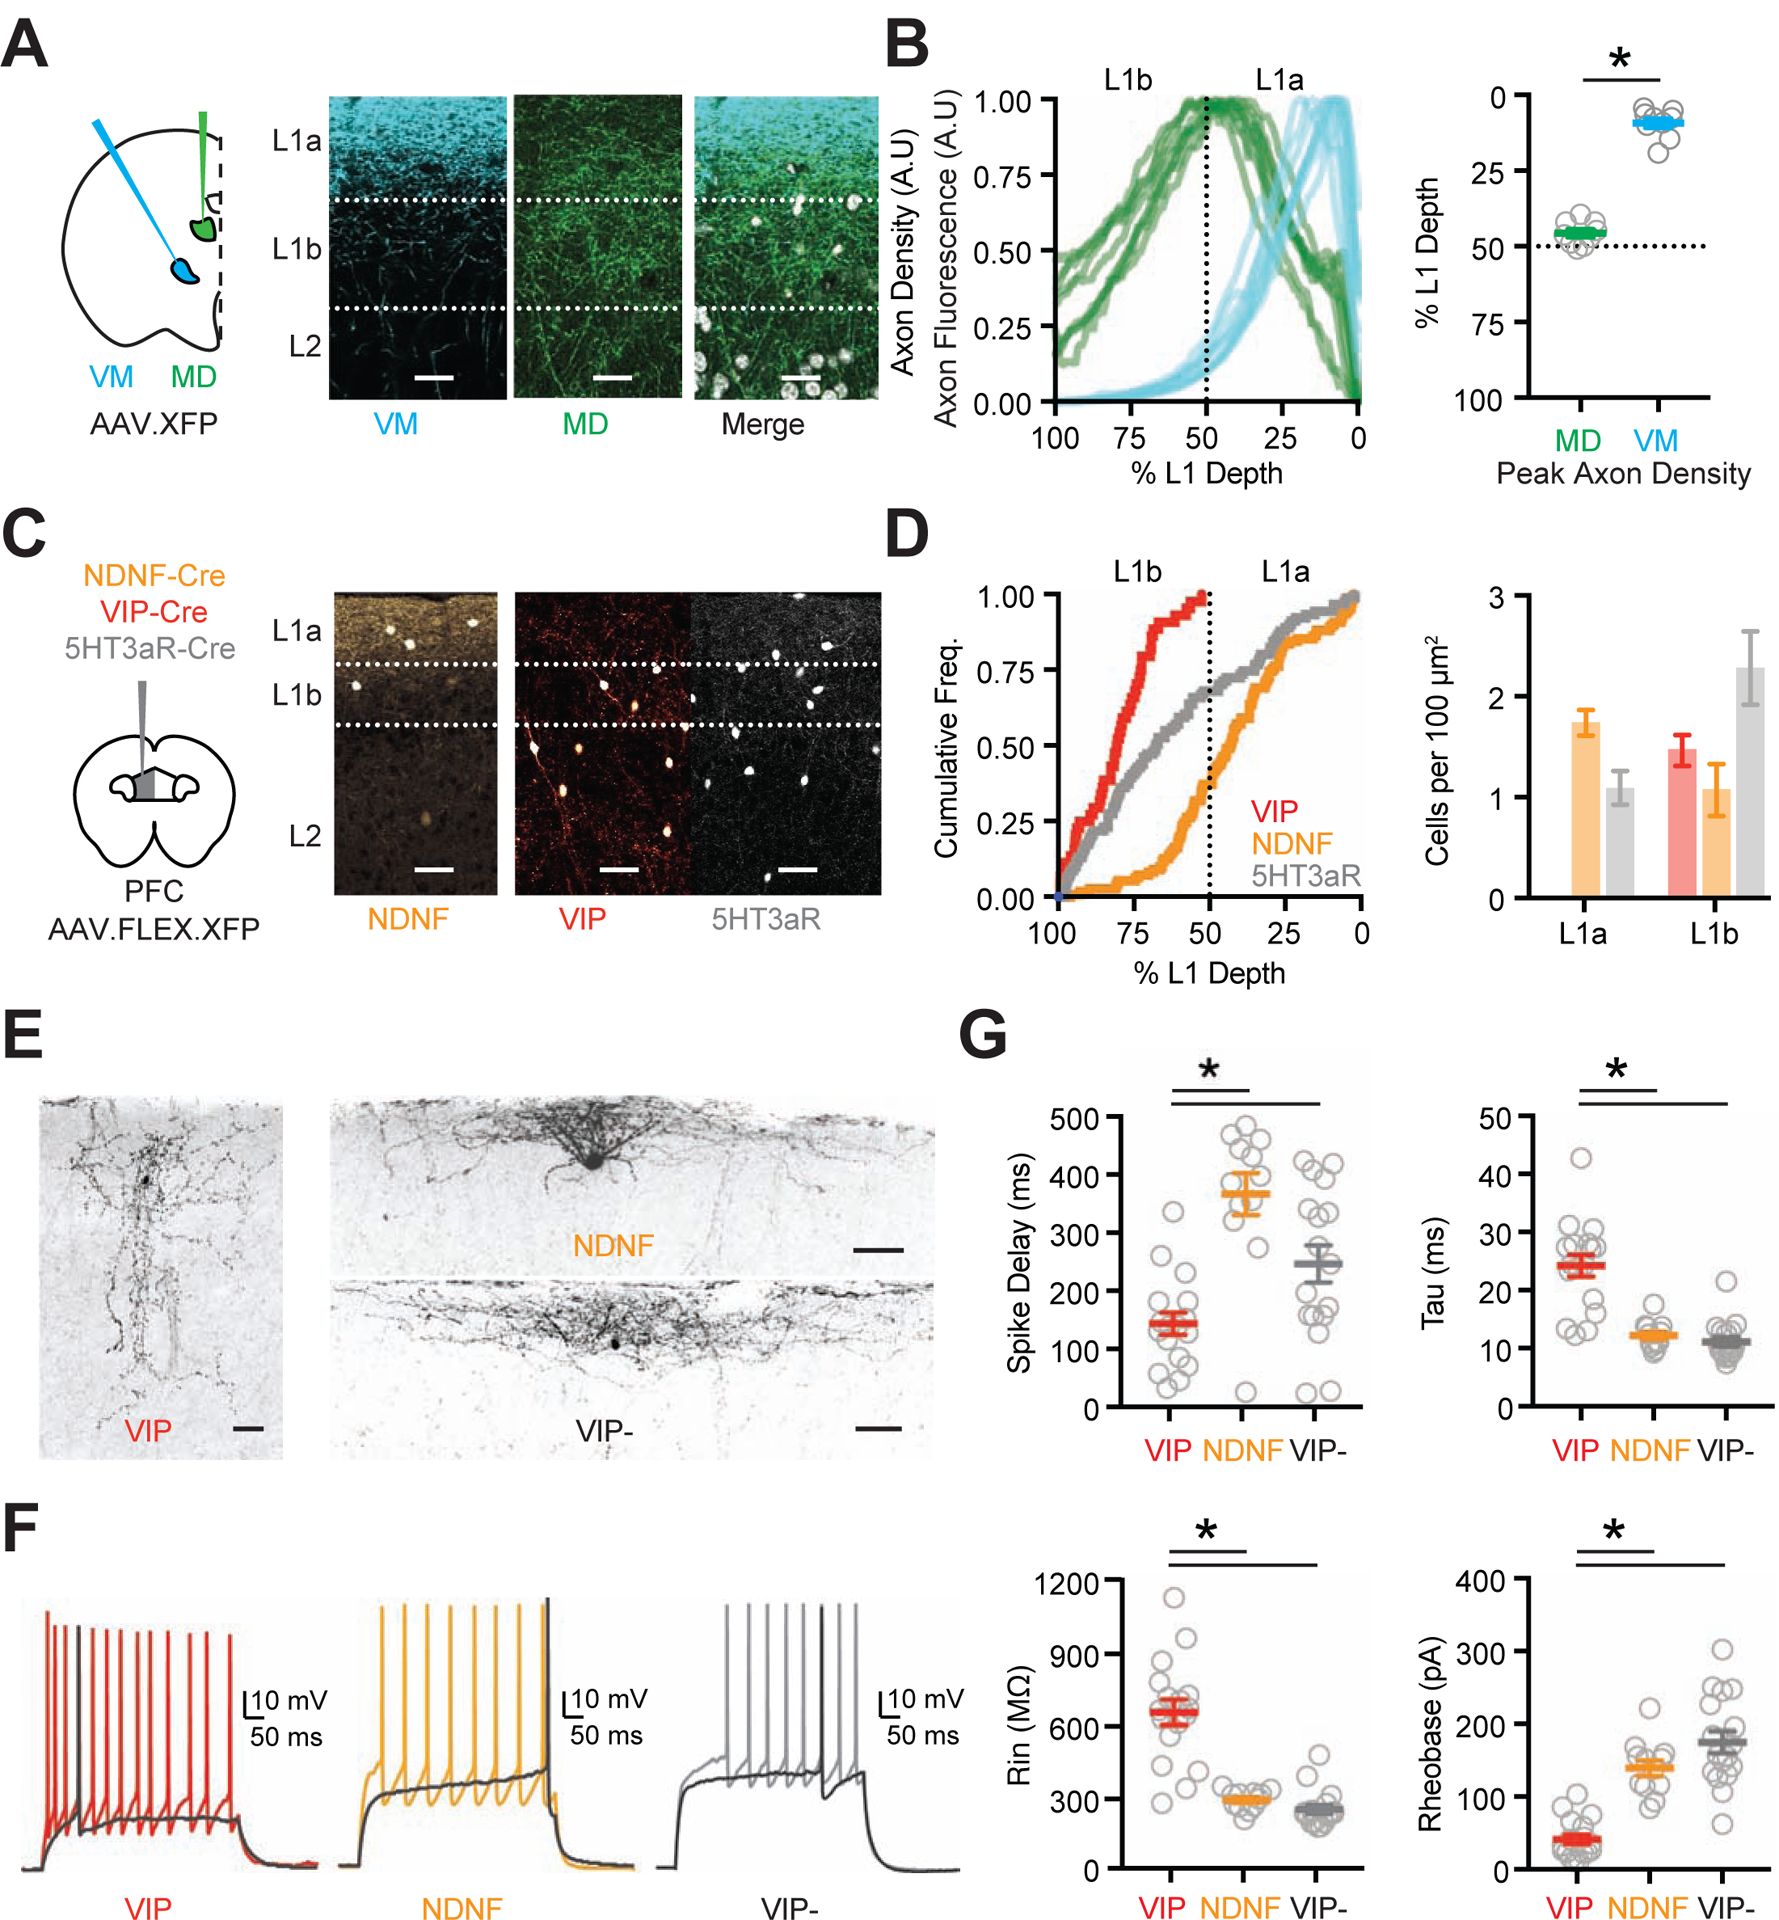
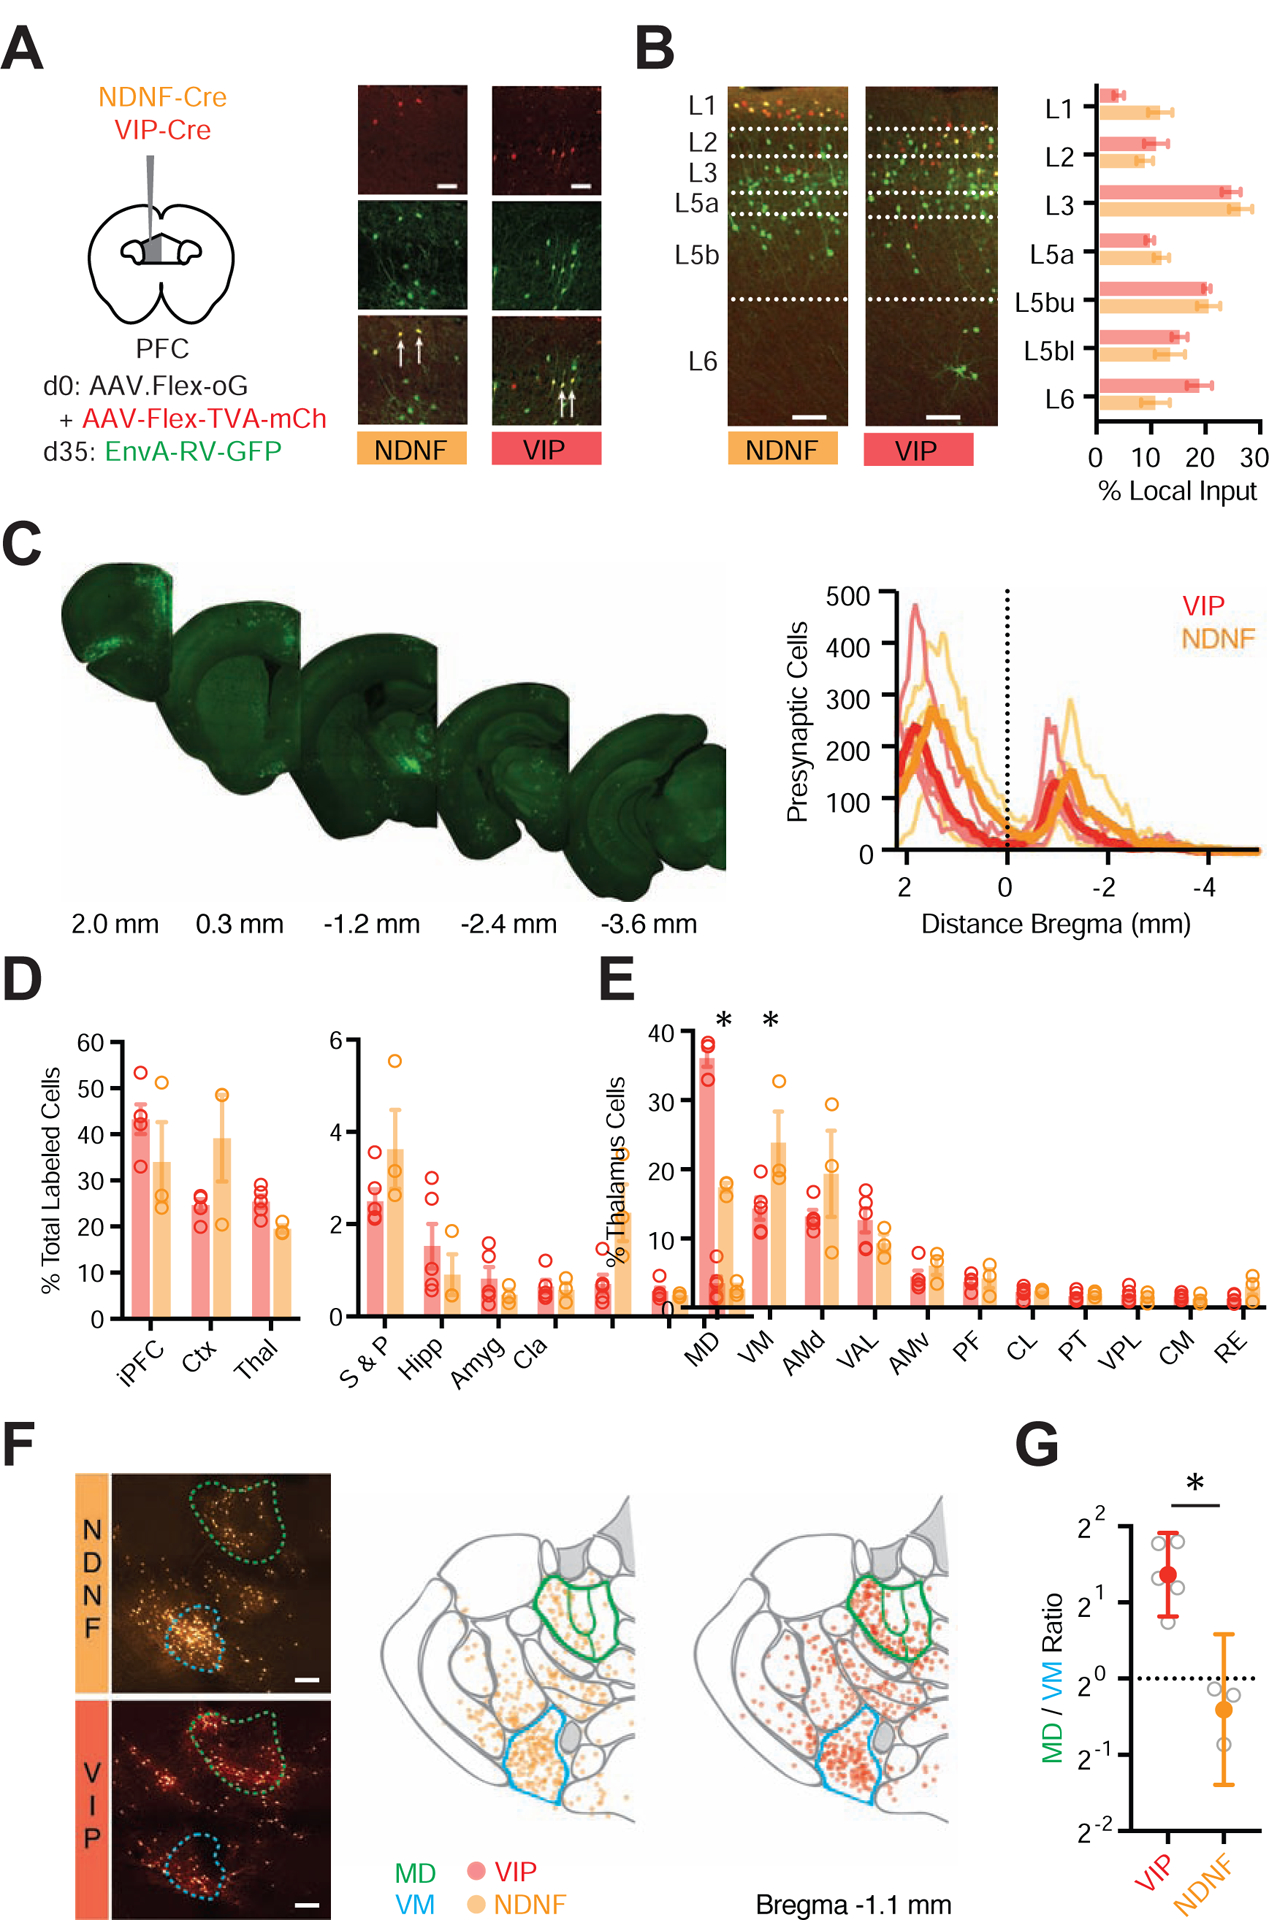
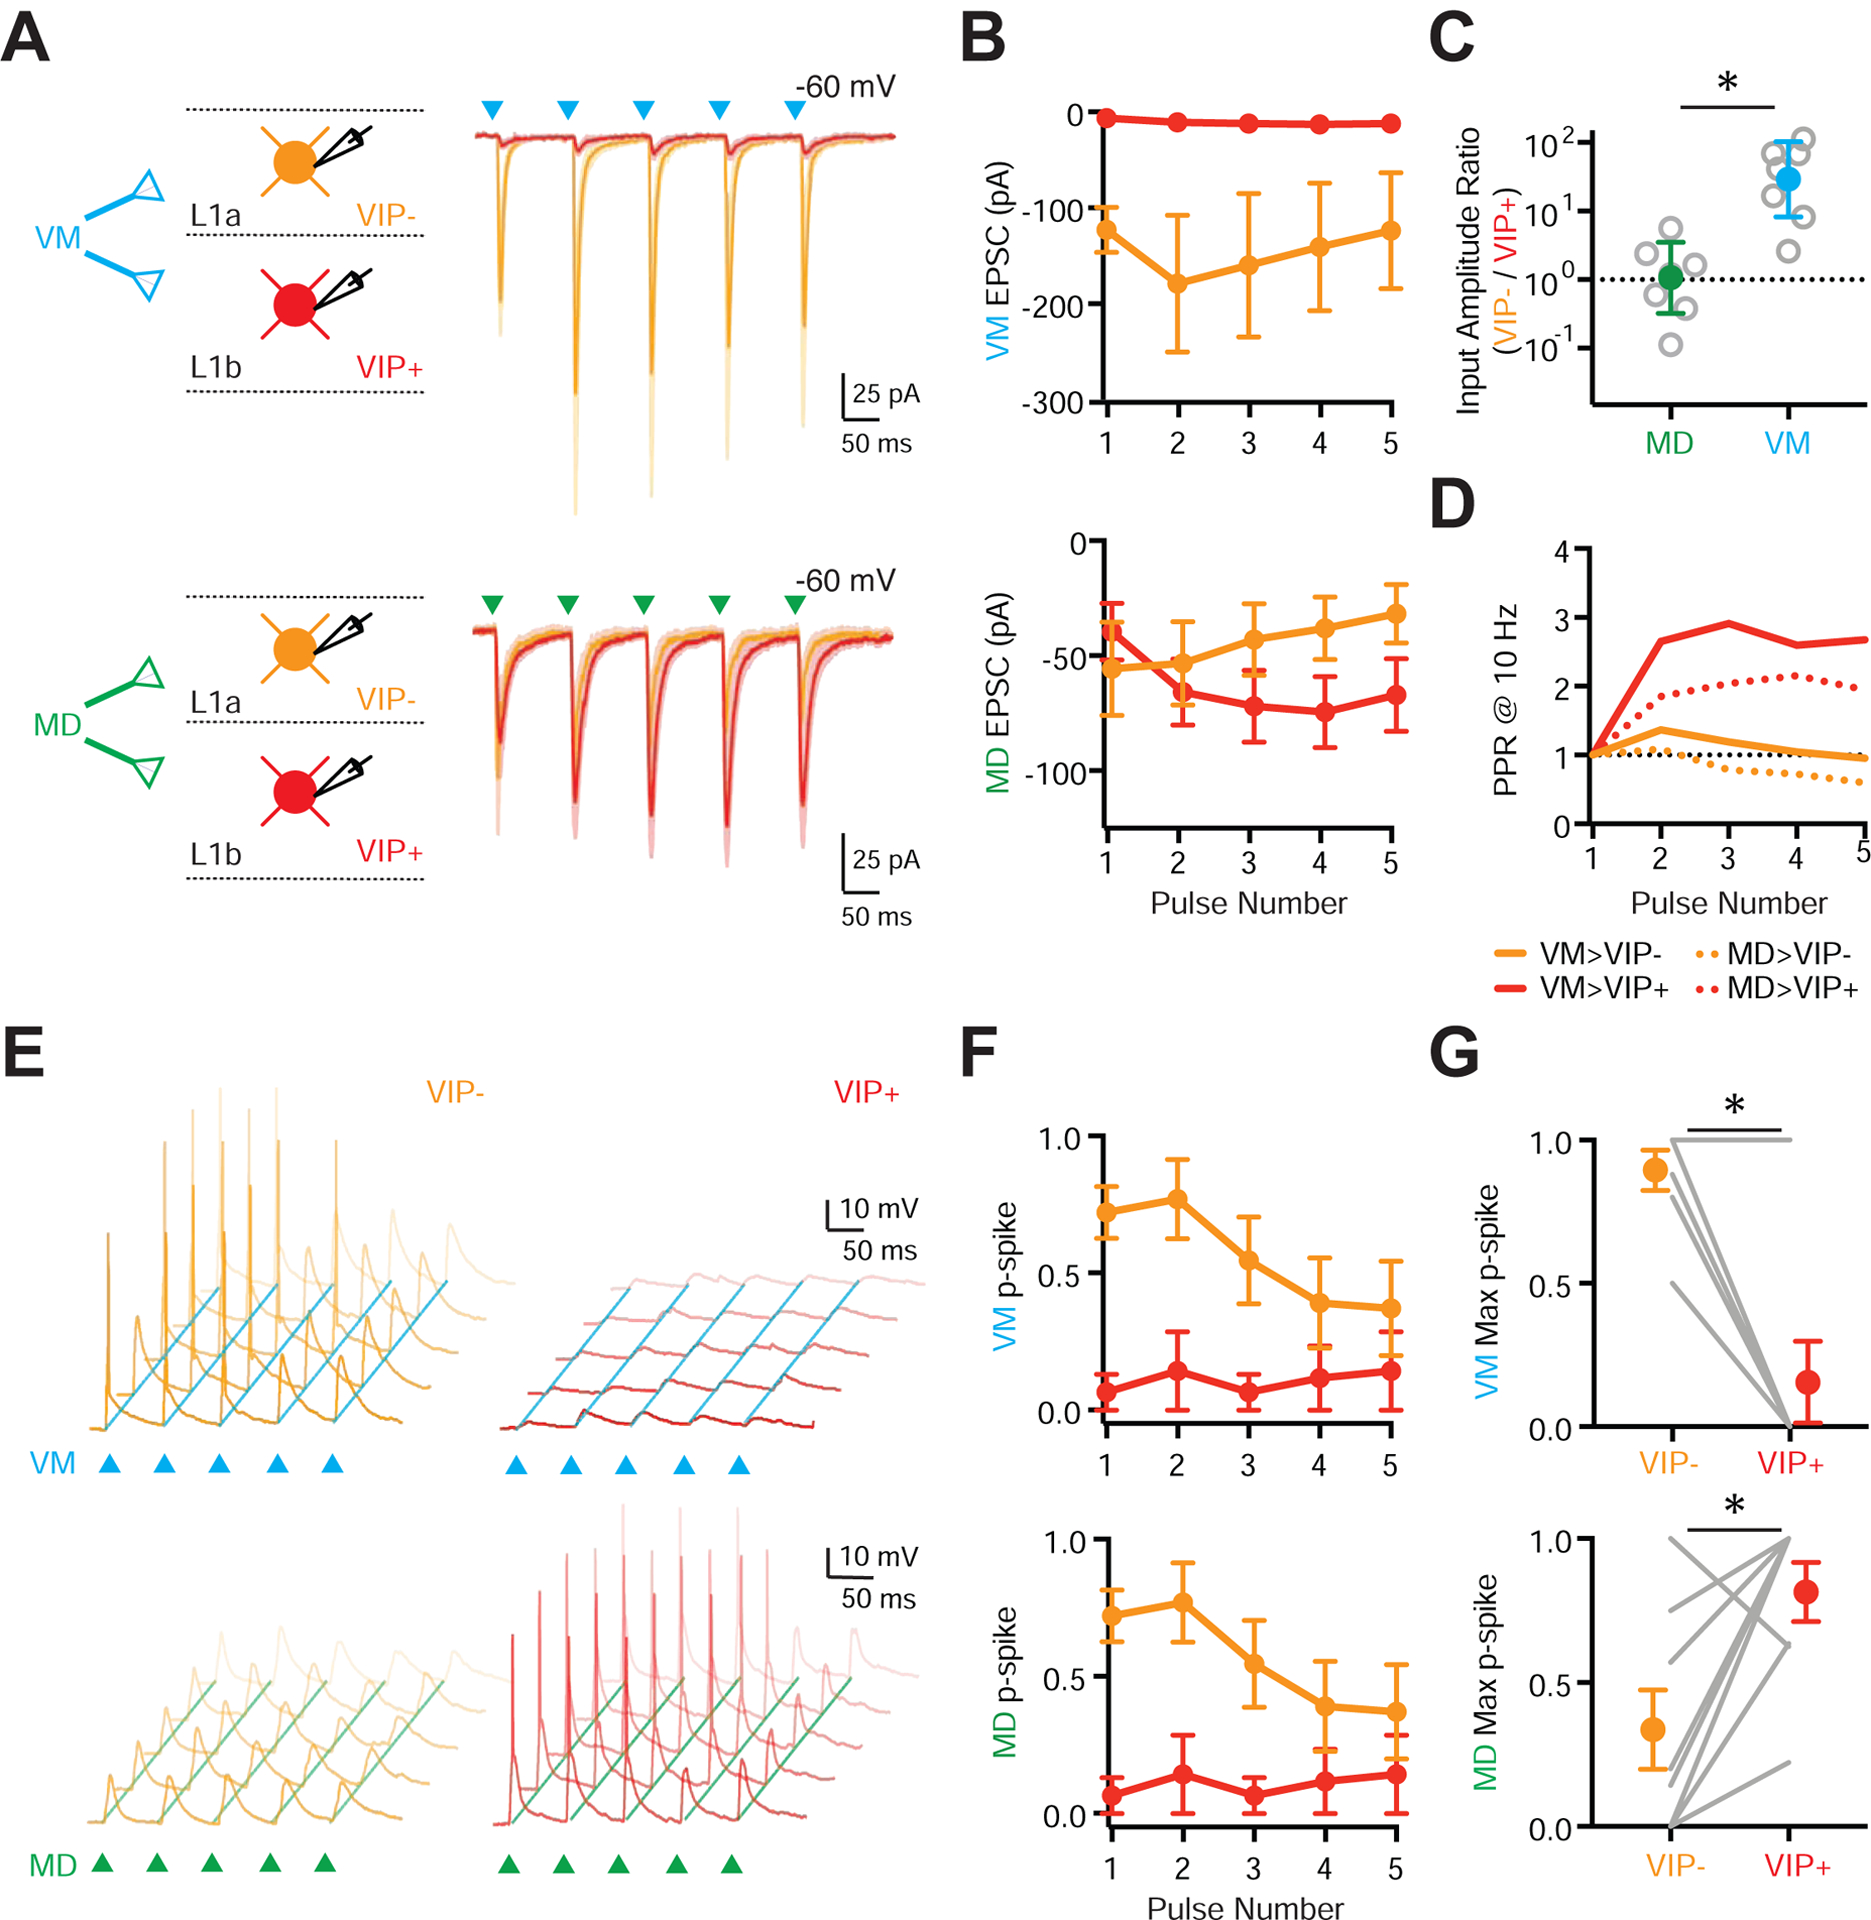
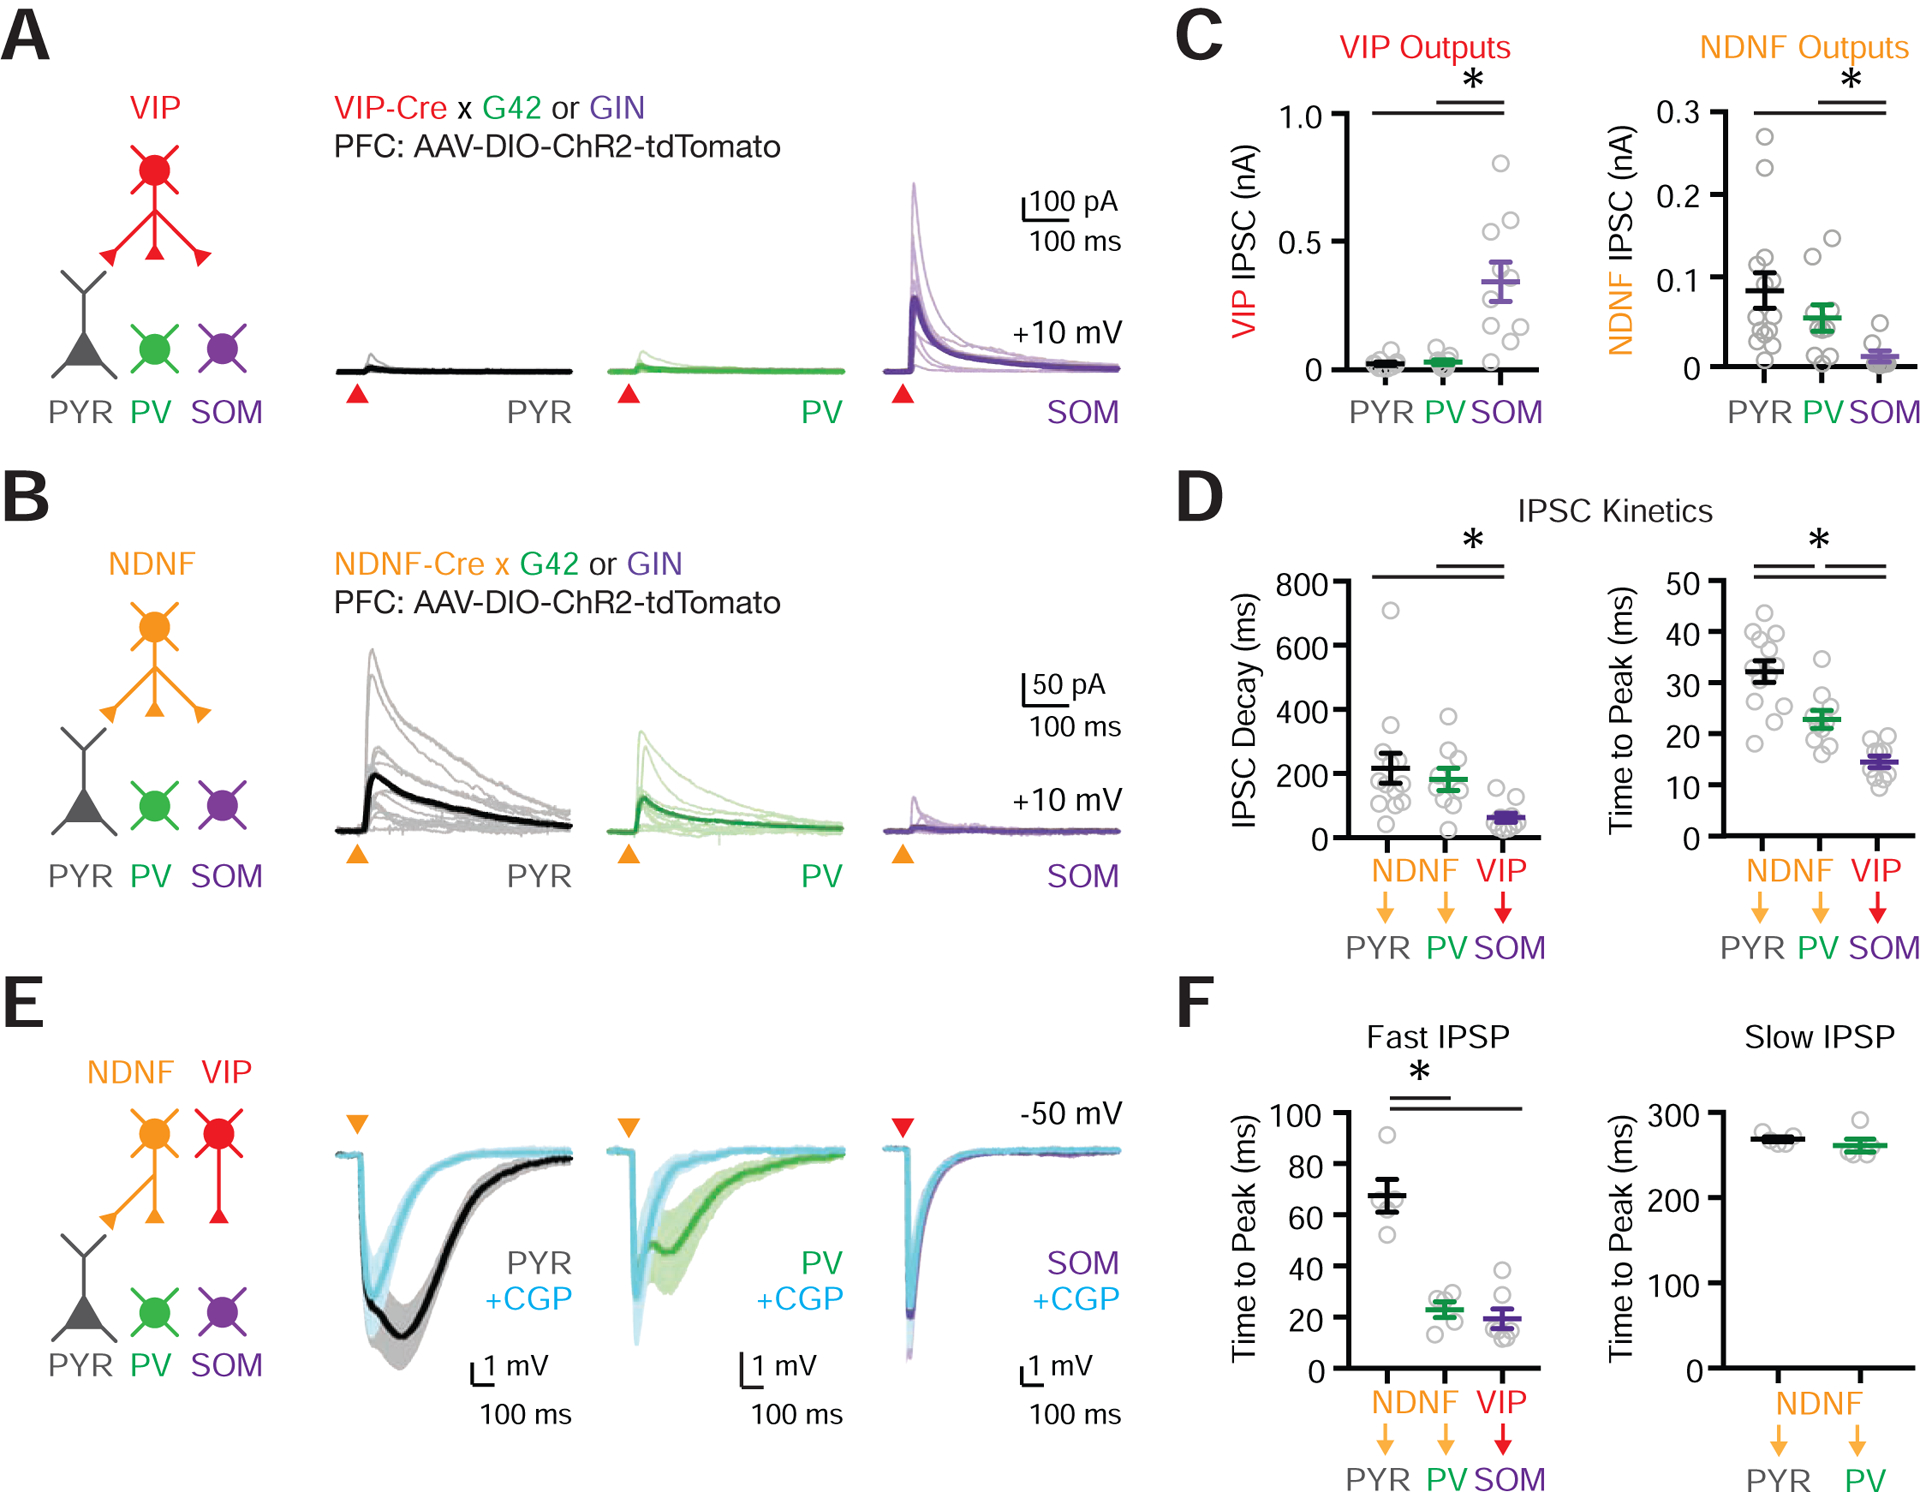
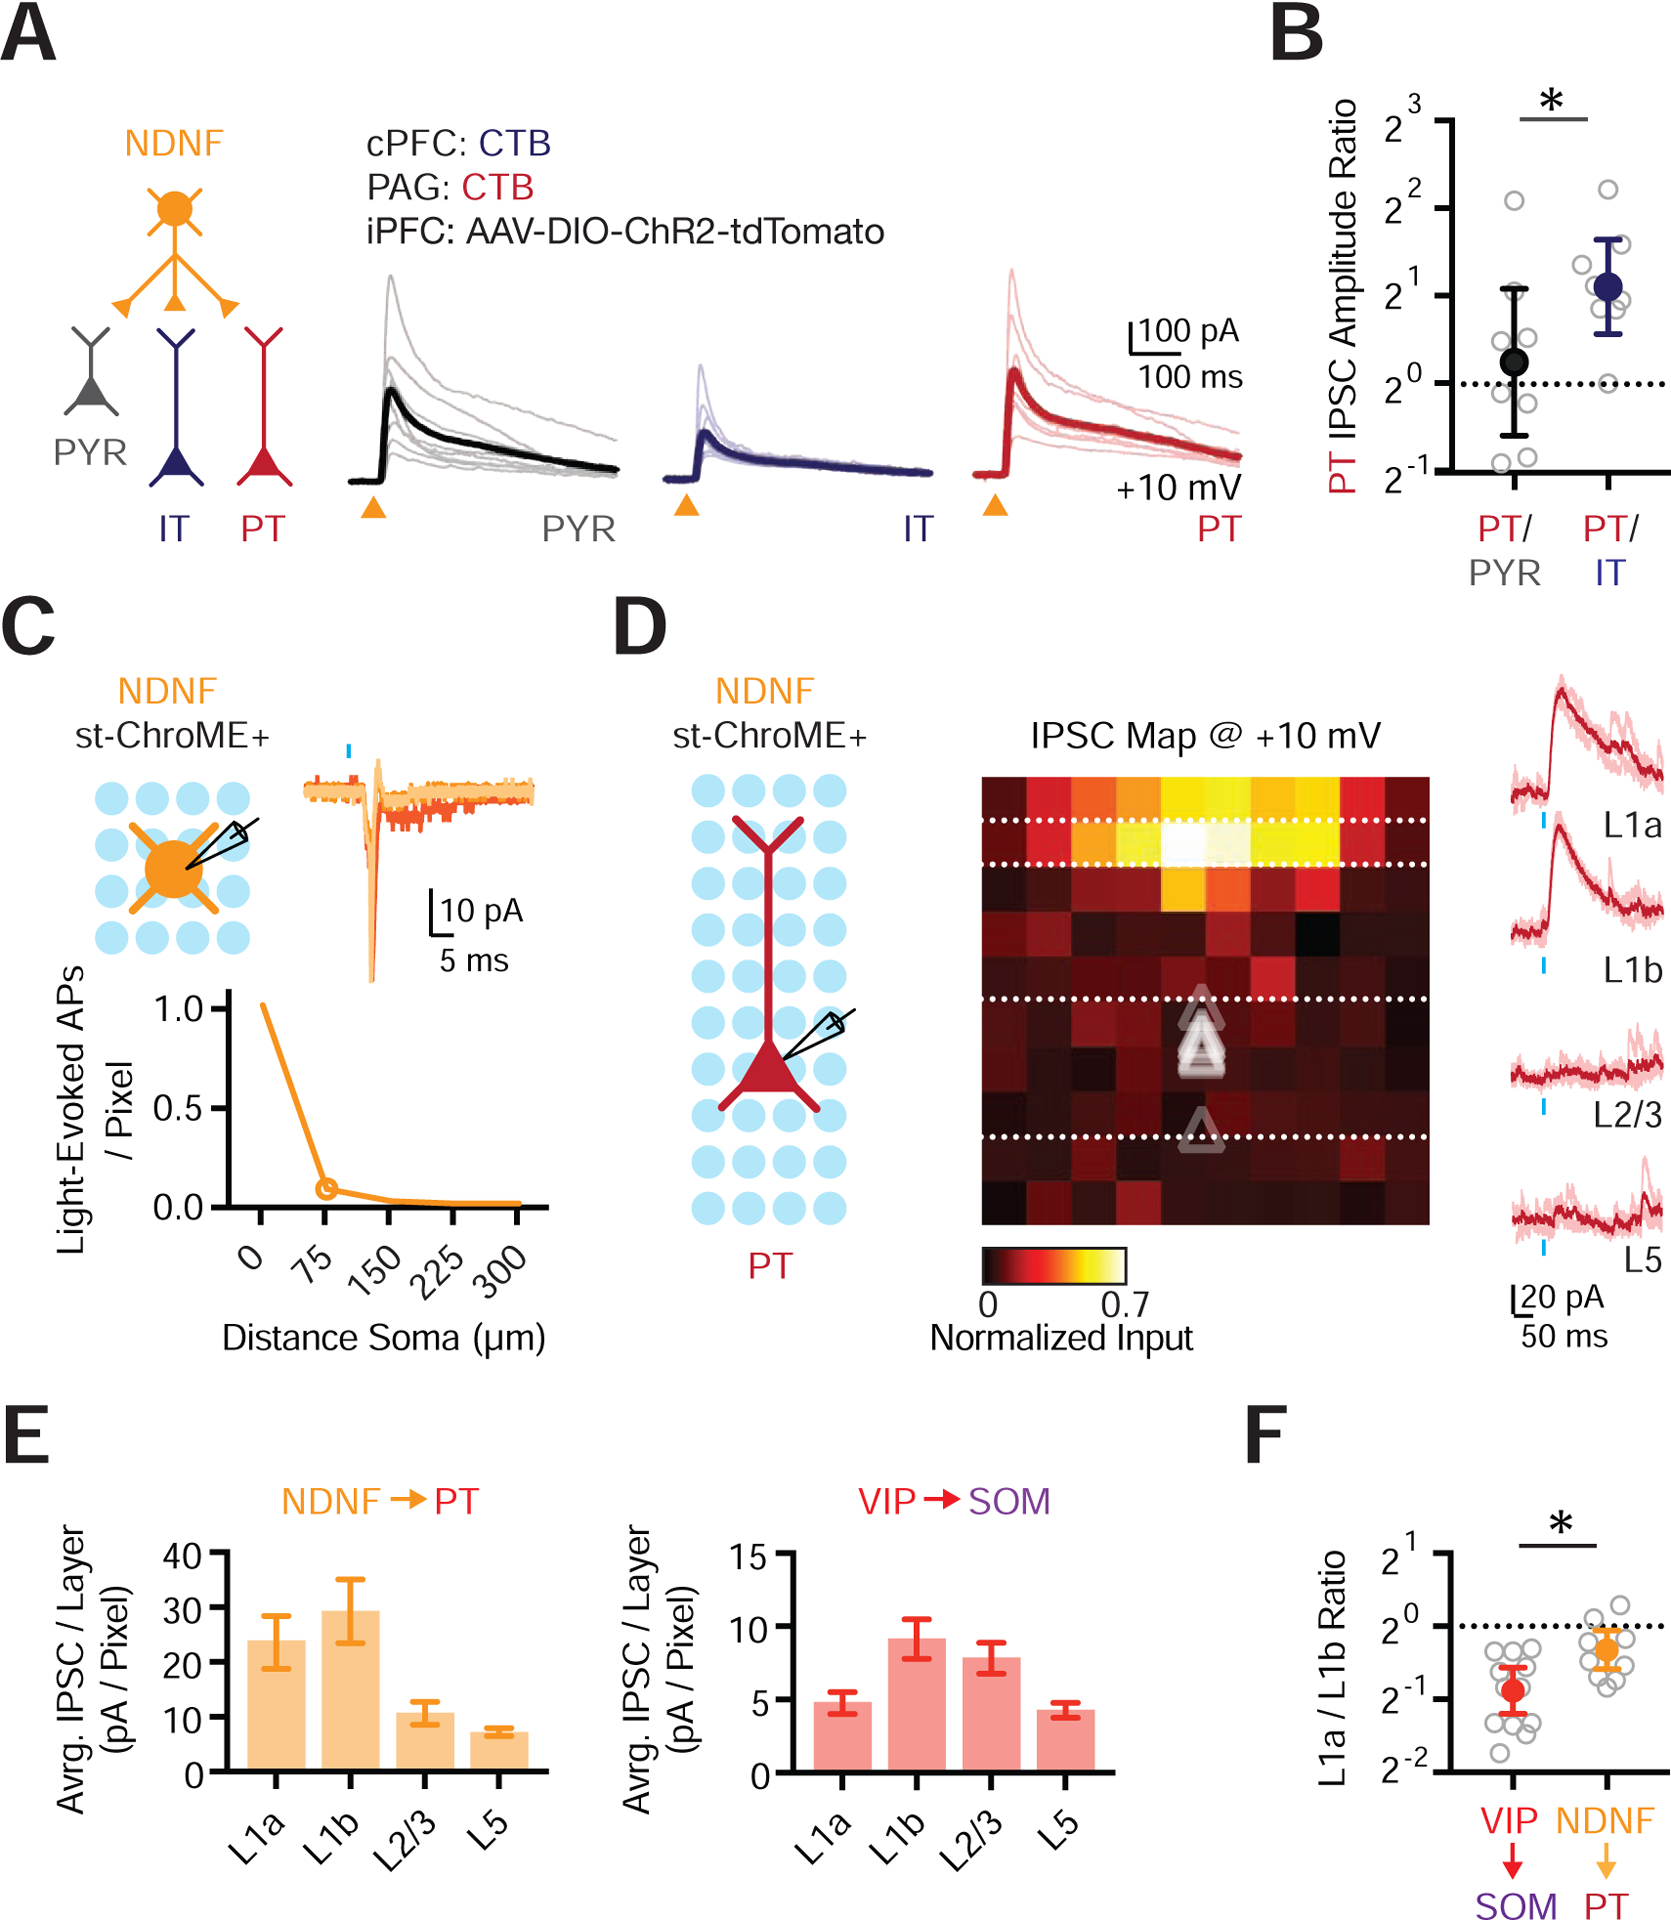
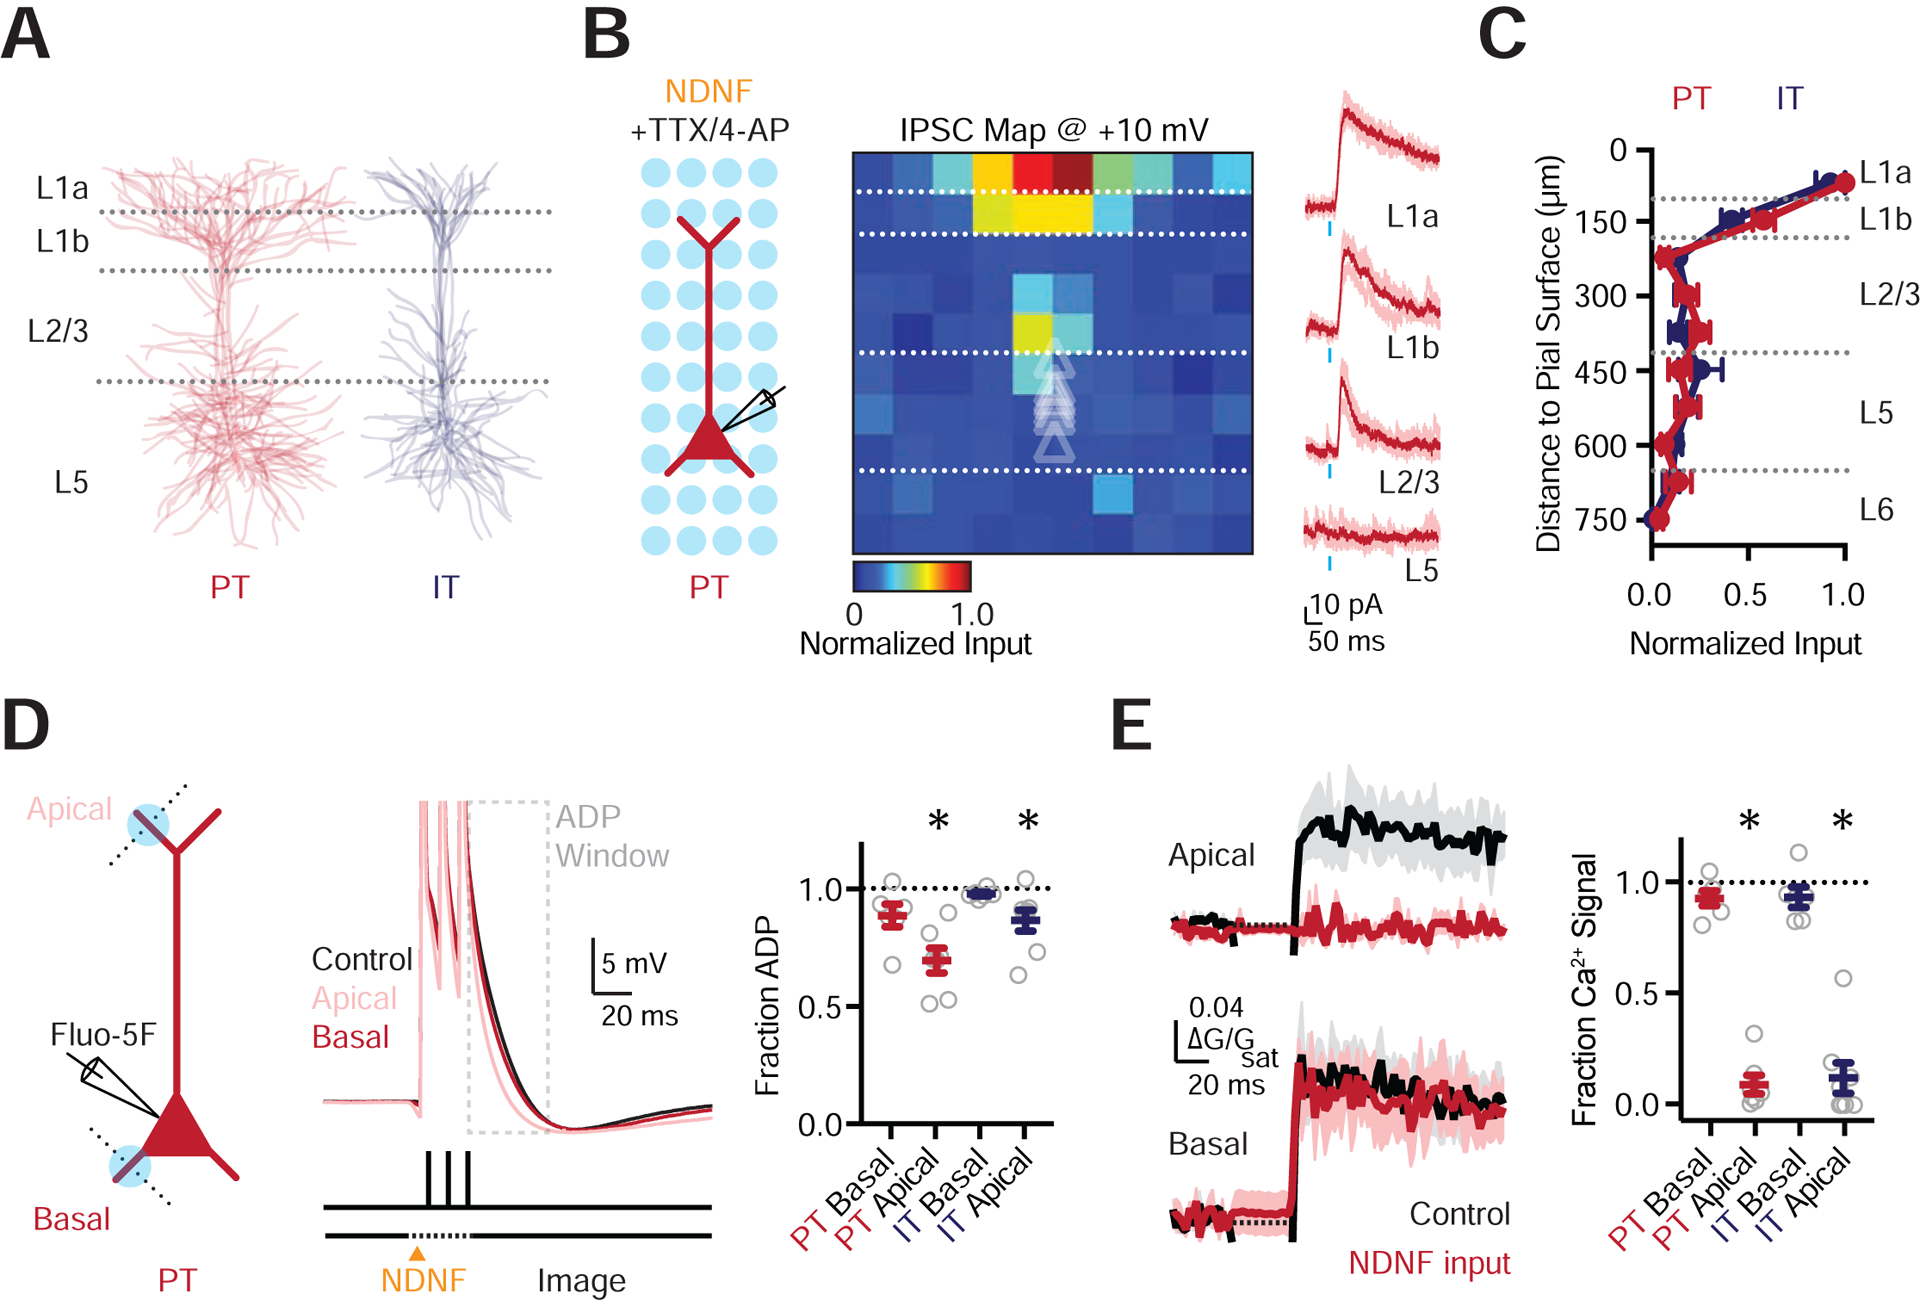
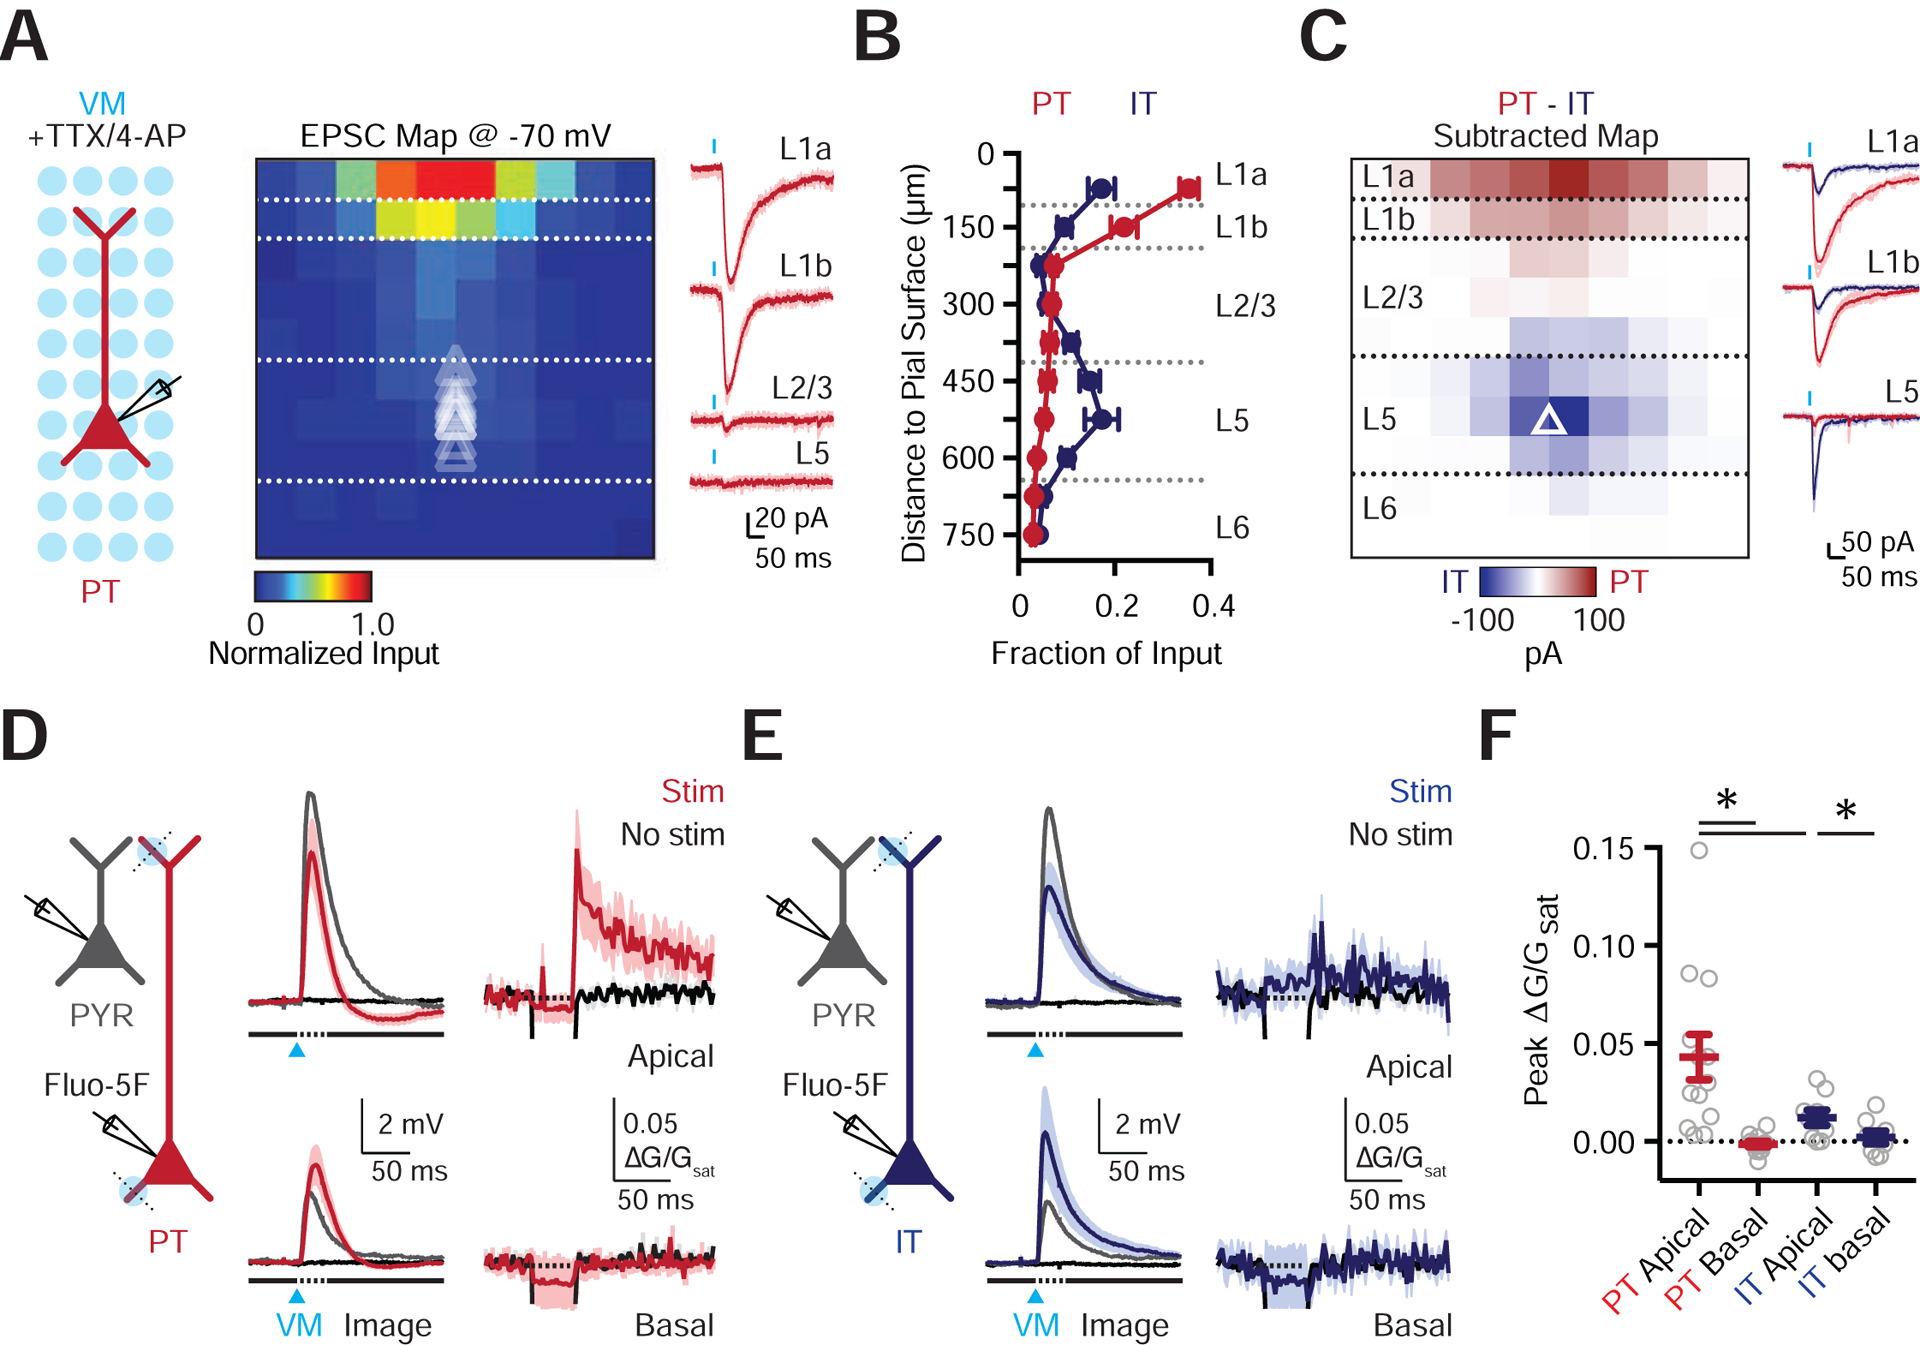
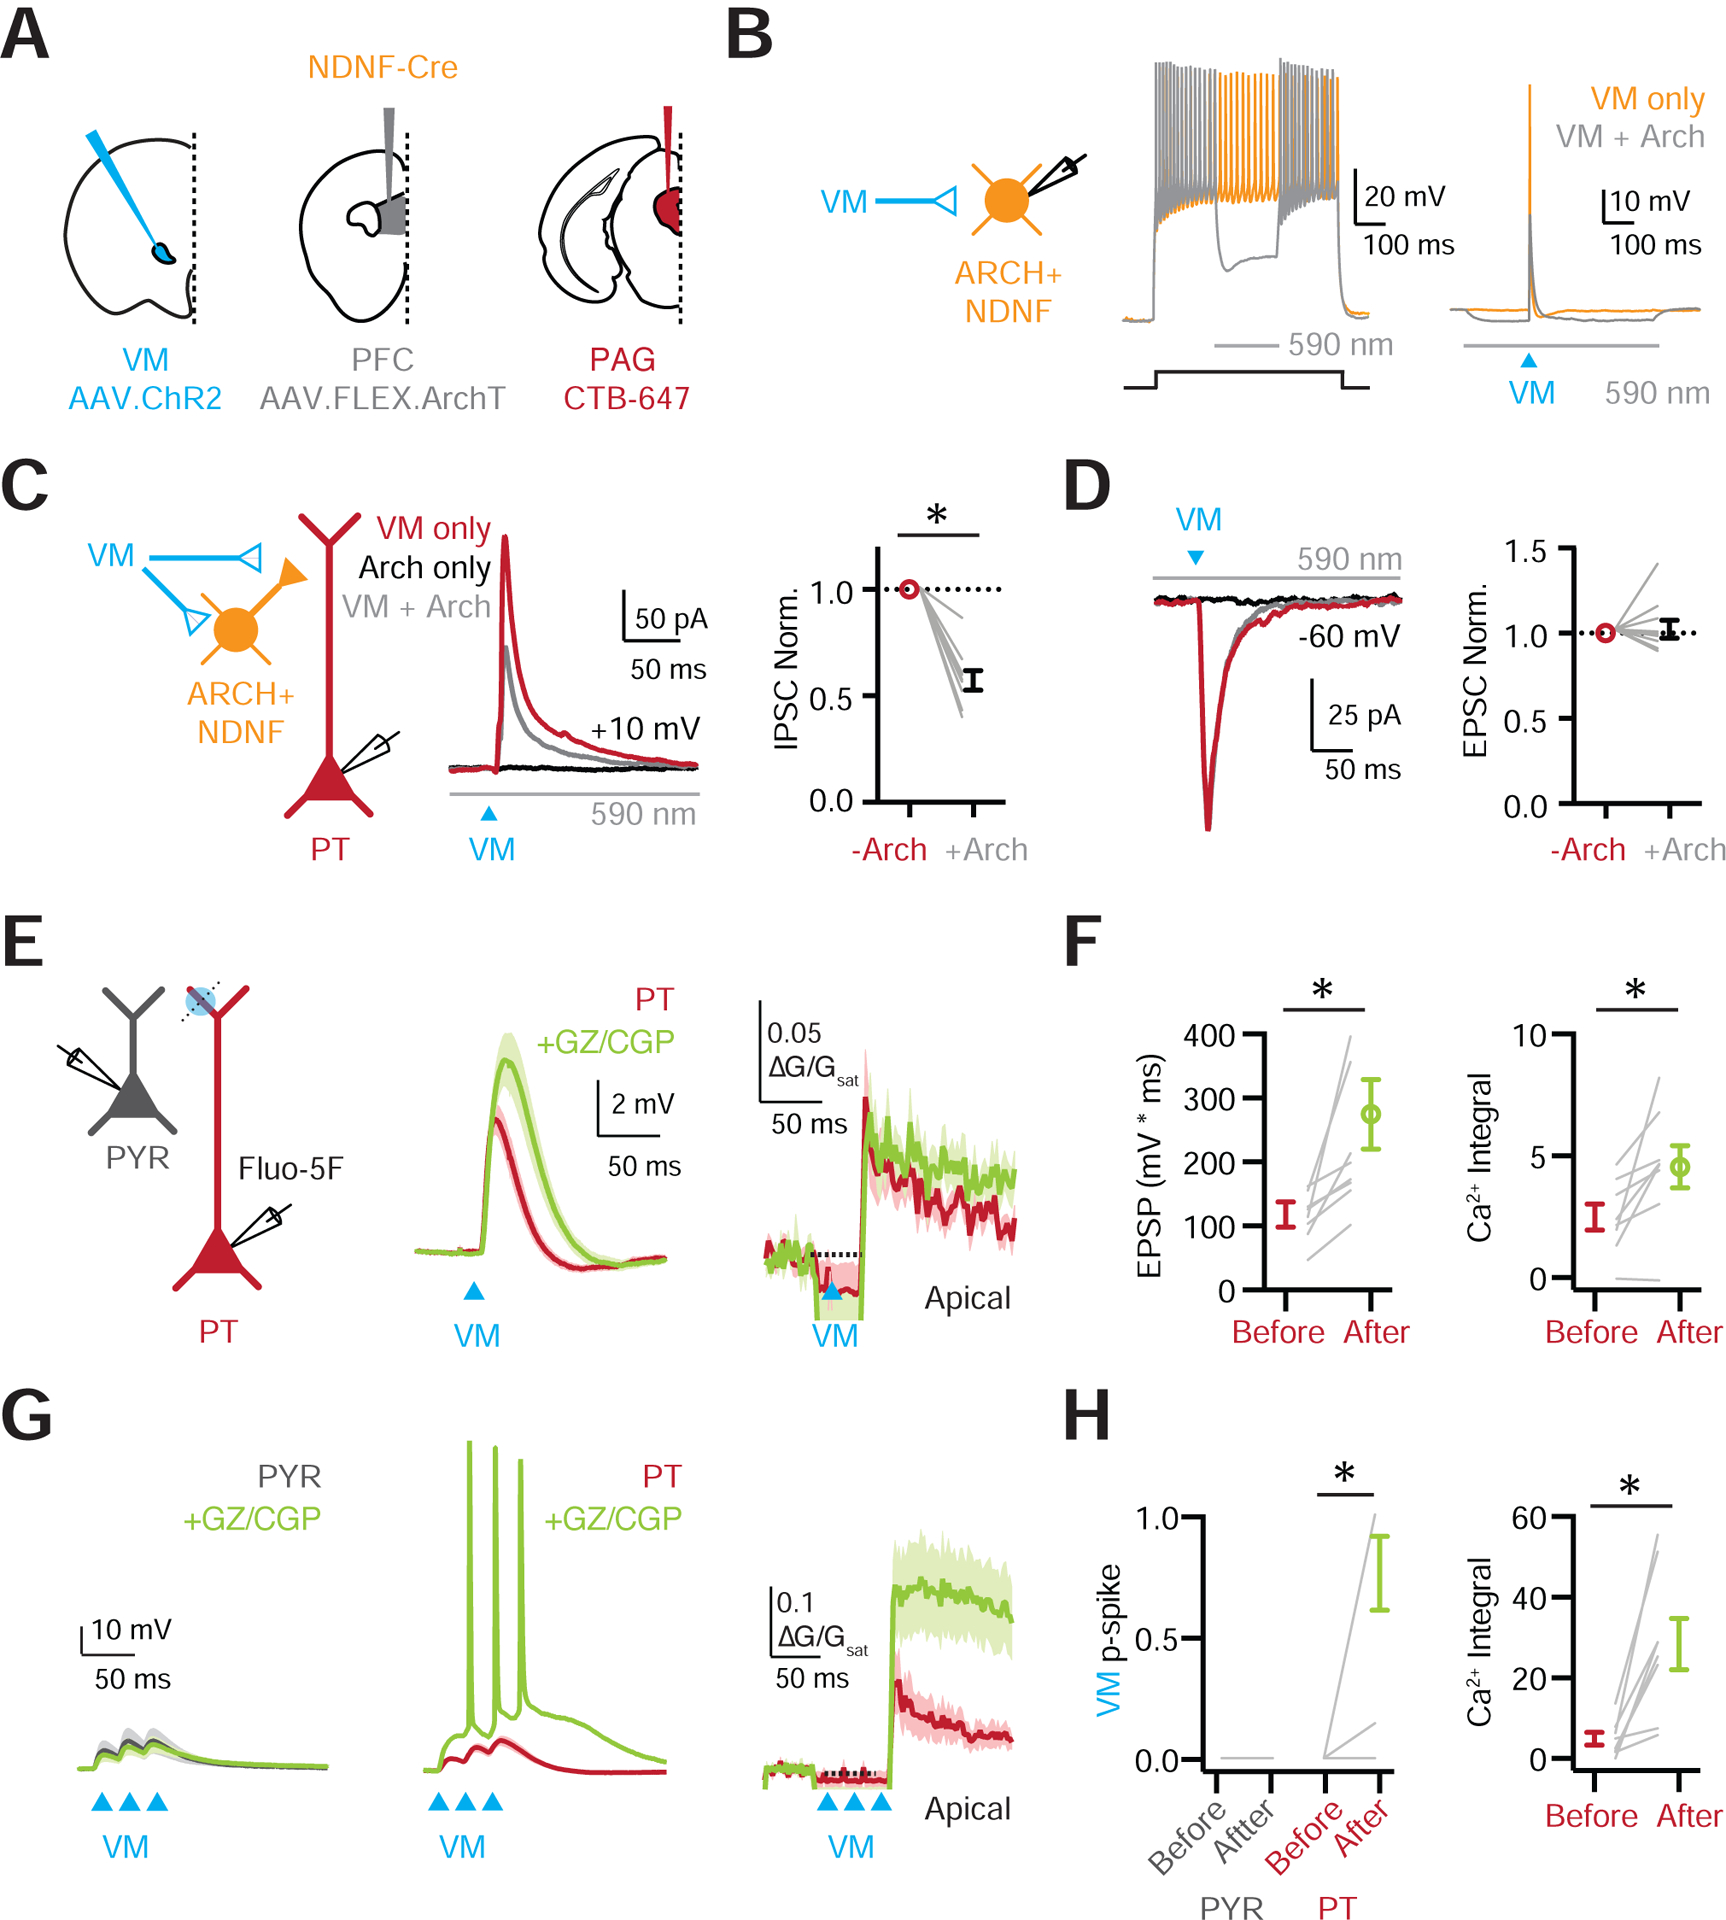
Interactions between the thalamus and prefrontal cortex (PFC) play a critical role in cognitive function and arousal. Here, we use anatomical tracing, electrophysiology, optogenetics, and 2-photon Ca2+ imaging to determine how ventromedial (VM) and mediodorsal (MD) thalamus target specific cell types and subcellular compartments in layer 1 (L1) of mouse PFC. We find thalamic inputs make distinct connections in L1, where VM engages neuron-derived neurotrophic factor (NDNF+) cells in L1a and MD drives vasoactive intestinal peptide (VIP+) cells in L1b. These separate populations of L1 interneurons participate in different inhibitory networks in superficial layers by targeting either parvalbumin (PV+) or somatostatin (SOM+) interneurons. NDNF+ cells also inhibit the apical dendrites of L5 pyramidal tract (PT) cells to suppress action potential (AP)-evoked Ca2+ signals. Lastly, NDNF+ cells mediate a unique form of thalamus-evoked inhibition at PT cells, selectively blocking VM-evoked dendritic Ca2+ spikes. Together, our findings reveal how two thalamic nuclei differentially communicate with the PFC through distinct L1 micro-circuits.

Keywords: Ca2+ Signals; Circuits; Cortex; Dendrites; Inhibition; Interneurons; Layer 1; Prefrontal; Projection Neurons; Thalamus.


Conflict of interest statement

Declaration of Interests The authors declare no competing interests.

Figures

Figure 1.
Figure 1.. Thalamic axon and cortical interneurons define two L1 sublayers.
(A) Left: Schematic of AAV-XFP (either AAV-EGFP or AAV-mCherry) injections into the ventromedial (VM) and mediodorsal (MD) thalamus. Right: Representative images of superficial layers of PFC, showing VM axon (blue), MD axon (green), and merge with DAPI (grayscale). Scale bars = 25 μm. (B) Left: Summary of axon density for VM (blue) and MD (green) as a function of L1 depth (0% is pial surface). Lines are normalized axon density plots from individual slices. Right: Summary of L1 depth at which MD and VM axon density peaks. (C) Left: Schematic of AAV-FLEX-XFP injection into the PFC of NDNF-Cre, VIP-Cre or 5HT3aR-Cre mice. Right: Representative images of superficial layers of PFC, showing labeled NDNF+, VIP+ and 5HT3aR+ interneurons. Scale bars = 50 μm. (D) Left: Summary of cumulative frequency of interneurons as a function of L1 depth. Right: Relative cell density for NDNF+, VIP+ and 5HT3aR+ interneurons in L1a and L1b. (E) Biocytin-recovered morphologies of VIP+, NDNF+ and VIP− cells in L1 of PFC. Scale bars = 50 μm. (F) Representative AP firing of L1 interneurons: VIP+ non-fast-spiking (NFS) cell, NDNF+ late-spiking (LS) cell and VIP- LS cell. Dark trace is threshold spike. (G) Summary of intrinsic properties of L1 interneurons, showing delay to threshold spike (top left) membrane time constant, Tau (top right), input resistance (Rin, bottom left) and Rheobase (bottom right). Data points are individual cells. Averages are mean ± SEM. * = p < 0.05. See also Figure S1
Figure 2.
Figure 2.. Brain-wide input to NDNF+ and VIP+ cells via transsynaptic rabies tracing.
(A) Left: Schematic of AAV-Flex-oG and AAV-Flex-TVA-mCherry injection into PFC of NDNF-Cre or VIP-Cre mice, followed 5 weeks later by EnvA-RV-GFP. Right: AAV-helper virus-infected cells in L1 of prelimbic PFC are labeled in red. Presynaptic cells are labeled in green. NDNF+ and VIP+ starter cells are labeled in yellow and indicated by arrows. Scale bar = 50 μm. (B) Left: Representative images of GFP+ presynaptic cells across layers of prelimbic PFC in NDNF-Cre or VIP-Cre mice. Right: Quantification of percentage of GFP+ presynaptic cells in different layers. Dashed lines indicate layer boundaries. Scale bar = 100 μm. (C) Left: Example images of GFP+ presynaptic cells in coronal sections relative to bregma. Right: Summary distribution of GFP+ presynaptic cells along the rostro-caudal axis, with plots for individual mice (light traces) and averages (dark trace). (D) Summary of percentage of GFP+ presynaptic cells in different brain regions. Data points from individual mice are shown as colored circles. iPFC = ipsilateral PFC (PL, IL, and rostral component of dorsal ACC), Ctx = remainder of cortex (excluding iPFC), Thal = thalamus, S & P = striatum and pallidum, Hipp = hippocampus, Amyg = amygdala, Cla = claustrum. (E) Summary of percentage of thalamic GFP+ presynaptic cells in different nuclei, including MD and VM. Data points from individual mice are shown as colored circles. (F) Left: Example images of GFP+ presynaptic cells in the thalamus of NDNF-Cre (top) and VIP-Cre (bottom) mice. Middle: Location of individual cells from NDNF-Cre mice, mapped onto thalamic nuclei using the Allen brain atlas (slice 65, www.brain-map.org), where MD (green) and VM (blue) are highlighted. Right: Similar for VIP-Cre mice. Scale bar = 200 μm. (G) Ratio of GFP+ presynaptic neurons found in MD and VM for NDNF-Cre and VIP-Cre mice. Averages are mean ± SEM (B, D, E) or geometric mean ± 95% CI (G). * = p < 0.05. See also Figures S2 & S3 and Tables S1 & S2
Figure 3.
Figure 3.. MD and VM differentially recruit interneuron populations in L1a and L1b.
(A) Left: Schematic for recordings of VM (top) and MD (bottom) inputs onto pairs of VIP− (equivalent to NDNF+) cells in L1a (orange) and VIP+ cells in L1b (red). Right: Average voltage-clamp recordings at −60 mV showing VM-evoked (blue triangles) and MD-evoked (green triangles) EPSCs at pairs of L1 interneurons. (B) Summary of VM-evoked (top) and MD-evoked (bottom) EPSC amplitudes versus pulse number at pairs of L1 interneurons. (C) Summary of (VIP− / VIP+) input ratio for first VM-evoked (blue) and MD-evoked (green) EPSC amplitude at pairs of L1 interneurons. Note the logarithmic axis. (D) Summary of paired-pulse ratio (PPR) for VM-evoked (solid lines) and MD-evoked (dashed lines) EPSCs at VIP− and VIP+ cells. (E) Top: Similar to (A) for VM-evoked (top) and MD-evoked (bottom) EPSPs and APs at pairs of VIP− (left) and VIP+ (right) cells in response to stimulus trains (triangles), evoked from resting membrane potential. Traces shown from representative pairs of neurons, where each panel shows five traces recorded from the same cell. (F) Similar to (B) for AP probability (p-spike) for VM (top) and MD (bottom) stimulation. (G) Summary of maximum VM-evoked (top) and MD-evoked (bottom) p-spike at pairs of L1 interneurons across a stimulus train. Lines represent individual pairs. Averages are mean ± SEM (B, F, G) or geometric mean ± 95% CI (C). * = p < 0.05.
Figure 4.
Figure 4.. L1 interneurons mediate distinct inhibitory and disinhibitory pathways.
(A) Left: Schematic for studying outputs of VIP+ cells (red) onto pyramidal (PYR, black), PV+ (G42, green) and SOM+ (GIN, purple) cells in L2/3 of PFC. AAV expressing Cre-dependent ChR2 was injected into the PFC of VIP-Cre × G42 or VIP-Cre × GIN mice. Right: Voltage-clamp recordings at +10 mV showing VIP+ inputs to postsynaptic targets. Light traces are individual cells and dark traces are averages. Triangles show light stimulation. (B) Similar to (A) but for NDNF+ connections (orange). (C) Left: Summary of VIP+-evoked IPSC amplitude. Right: Summary of NDNF+-evoked IPSC amplitude. (D) Left: Summary of IPSC decay kinetics for NDNF+ → PYR, NDNF+ → PV+ and VIP+ → SOM+ connections. Right: Summary of IPSC time to peak for NDNF+ → PYR, NDNF+ → PV+ and VIP+ → SOM+ connections. (E) Left: Schematic for studying outputs from NDNF+ (orange) and VIP+ (red) cells. Right: Current-clamp recordings at −50 mV before and after bath application of the GABAB-R antagonist CGP. Triangles show light stimulation. (F) Left: Summary of the IPSP time to peak for fast NDNF- and VIP-mediated IPSPs for NDNF+ → PYR, NDNF+ → PV+ and VIP+ → SOM+ connections. Right: Similar but for slow NDNF-mediated IPSPs for NDNF+ → PYR and NDNF+ → PV+ connections. Values are mean ± SEM (C, D, F). * = p < 0.05. See alsoFigure S4
Figure 5.
Figure 5.. NDNF+ cell targeting of cortical pyramidal neuron subtypes.
(A) Left: Schematic for studying outputs from NDNF+ cells (orange) onto PYR (black), IT (blue) and PT (red) cells. Right: Voltage-clamp recordings at +10 mV showing NDNF-evoked IPSCs at the three different cell types. Light traces are individual cells and dark traces are averages. Triangles show light stimulation. (B) Summary of IPSC amplitude ratios from recorded triplets, calculated by dividing the IPSC amplitude recorded in PT cells by the IPSC amplitude recorded in either PYR or IT cells. Note the logarithmic axis. (C) Top left: Recording schematic, showing grid of light spots. Top right: Representative examples of light-evoked action potentials (APs) recorded in cell-attached mode from an NDNF+ st-ChroME+ cell stimulating over the soma. Blue bar shows light stimulation. Bottom: Summary of the number of light-evoked APs per pixel as a function of distance from the soma for all NDNF+ st-ChroME+ cells recorded in cell-attached mode. (D) Left: Recording schematic, showing grid of light spots. Middle: Normalized maps of NDNF-evoked IPSCs at PT cells, indicating location of presynaptic cells. Triangles show soma depth of recorded cells. Individual pixels are 75 × 75 μm. Right: Representative examples of NDNF-evoked IPSCs recorded in voltage-clamp at +10 mV across different layers. Light traces are individual trials and dark traces are averages. Blue bar shows light stimulation. (E) Left: Summary of IPSC amplitude per pixel calculated by dividing the total current (in pA) per layer by the number of pixels, showing relative input strength across different layers for maps of NDNF+ connections onto PT cells. Right: Similar for VIP+ connections onto L2/3 SOM+ cells. (F) Summary of L1a / L1b input ratio for VIP+ → SOM+ and NDNF+ → PT connectivity maps. Values are mean ± SEM (C, E) or geometric mean ± 95% CI (B, F). * = p < 0.05. See also Figure S5
Figure 6.
Figure 6.. NDNF+ interneurons control apical dendrite electrogenesis.
(A) Morphological reconstructions of PT and IT cells, each showing 6 overlaid cells. (B) Left: Recording schematic, showing grid of light spots. Middle: Normalized sCRACM for NDNF-evoked IPSCs onto PT cells, recorded at +10 mV in the presence of TTX and 4-AP, indicating synapse location. Triangles show soma depth of recorded cells. Individual pixels are 75 × 75 μm. Right: Representative examples of NDNF-evoked IPSCs at the different layers. Light traces are individual trials and dark traces are averages. Blue bar shows light stimulation. (C) Summary of normalized NDNF-evoked IPSC amplitude as a function of distance to the pial surface for PT and IT cells. (D) Left: Schematic of whole-cell recording from PT cells, 1-photon NDNF+ stimulation (blue circles), and 2-photon line-scans (dashed lines). Middle: Somatic action potentials (3 × 100Hz) paired with NDNF+ input to either the apical or basal dendrites. Grey box indicates the region of interest for ADP analysis. Right: Summary of reduction in ADP due to stimulation at the apical but not basal dendrites of PT and IT cells. (E) Left: Corresponding AP-evoked Ca2+ signals in the apical and basal dendrites, in control conditions (black) or paired with NDNF+ stimulation (red). Right: Summary of reduction in AP-evoked Ca2+ signals due to stimulation at apical but not basal dendrites of PT and IT cells. Values are mean ± SEM (C, D, E). * = p < 0.05. See also Figure S6
Figure 7.
Figure 7.. VM input drives apical dendrite electrogenesis in L5 PT cells.
(A) Left: Recording schematic, showing grid of light spots. Middle: Normalized sCRACM for VM-evoked EPSCs onto PT cells, recorded at −70 mV in the presence of TTX and 4-AP, indicating synapses in dendrites. Triangles show soma depth of recorded cells. Individual pixels are 75 × 75 μm. Right: Representative examples of VM-evoked EPSCs at individual layers. Light traces are individual traces and dark traces are averages. Blue bar shows light stimulation. (B) Summary of normalized VM-evoked EPSC amplitude as a function of distance from the pial surface for PT (red) and IT (blue) cells. (C) Left: Subtracted (PT – IT) connectivity maps. Right: Examples of VM-evoked EPSCs at different layers from a pair of PT (red) and IT (blue) cells. Examples are individual (light traces) and average response (dark traces). Blue bar shows light stimulation. (D) Left: Schematic of recordings from PYR (grey) and PT (red) cells, 1-photon VM stimulation (blue circles), and 2-photon line scans (dashed lines). Middle: VM-evoked EPSPs at PYR (grey) and PT (red) cells, along with no stimulation (black). Right: Corresponding VM-evoked Ca2+ signals in the apical and basal dendrites of PT cells. (E) Similar to (D) for IT cells. (F) Summary of peak VM-evoked Ca2+ signals in the dendrites of PT and IT cells. Values are mean ± SEM (B, F). * = p < 0.05. See also Figure S7
Figure 8.
Figure 8.. NDNF+ cells control PT dendritic electrogenesis and firing.
(A) Schematic of injections of AAV-ChR2 into VM, AAV-FLEX-ArchT into PFC, and CTB-647 into PAG of NDNF-Cre mice. (B) Left: Recording schematic. Middle: NDNF+ cell firing evoked by current step in the absence (orange trace) and presence (grey trace) of yellow light to activate ArchT (590 nm, 200 ms) and hyperpolarize the NDNF+ cell. Right: Similar for VM-evoked firing with blue light to activate ChR2 (473 nm). (C) Left: Recording schematic. Middle: VM-evoked IPSCs measured at +10 mV from PT cells, evoked with blue light to activate ChR2 in the absence (red) or presence (grey) of yellow light to activate ArchT, with black trace showing ArchT-only control. Right: Summary of normalized VM-evoked IPSC amplitudes, without (red) and with (grey) the activation of ArchT. (D) Similar to (C) for VM-evoked EPSCs at −60 mV, showing no effect. (E) Left: Schematic of recordings from PYR (grey) and PT cells (red), 1-photon stimulation of VM inputs (blue circles), and 2-photon line-scans (dashed lines). Middle: VM-evoked EPSPs at PT cells before (red) and after (green) wash-in of the GABA-R antagonists GZ and CGP. Right: Corresponding VM-evoked Ca2+ signals evoked in the apical dendrites before and after GABA-R antagonists. (F) Left: Summary of VM-evoked EPSP integral before and after GABA-R antagonists. Right: Similar for VM-evoked Ca2+ signals. (G) Similar to (E) for trains of VM inputs (3 × 50 Hz), also showing PYR cells (grey). (H) Left: Summary of VM-evoked firing probability in PYR (grey) and PT (red) cells before and after GABA-R antagonists. Right: Similar for VM-evoked Ca2+ signals at PT cells. Values are mean ± SEM (C, D, F, H). * = p < 0.05. See also Figure S8

References

    1. Abs E, Poorthuis RB, Apelblat D, Muhammad K, Pardi MB, Enke L, Kushinsky D, Pu D-L, Eizinger MF, Conzelmann K-K, et al. (2018). Learning-Related Plasticity in Dendrite-Targeting Layer 1 Interneurons. Neuron 100, 684–699. - PMC - PubMed
    1. Acsady L, Gorcs TJ, and Freund TF (1996). Different populations of vasoactive intestinal polypeptide-immunoreactive interneurons are specialized to control pyramidal cells or interneurons in the hippocampus. Neuroscience 73, 317–334. - PubMed
    1. Agmon A, and Connors BW (1991). Thalamocortical responses of mouse somatosensory (barrel) cortex in vitro. Neuroscience 41, 365–379. - PubMed
    1. Ährlund-Richter S, Xuan Y, Lunteren van JA, Kim H, Ortiz C, Dorocic IP, Meletis K, and Carlén M (2019). A whole-brain atlas of monosynaptic input targeting four different cell types in the medial prefrontal cortex of the mouse. Nat. Neurosci 22, 657–668. - PubMed
    1. Anastasiades PG, Marlin JJ, and Carter AG (2018a). Cell-Type Specificity of Callosally Evoked Excitation and Feedforward Inhibition in the Prefrontal Cortex. Cell Rep. 22, 679–692. - PMC - PubMed

Publication types