. 2020 Dec 10;183(6):1699-1713.e13.
doi: 10.1016/j.cell.2020.10.029. Epub 2020 Nov 13.

Tau PTM Profiles Identify Patient Heterogeneity and Stages of Alzheimer's Disease

Affiliations

Tau PTM Profiles Identify Patient Heterogeneity and Stages of Alzheimer's Disease

Hendrik Wesseling et al. Cell. .

Abstract

To elucidate the role of Tau isoforms and post-translational modification (PTM) stoichiometry in Alzheimer's disease (AD), we generated a high-resolution quantitative proteomics map of 95 PTMs on multiple isoforms of Tau isolated from postmortem human tissue from 49 AD and 42 control subjects. Although Tau PTM maps reveal heterogeneity across subjects, a subset of PTMs display high occupancy and frequency for AD, suggesting importance in disease. Unsupervised analyses indicate that PTMs occur in an ordered manner, leading to Tau aggregation. The processive addition and minimal set of PTMs associated with seeding activity was further defined by analysis of size-fractionated Tau. To summarize, features in the Tau protein critical for disease intervention at different stages of disease are identified, including enrichment of 0N and 4R isoforms, underrepresentation of the C terminus, an increase in negative charge in the proline-rich region (PRR), and a decrease in positive charge in the microtubule binding domain (MBD).

Keywords: FLEXITau; absolute quantification; disease progression; multiple reaction monitoring (MRM); post-translational modifications; prion-like molecules; protein aggregation; proteomics; proteopathy; quantitative mass spectrometry.


Conflict of interest statement

Declaration of Interests B.T.H. is a member of the SAB and owns shares in Dewpoint. He also serves on an advisory panel for Biogen, and his laboratory has current research funding from AbbVie. His wife is an employee and shareholder of Novartis.

Figures
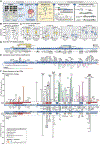
Figure 1.
Figure 1.. Molecular Characterization of the Isoform Distribution and PTMs of Sarkosyl-Soluble and Insoluble Tau Extracted from Postmortem Angular Gyrus (BA39) Tissues from AD and Healthy Controls
(A) Schematic overview of the study and workflow. (B) Total absolute insoluble Tau abundance, quantified by FLEXITau, is significantly higher in AD than in controls (t test) whereas the soluble Tau counterpart islower in AD than in controls (t test). (C) Isoform composition of sarkosyl-insoluble Tau from human angular gyrus tissue shows that pathogenic Tau aggregates are predominately composed of the 0N and 1N isoforms (yellow boxplot) and 4R isoform (blue boxplot) across the Tauopathy disease spectrum, whereas 1N and 4R are the predominant forms in the sarkosyl-soluble fraction. Peptides were quantified using heavy-isotope-labeled, isoform-specific peptides, and ANOVA (Kruskal-Wallis) was performed, using Dunn’s test for multiple comparisons. Fold changes were calculated based on the mean of the concentrations measured. (D) An overview of peptide coordinates of Tau, including isoform-specific peptides measured in the targeted quantitative FLEXITau assays. Isoform-specific regions are shown in yellow and blue. Amino acid positions for peptides are projected onto the 2N4R sequence of Tau in parentheses. (E) Cumulative PTM map of all MS-analyzed Tau species (soluble, insoluble, LMW, HMW, and MC1-isolated Tau) extracted from AD brain tissue (BA39 and BA46). (F) The patient frequencies of PTMs from the N to the C terminus of Tau show a wide range of frequencies from 2%–90% for AD. Some high-frequency sites are known AD epitopes, such as the 202–205 phosphorylation site (AT8 antibody), pinpointing important PTM-specific sites. Interestingly, some of the-high frequency PTMs, particularly in the MBD, have not been described as being important for pathological Tau. Antibodies commonly used in Tau biology are annotated, and antibodies used for pathology diagnosis are depicted in brown. FLEXITau heatmaps of median peptide modification extent are overlayed with the frequency data to evaluate the stoichiometry of PTMs. ****p < 0.0001, ***p < 0.001, **p < 0.01, *p < 0.1.
Figure 2.
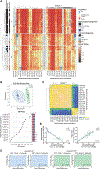
Figure 2.. The PTM Landscape of Insoluble Tau Is Heterogenous and Stratifies Subjects into Distinct Groups, Reflecting Disease Progression
(A) The left panel ranks PTMs according to the importance of the PTM in hierarchical clustering, whereas the right heatmap depicts PTMs sorted by their positions on 2N4R Tau. On the right, a legend is provided for isoforms, PTM types, pathological diagnosis, clinical diagnosis, and Braak stage. The type of PTM and isoform is color coded in the bar at the top, and the diagnosis is shown on the left. Tau PTM mapping data from shotgun MS from 49 AD patients and 42 age-matched healthy subjects were subjected to an unsupervised hierarchical clustering analysis using Jaccard binary clustering (orange, PTM identified; purple, PTM not identified). The analysis separates subjects into subgroups based on unique Tau PTM signatures comprised of multiple combinations of PTMs for each subgroup. The analysis separates subjects into 4 groups (a, b, c, and d), with c being the group with the highest Braak stage patients and a those with the lowest Braak stages. Below the left panel, we list 5 combinations of PTMs that separate the clusters into the 4 groups. (B) ANOVA analysis (Kruskal-Wallis) shows that clusters b and c have higher Tau and amyloid burdens in the angular gyrus than clusters a and d. This is significant for Tau across all clusters and for Aβ between clusters a and b. (C) PLS-DA of the modified peptide intensities from MaxQuant separates the subjects according to their pathological diagnosis and identifies 25 peptides to be the most discriminative modified peptides. The VIP plot is provided on the right and ranks these PTMs based on their importance when separating AD from control subjects across the 2 cohorts of patients studied. Red and blue squares show whether a peptide is decreased (red) or increased (blue) in the respective disease groups.
Figure 3.
Figure 3.. FLEXITau Analysis of AD Patients and Age-Matched Controls Show Heterogeneity in Quantitative Modification Profiles
(A) FLEXITau provides a measure of the extent of modification of peptides in Tau. The left panel ranks the extent of modification for each measured peptide according to the importance of the peptide in hierarchical clustering, whereas the right heatmap depicts the peptides sorted by their position on 2N4R Tau. On the right, a legend is provided for the extent of modification of each peptide, pathological diagnosis, clinical diagnosis, and Braak stage for the cohort 1 subjects (Table S1). Unsupervised Euclidian hierarchical clustering of Tau peptides was measured using FLEXITau in cohort 1 (29 AD versus 28 CTR subjects). The FLEXITau clustering analysis separates the subjects into 3 major groups (x, y, and z), with the most distinctive features being the stoichiometry of the C terminus peptide, R3–R4 in the MBD, and the PRR. (B) PLS-DA of the FLEXITau peptide modification extent separates the subjects according to their pathological diagnosis and identifies three peptides to be most discriminative (VIP score plot). Red and blue squares show whether a peptide is decreased (red) or increased (blue) in the respective disease groups. (C) Spearman correlation analysis shows that the PRR and 1N/2N-specific peptides are anti-correlated, with an increase abundance in the MBD in both cohorts. (D) Correlation plots of the correlating and anti-correlating peptides in cohort 1. The FLEXITau data reveal an increase in PTM extent in the PRR and C terminus and enrichment of the MBD in AD insoluble aggregates and provides information regarding the processivity of modifications. A similar analysis for cohort 2 is provided in Figure S4. (E) Receiver operating characteristic (ROC) curves visualizing the classification performance of a 10-fold cross-validated SGD model for predicting AD and control based on FLEXITau data. The model was trained on cohort 1 and tested on cohort 2, which resulted in an AUC of 0.934 and 0.985 for AD and control, respectively.
Figure 4.
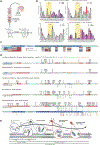
Figure 4.. Identifying PTMs Associated with Seeding Activity in Size-Fractionated Tau
A) A schematic of the workflow used to isolate soluble fractions of size-separated, seeding-competent HMW Tau oligomers and seeding-incompetent LMW Tau. (B) Comparative analysis of FLEXITau-quantified peptides listed from the N and C termini in the different fractions. (C) Median peptide modification extent calculated from quantitative FLEXITau assays obtained by targeted MS experiments. (D) Cumulative PTM maps of seeding-competent and -incompetent Tau separated by size: LMW Tau, sarkosyl-soluble Tau, oligomeric Tau (HMW), MC1-isolatedTau, and the sarkosyl-insoluble fraction containing fibrillar Tau. HMW and LMW Tau fractions were isolated by size-exclusion chromatography from the cortex of 4 control subjects and 4 AD patients. LMW Tau and soluble Tau exhibit 9 PTMs, HMW Tau oligomers exhibit 26 PTMs, and a cumulative map from sarkosylinsoluble fibrillar Tau displays 85 PTMs. (E) A schematic representation showing the size differences of Tau species from various fractions: sarkosyl-soluble, LMW, HMW, MC1 antibody isolates, andsarkosyl-insoluble.
Figure 5.
Figure 5.. Comparative Stoichiometric Tau PTM Maps in Disease and Control Patients Identify Critical PTMs and Regions Associated with Aggregation
(A) Schematic representation of sequential accumulation of different PTMs at different stages of disease. Increased phosphorylation in the PRR is followed by acetylation and ubiquitination in the MBD as the disease progresses. (B) Schematic summarizing the FLEXITau data, showing a three-step process that leads to Tau aggregation across patients. The 1N and 2N isoforms are underrepresented in all insoluble Tau. An early event that is observed is cleavage of the C terminus, and this is followed by phosphorylation of the PRR and enrichment of the MBD. Enrichment of the MBD is notable in AD patients compared to control. (C) Based on our stoichiometric PTM analysis, we posit a model for Tau fibril formation. The 0N and 4R isoforms are predisposed to aggregation. A cascade of PTMs, including C terminus cleavage, negatively charged phosphorylation in the PRR, followed by charge-neutralizing acetylation and ubiquitination in the enriched MBR are progressive steps in the process of Tau fibril formation and AD disease progression.

References

    1. Abreha MH, Dammer EB, Ping L, Zhang T, Duong DM, Gearing M, Lah JJ, Levey AI, and Seyfried NT (2018). Quantitative Analysis of the Brain Ubiquitylome in Alzheimer’s Disease. Proteomics 18, e1800108. - PMC - PubMed
    1. Adams SJ, DeTure MA, McBride M, Dickson DW, and Petrucelli L. (2010). Three repeat isoforms of tau inhibit assembly of four repeat tau filaments. PLoS ONE 5, e10810. - PMC - PubMed
    1. Aebersold R, Agar JN, Amster IJ, Baker MS, Bertozzi CR, Boja ES, Costello CE, Cravatt BF, Fenselau C, Garcia BA, et al. (2018). How many human proteoforms are there? Nat. Chem. Biol. 14, 206–214. - PMC - PubMed
    1. Alonso A, Zaidi T, Novak M, Grundke-Iqbal I, and Iqbal K. (2001). Hyper-phosphorylation induces self-assembly of tau into tangles of paired helical filaments/straight filaments. Proc. Natl. Acad. Sci. USA 98, 6923–6928. - PMC - PubMed
    1. Arendt T, Stieler JT, and Holzer M. (2016). Tau and tauopathies. Brain Res. Bull. 126, 238–292. - PubMed

Publication types