Review
. 2021 Jul:83:100919.
doi: 10.1016/j.preteyeres.2020.100919. Epub 2020 Nov 12.

Photoreceptor cells and RPE contribute to the development of diabetic retinopathy

Affiliations
Review

Photoreceptor cells and RPE contribute to the development of diabetic retinopathy

Deoye Tonade et al. Prog Retin Eye Res. 2021 Jul.

Abstract

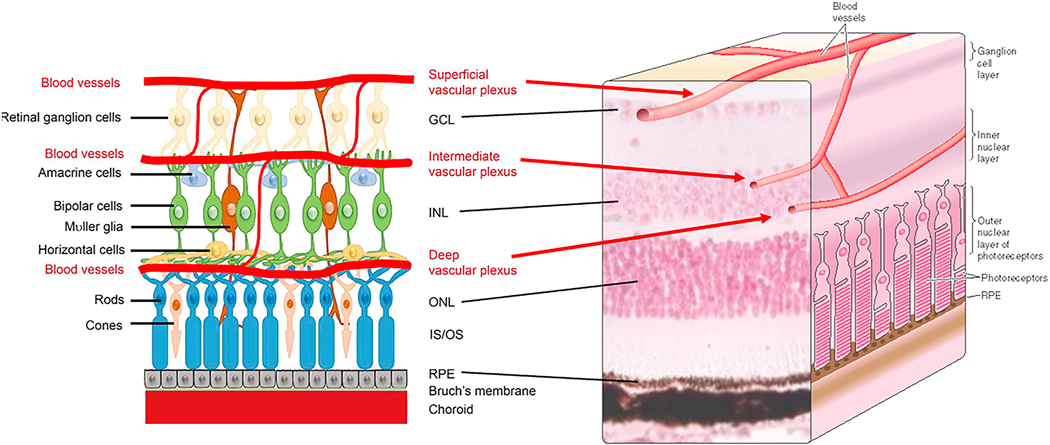
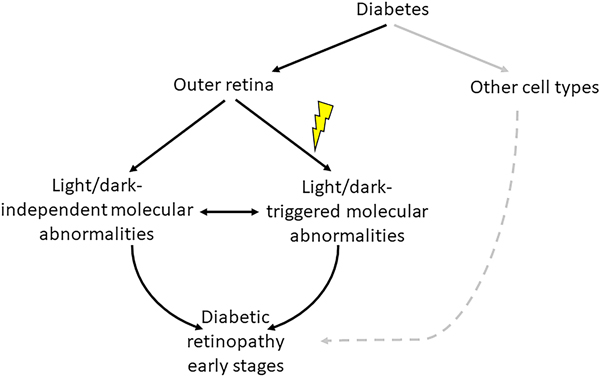
Diabetic retinopathy (DR) is a leading cause of blindness. It has long been regarded as vascular disease, but work in the past years has shown abnormalities also in the neural retina. Unfortunately, research on the vascular and neural abnormalities have remained largely separate, instead of being integrated into a comprehensive view of DR that includes both the neural and vascular components. Recent evidence suggests that the most predominant neural cell in the retina (photoreceptors) and the adjacent retinal pigment epithelium (RPE) play an important role in the development of vascular lesions characteristic of DR. This review summarizes evidence that the outer retina is altered in diabetes, and that photoreceptors and RPE contribute to retinal vascular alterations in the early stages of the retinopathy. The possible molecular mechanisms by which cells of the outer retina might contribute to retinal vascular damage in diabetes also are discussed. Diabetes-induced alterations in the outer retina represent a novel therapeutic target to inhibit DR.

Keywords: Diabetes; Diabetic retinopathy; Outer retina; Photoreceptors; Phototransduction; RPE; Vasculature; Visual cycle.


Figures

Fig 1.
Fig 1.
Drawing of retinal architecture and the relation of the retinal vasculature to retinal photoreceptor cells. The retina is highly organized, with nuclei in the ganglion cell layer, inner nuclear layer and outer nuclear layer appearing in discrete layers. Between these nuclear layers are plexiform layers where processes from neural and glial cell-types intermix. Outer segments of the retinal photoreceptors interdigitate with the retinal pigment epithelium (RPE) to maintain the visual cycle and vision. The vasculature supplying the retina comes from two different sides, with the photoreceptors supplied by choroidal vessels below the retina, and the inner retina supplied by vascular networks within the inner retinas. Retinal microvessels do not directly interact with photoreceptor cells. Drawing of retina showing neural cells and the 3 layers of the retinal vasculature (left side of figure) is reproduced from Z. Fu et al, International Journal of Molecular Sciences 2020, 21, 1503 under the terms of the Creative Commons Attribution 4.0 International License (http://creativecommons.org/licenses/by/4.0/), which permits unrestricted use, distribution, and reproduction in any medium.
Fig 2.
Fig 2.
Methods currently used to assess retinal morphology, including the outer retina. (a) Retinal cross-section (hematoxylin and eosin stained retina); (b) optical coherence tomography (OCT) showing various retinal layers (ILM, Inner Limiting membrane; ONL, Outer Nuclear membrane; BM, Bruch’s membrane; RPE, retinal pigment epithelium); (c) color fundus photography (optic nervehead is indicated by O.N.; retinal vasculature is indicated by arrows; exudates are seen to the left of the fovea (yellow dashed circle)); (d) 2-photon microscopy with adaptive optics to generate a 3-dimensional picture of the retina/RPE interface in wildtype mice after intravitreal injection with peanut agglutinin tagged with rhodamine. RPE is at the top of the image at z=0 μm, cone synaptic terminals are at the bottom, around z=80 μm. A macrophage, just under the RPE and around 30 μm in diameter, is indicated with yellow arrow. Cone outer segments are indicated with blue arrows and cone inner segments are indicated with red arrows.
Fig 3.
Fig 3.
Reduction in number of S-cones in retinas from diabetic patients. Enzyme histochemical reaction for carbonic anhydrase produces a black reaction product which labels L/M-cones, but not S-cones (arrows) or rods. Figs a and b are from the photoreceptor layer of the retina. Compared to nondiabetic patients (a), retinas from diabetic patients have a relative absence of carbonic anhydrase-negative S-cones (b). A summary of the density of (c) S-cones and (d) L/M cones at various retinal eccentricities shows significantly lower mean S-cone density at most eccentricities in diabetic patients compared to nondiabetic controls. Asterisks (*) indicate that differences in means are significant different between diabetic and nondiabetic patients. This figure is modified from figures 9, 12 and 13 in an article entitled, “Acquired color vision loss and a possible mechanism of ganglion cell death in glaucoma” in the Trans Am Ophthalmol Soc 2000;98: 331–63, and is republished with permission of the American Ophthalmological Society.
Fig 4.
Fig 4.
Diabetes increases oxidative stress in the outer retina of diabetic rodents. (a) Oxidative stress was detected particularly in inner/outer segments of retinal photoreceptor cells of mice diabetic for 2 months compared to age-matched nondiabetic mice. Oxidative stress was detected in cryosections stained with dichlorofluorescein, with green indicates sites of oxidative stress, and blue staining of nuclei stained (DAPI). Retinal layers are indicated by abbreviations between the two figures. (b) Diabetes (D) of 2 months duration also decreased retinal activity of superoxide dismutase compared to that in nondiabetic (N) rats, and this decrease was inhibited by dietary supplementation with antioxidants. (c) Continuously produced paramagnetic free radicals from the outer retina measured in vivo using high-resolution 1/T1 magnetic resonance imaging (MRI) shows that only the outer retinal 1/T1 values from diabetic animals were significantly greater than normal, and were corrected to baseline with antioxidant therapy. Fig 4b reproduces a portion of Fig 2 in Free Radic Biol Med, Vol 26, Kowluru RA, Engerman RL, Kern TS, 1999. Abnormalities of retinal metabolism in diabetes or experimental galactosemia. VI. Comparison of retinal and cerebral cortex metabolism, and effects of antioxidant therapy. Pages 371–378,1999, with permission from Elsevier. Fig 4c was reprinted with permission from Berkowitz BA, Bredell BX, Davis C, Samardzija M, Grimm C, Roberts R. Measuring In Vivo Free Radical Production by the Outer Retina. Invest Ophthalmol Vis Sci. 2015;56:7931–7938. © 2015 ARVO.
Fig 5.
Fig 5.
Diabetes impairs rod cell function as assessed by ERG. Figure (a) illustrates how latency and amplitude (La and a, respectively) of the a-wave, as well as latency and amplitude (Lb and b respectively) of the b-wave of the ERG are determined. Figure (b) illustrates that diabetes significantly slows a-wave implicit time in diabetic patients (n=58) compared to nondiabetic patients (n=21). (a) is reproduced from Perlman, Ido. “The Electroretinogram: ERG ”. Webvision. Moran Eye Center, January 25, 2012. Web. June 10, 2020. http://webvision.med.utah.edu/book/Part XI: Electrophysiology /The Electroretinogram: ERG/ under a Attribution, Noncommercial 4.0 International (CC BY-NC) Creative Commons license. Fig 5b is drawn from data reported in (Bresnick and Palta, 1987).
Fig 6.
Fig 6.
Methods used to assess the retinal vasculature. (a) fluorescein angiogram, (b) optical coherence tomography-angiography (OCT-A), (c) trypsin digest preparation. In (a), optic nervehead is indicated by O.N., retinal arterioles (thinner arrows) and venules (thicker arrows) are indicated by yellow arrows, fovea is indicated by yellow dashed circle, and numerous microaneurysms are indicated by small fluorescent dots (thin white arrows). In (b), the yellow dashed circle outlines the fovea. Erythrocyte flow is indicated as white lines in this static image. There are no microvessels within the fovea. Red circles demonstrate microaneurysms, and yellow arrows point out areas of capillary nonperfusion in a diabetic patient. In isolated microvessels (c), endothelial cell nuclei (e; red arrows) are oval shape, whereas pericytes (p; black arrows) are darkly stained and protrude out from the vascular profile. Degenerated retinal capillaries (thick yellow arrows) occur in both nondiabetic and diabetic animals and humans, but are more numerous in diabetics.
Fig 7.
Fig 7.
Two lines of evidence indicate that retinal photoreceptor cells play a role in retinal capillary degeneration. First, molecular alterations that are unique to retinal photoreceptor cells (deletion of opsin (opsin−/−) or knock-in of the P23H mutant opsin (RhoP23H/P23H)) led to the degeneration of retinal capillaries in nondiabetic animals. Second, the diabetes-induced degeneration of retinal capillaries was inhibited if induction of diabetes was delayed until after photoreceptors had degenerated in these models. (a) summarizes retinal capillary degeneration in nondiabetic (N) and diabetic (D) wildtype (wt), opsin−/− and RhoP23H/P23H mice (10 months of age, 8 months of diabetes). (b) shows representative preparations of the isolated retinal vasculature from each of the experimental groups. Arrows illustrate representative degenerate capillaries. Data summarized in (c) show that retinal capillaries actively degenerate in young opsin−/− nondiabetic mice while photoreceptors are present but degenerating due to the opsin deficiency (up to approx. 14 weeks of age), but then the capillary degeneration slows substantially after the photoreceptors have degenerated (after 14 weeks of age). Reprinted from Liu H, Tang J, Du Y, et al. Photoreceptor Cells Influence Retinal Vascular Degeneration in Mouse Models of Retinal Degeneration and Diabetes. Invest Ophthalmol Vis Sci 2016;57:4272–4281. © The Authors. Licensed under a CC BY-NC-ND license.
Fig 8.
Fig 8.
Ocular ischemia-reperfusion injury (IR) increases retinal vascular permeability in normal mice, and this increase is significantly (but partially) inhibited in the absence of visual cycle activity (due to knockout of Lrat (a) or the absence of light (b)). *< 0.05, **< 0.01, ***< 0.001, or ****< 0.0001 Reprinted from Figs 2c and 3c in Dreffs A, Lin CM, Liu X, et al. All-trans-Retinaldehyde Contributes to Retinal Vascular Permeability in Ischemia Reperfusion. Invest Ophthalmol Vis Sci. 2020;61(6):8. © The Authors. Licensed under a CC BY-NC-ND license.
Fig 9.
Fig 9.
Phototransduction and its role in the development of early stages of diabetic retinopathy. (a) Absorption of a photon of light by rhodopsin results in photoisomerization of the chromophore to all-trans-retinal, which leads to transduction of this signal to cGMP-gated ion channels on photoreceptor cells. Deletion of Gnat1, the gene responsible for expression of transducin1 in rod cells, prevents phototransduction in those photoreceptor cells. Deletion of Gnat1 in diabetic mice did not inhibit the diabetes-induced increase in (b) retinal superoxide, but did significantly inhibit the (c) degeneration of retinal capillaries in mice diabetic for 8 months. This inhibition of phototransduction had variable effects on permeability, significantly inhibiting the leakage of albumin into the neural retina in the inner plexiform layer (c), but not significantly inhibiting it in the outer plexiform layer (d). (N; nondiabetic mice, WT, wildtype mice). Figures (b) and (c) are reprinted from Liu H, Tang J, Du Y, et al. Transducin1, Phototransduction and the Development of Early Diabetic Retinopathy. Invest Ophthalmol Vis Sci. 2019;60:1538–1546. © The Authors. Licensed under a CC BY-NC-ND license.
Fig 10.
Fig 10.
Visual cycle and its role in the development of early stages of diabetic retinopathy. (a) The visual cycle refers to the steps to regenerate 11-cis retinal after photoisomerization to all-trans-retinal. Rod photoreceptor cells depend on the output of 11-cis-retinal from adjacent RPE cells, and activity of RPE65 in RPE cells is a critical step in this process. (b) Deletion of RPE65 inhibited the diabetes-induced degeneration of retinal capillaries compared to that in wild type control mice diabetic for ~6 months. Likewise, daily administration of the RPE65 inhibitor, retinylamine (Ret-NH2), to diabetic (D) mice for 8 months inhibited the (c) degeneration of retinal capillaries and (d) leakage of albumin into the neural retina in mice compared to age-matched nondiabetic (N) controls. The leakage of albumin into the neural retina was determined by the leakage of injected FITC-BSA into the neural retina. Figure b was modified from (Thebeau et al., 2020) and available under the Creative Commons CC-BY-NC-ND license, and (c) and (d) are reprinted from (Liu et al., 2015) with permission of the American Society for Biochemistry and Molecular Biology.
Fig 11.
Fig 11.
Diabetes reduces functional activity of photoreceptors (a-wave; initial downward deflection of ERG line) and inner retina (b-wave; upward curve after a-wave), as determined by scotopic ERG using sub-maximal flashes (a, b). These studies were conducted using db/db mice, a genetic model of type 2 diabetes. After 3 months of continuous darkness, the db/db mice displayed a-wave responses across all stimulus luminances that were similar to those of nondiabetic db/m controls (b). These figures are Figs 3c and e from (Thebeau et al., 2020), and are reprinted under a Under a Creative Commons license.
Fig 12.
Fig 12.
Noninvasive application of far-red light (670 nm; 6 joules/cm2) for 4 minutes per day to diabetic (D) mice for 8 months inhibited the diabetes-induced (a) degeneration of retinal capillaries, (b) leakage of FITC-albumin into neural retina at the level of the outer plexiform layer, and reductions in (c) spatial frequency threshold and (d) contrast sensitivity. N; nondiabetic controls. Reproduced from (Cheng et al., 2017) © 2017 by the American Diabetes Association.
Fig 13.
Fig 13.
Postulated contribution of the outer retina to the development of early stages of DR. Grey lines represent areas that are outside of the topic of this review.

Similar articles

Cited by

References

    1. Ablonczy Z, Crosson CE, 2007. Vegf Modulation of Retinal Pigment Epithelium Resistance. Experimental eye research 85, 762–771. - PMC - PubMed
    1. Adams AJ, Zisman F, Ai E, Bresnick G, 1987. Macular Edema Reduces B Cone Sensitivity in Diabetics. Applied optics 26, 1455–1457. - PubMed
    1. Adamus G, Wang S, Kyger M, Worley A, Lu B, Burrows GG, 2012. Systemic Immunotherapy Delays Photoreceptor Cell Loss and Prevents Vascular Pathology in Royal College of Surgeons Rats. Molecular vision 18, 2323–2337. - PMC - PubMed
    1. Adler AJ, Southwick RE, 1992. Distribution of Glucose and Lactate in the Interphotoreceptor Matrix. Ophthalmic research 24, 243–252. - PubMed
    1. Agostinho P, Duarte CB, Oliveira CR, 1996. Activity of Ionotropic Glutamate Receptors in Retinal Cells: Effect of Ascorbate/Fe(2+)-Induced Oxidative Stress. J Neurochem 67, 1153–1163. - PubMed

Publication types