

Pediatric Heart Network Echocardiographic Z Scores: Comparison with Other Published Models
- PMID: 33189460
- PMCID: PMC7870534
- DOI: 10.1016/j.echo.2020.09.019
Pediatric Heart Network Echocardiographic Z Scores: Comparison with Other Published Models
Abstract
Background: Different methods have resulted in variable Z scores for echocardiographic measurements. Using the measurements from 3,215 healthy North American children in the Pediatric Heart Network (PHN) echocardiographic Z score database, the authors compared the PHN model with previously published Z score models.
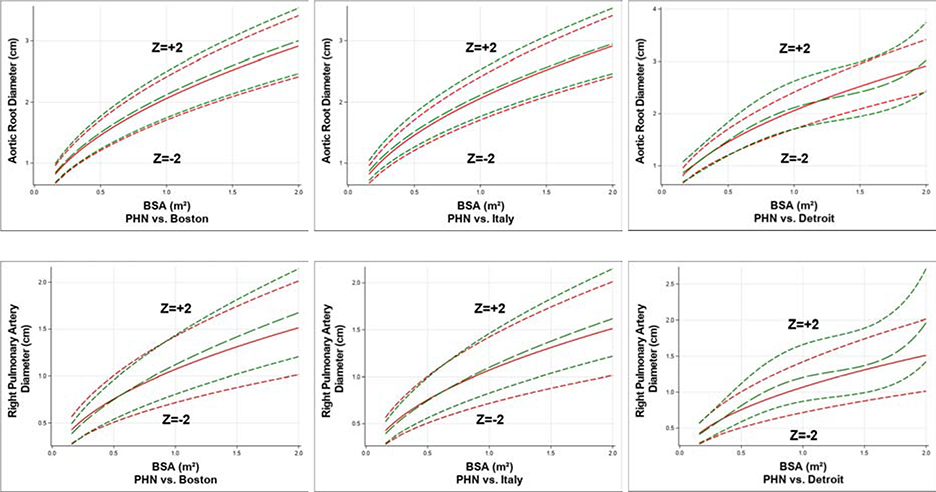
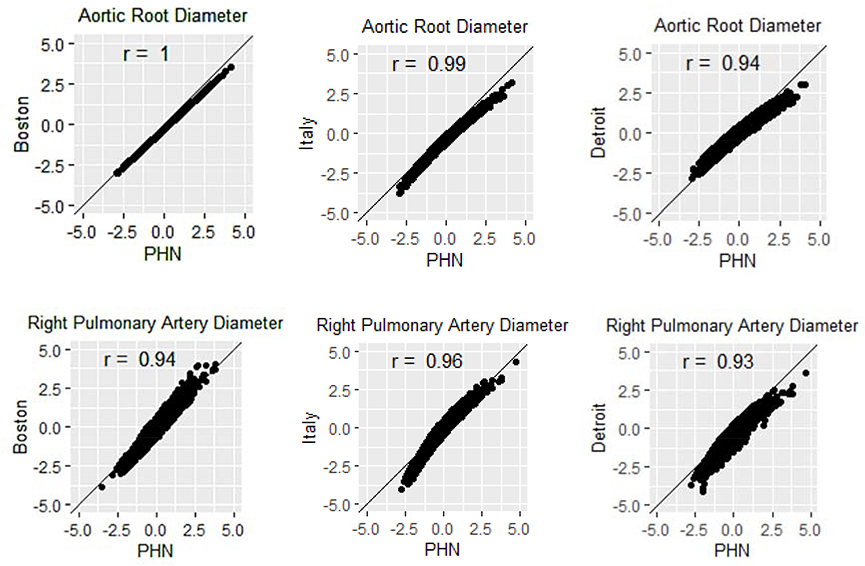
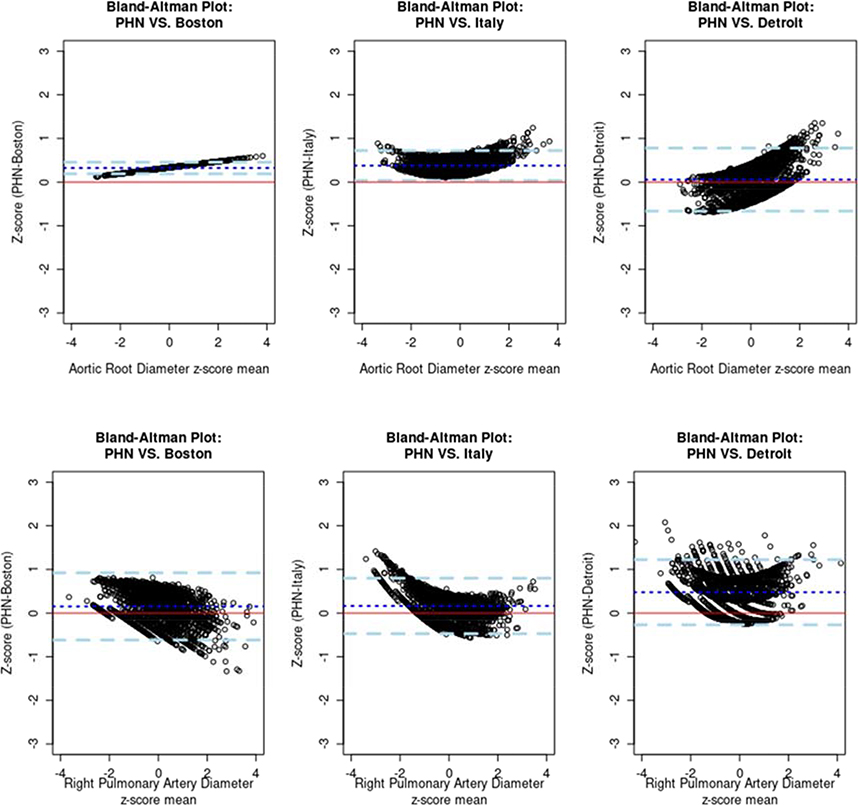
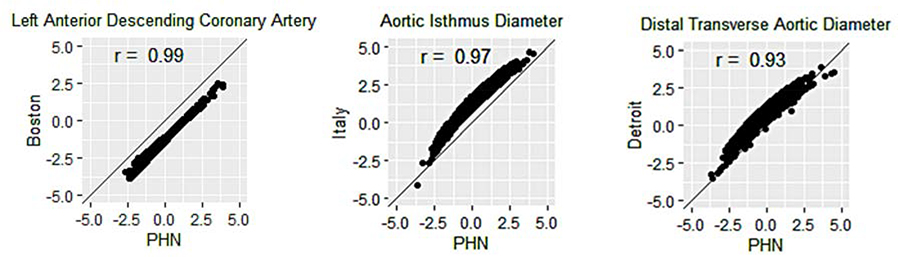
Methods: Z scores were derived for cardiovascular measurements using four models (PHN, Boston, Italy, and Detroit). Model comparisons were performed by evaluating (1) overlaid graphs of measurement versus body surface area with curves at Z = -2, 0, and +2; (2) scatterplots of PHN versus other Z scores with correlation coefficients; (3) Bland-Altman plots of PHN versus other Z scores; and (4) comparison of median Z scores for each model.
Results: For most measurements, PHN Z score curves were similar to Boston and Italian curves but diverged from Detroit curves at high body surface areas. Correlation coefficients were high when comparing the PHN model with the others, highest with Boston (mean, 0.99) and lowest with Detroit (mean, 0.90). Scatterplots suggested systematic differences despite high correlations. Bland-Altman plots also revealed poor agreement at both extremes of size and a systematic bias for most when comparing PHN against Italian and Detroit Z scores. There were statistically significant differences when comparing median Z scores between the PHN and other models.
Conclusions: Z scores from the multicenter PHN model correlated well with previous single-center models, especially the Boston model, which also had a large sample size and similar methodology. The Detroit Z scores diverged from the PHN Z scores at high body surface area, possibly because there were more subjects in this category in the PHN database. Despite excellent correlation, significant differences in Z scores between the PHN model and others were seen for many measurements. This is important when comparing publications using different models and for clinical care, particularly when Z score thresholds are used to guide diagnosis and management.
Keywords: Cardiovascular growth; Echocardiographic quantification; Z scores.
Copyright © 2020 American Society of Echocardiography. All rights reserved.
Conflict of interest statement
Declaration of interest: None.
Figures
References
-
- Lopez L, Colan S, Stylianou M, Granger S, Trachtenberg F, Frommelt P, et al. Relationship of Echocardiographic Z Scores Adjusted for Body Surface Area to Age, Sex, Race, and Ethnicity: The Pediatric Heart Network Normal Echocardiogram Database. Circ Cardiovasc Imaging 2017;10(11):e006979. doi: 10.1161/CIRCIMAGING.117.006979. - DOI - PMC - PubMed
Publication types
MeSH terms
Grants and funding
- UG1 HL135666/HL/NHLBI NIH HHS/United States
- U10 HL109818/HL/NHLBI NIH HHS/United States
- U10 HL109741/HL/NHLBI NIH HHS/United States
- UG1 HL135680/HL/NHLBI NIH HHS/United States
- UG1 HL135646/HL/NHLBI NIH HHS/United States
- U10 HL109781/HL/NHLBI NIH HHS/United States
- U01 HL068290/HL/NHLBI NIH HHS/United States
- U10 HL068270/HL/NHLBI NIH HHS/United States
- U01 HL068270/HL/NHLBI NIH HHS/United States
- U10 HL109737/HL/NHLBI NIH HHS/United States
- U10 HL109777/HL/NHLBI NIH HHS/United States
- U10 HL109778/HL/NHLBI NIH HHS/United States
- UM1 HL172717/HL/NHLBI NIH HHS/United States
- UG1 HL135685/HL/NHLBI NIH HHS/United States
- U10 HL109816/HL/NHLBI NIH HHS/United States
- UG1 HL135689/HL/NHLBI NIH HHS/United States
- U10 HL109743/HL/NHLBI NIH HHS/United States
- U10 HL109673/HL/NHLBI NIH HHS/United States
- UG1 HL135678/HL/NHLBI NIH HHS/United States
LinkOut - more resources
Full Text Sources
Other Literature Sources
