. 2021 Mar 16;120(6):1072-1084.
doi: 10.1016/j.bpj.2020.10.036. Epub 2020 Nov 13.

The flexibility of ACE2 in the context of SARS-CoV-2 infection

Affiliations

The flexibility of ACE2 in the context of SARS-CoV-2 infection

Emilia P Barros et al. Biophys J. .

Abstract

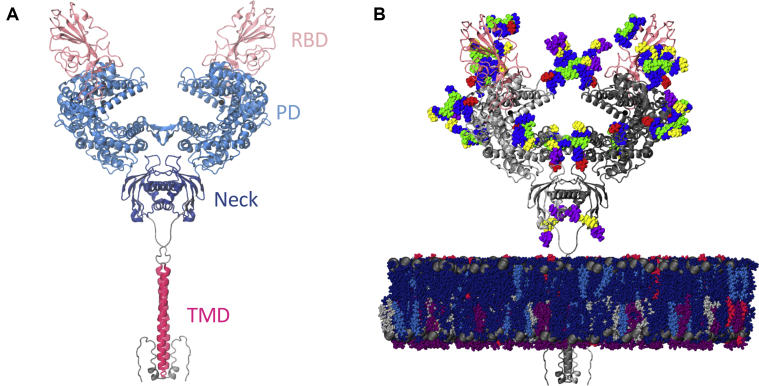
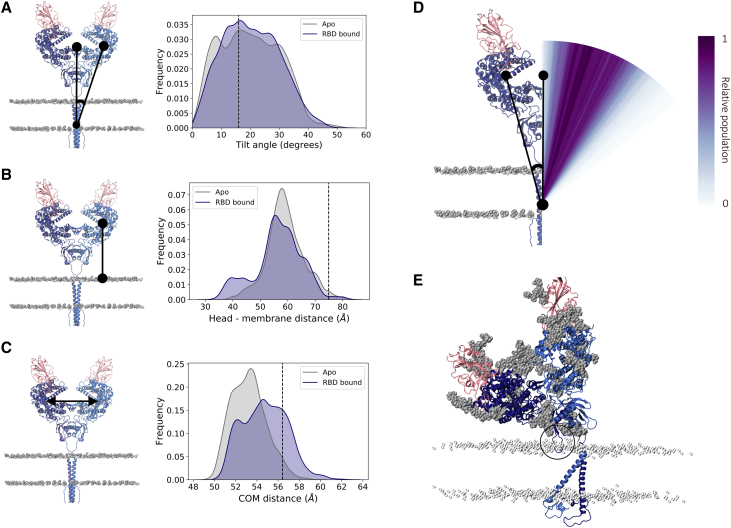
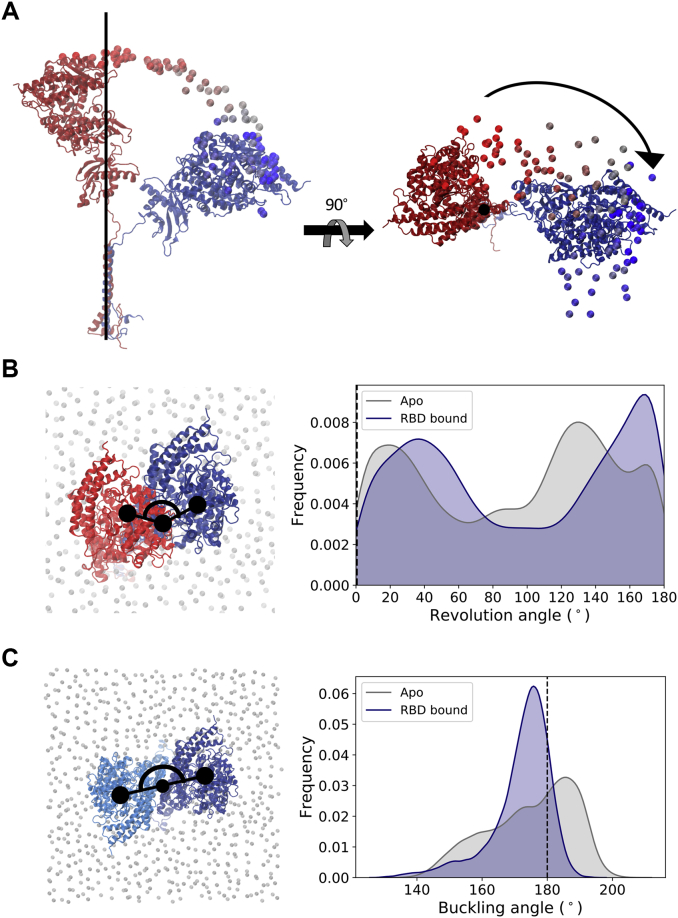
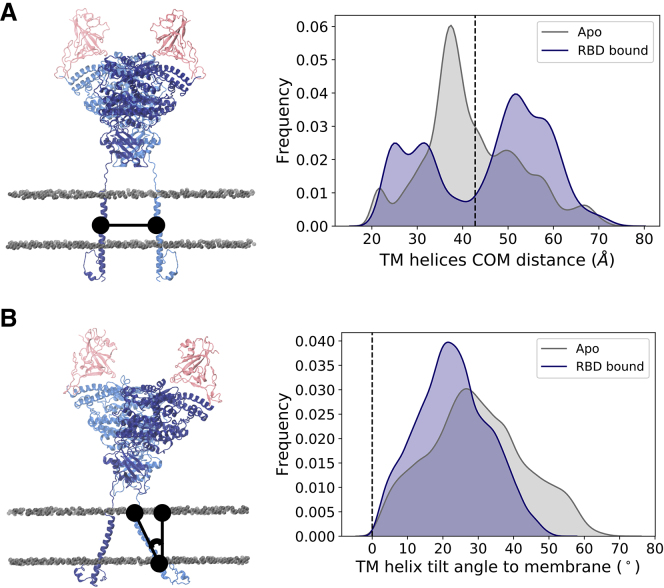
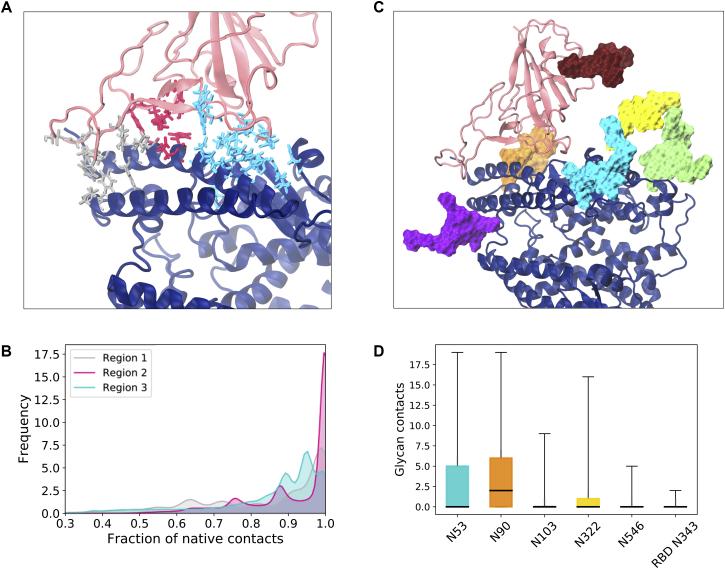
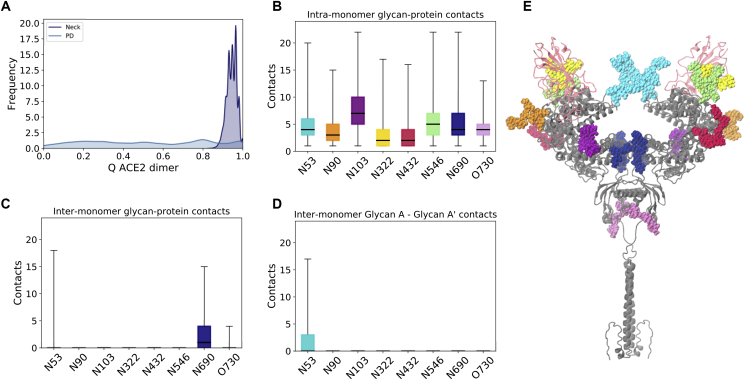
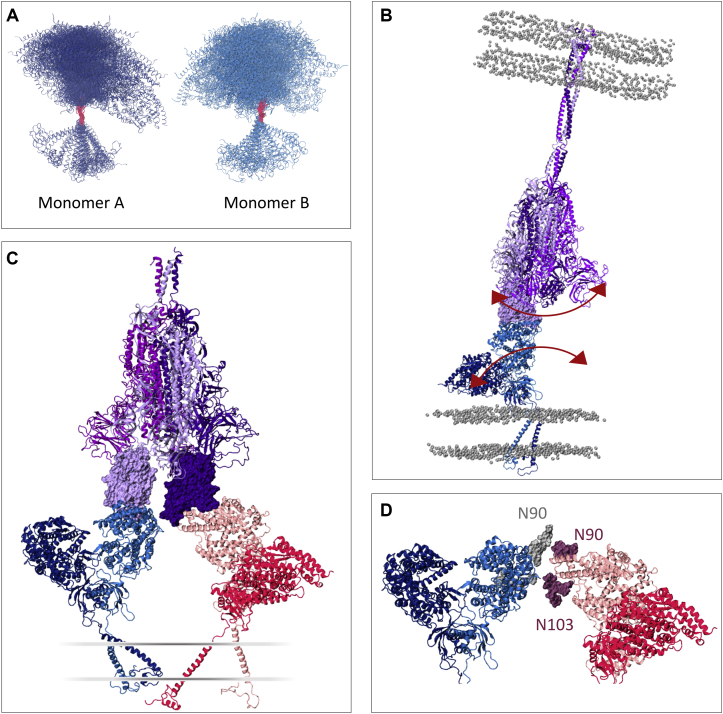
The coronavirus disease 2019 (COVID-19) pandemic has swept over the world in the past months, causing significant loss of life and consequences to human health. Although numerous drug and vaccine development efforts are underway, there are many outstanding questions on the mechanism of severe acute respiratory syndrome coronavirus 2 (SARS-CoV-2) viral association to angiotensin-converting enzyme 2 (ACE2), its main host receptor, and host cell entry. Structural and biophysical studies indicate some degree of flexibility in the viral extracellular spike glycoprotein and at the receptor-binding domain (RBD)-receptor interface, suggesting a role in infection. Here, we perform explicitly solvated, all-atom, molecular dynamics simulations of the glycosylated, full-length, membrane-bound ACE2 receptor in both an apo and spike RBD-bound state to probe the intrinsic dynamics of the ACE2 receptor in the context of the cell surface. A large degree of fluctuation in the full-length structure is observed, indicating hinge bending motions at the linker region connecting the head to the transmembrane helix while still not disrupting the ACE2 homodimer or ACE2-RBD interfaces. This flexibility translates into an ensemble of ACE2 homodimer conformations that could sterically accommodate binding of the spike trimer to more than one ACE2 homodimer and suggests a mechanical contribution of the host receptor toward the large spike conformational changes required for cell fusion. This work presents further structural and functional insights into the role of ACE2 in viral infection that can potentially be exploited for the rational design of effective SARS-CoV-2 therapeutics.


Figures

Figure 1
Figure 1
Model structure. (A) Full-length ACE2 homodimer protein structure in complex with spike protein RBDs. ACE2 peptidase, neck, and transmembrane domains are shown with cartoons highlighted in blue, navy, and magenta, respectively. Spike RBDs are depicted with pink cartoons. (B) Fully glycosylated and membrane-embedded model. ACE2 and RBDs are represented with gray and pink cartoons, respectively. Atoms of N- and O-glycans are shown with per-monosaccharide-colored spheres in which GlcNAc is highlighted in blue, mannose in green, fucose in red, galactose in yellow, and sialic acid in purple. Lipid heads (P atoms) are represented with gray spheres, whereas lipid tails are depicted with a licorice representation using the following color scheme: POPC (navy), POPI (violet), POPE (silver), CHL (blue), and PSM (magenta). To see this figure in color, go online.
Figure 2
Figure 2
Tilt motion of ACE2. (A) Right panel shows head tilt angle distribution relative to the transmembrane domain long axis for apo (gray) and RBD-bound (navy) simulations, accumulated over the two monomers in the three replicas of each system. The angle value corresponding to the cryoEM conformation is indicated by a black line. Left panel shows a representation of the metric, with ACE2 monomers colored dark and light blue, RBDs colored pink, and phosphorus atoms from membrane’s lipid heads shown in gray in a van der Waals representation. (B) Distribution of the minimal distance between peptidase domain (PD) and membrane. (C) Distribution of the ACE2 monomer heads’ center of mass distance. (D) Visual representation of the tilt angle distribution for the RBD-bound simulations with a color gradient according to the relative population. (E) Example of a highly tilted ACE2 homodimer conformation sampled in the simulation. The black circle highlights a membrane-inserted neck domain loop. The ACE2 and RBD glycans are shown in gray, and the membrane’s lipid heads are shown in a silver transparent representation. To see this figure in color, go online.
Figure 3
Figure 3
ACE2 revolution relative to a plane perpendicular to the transmembrane helix’s long axis. (A) Representation of a monomer’s degree of flexibility in one of the replicas, showing the time evolution of the position of the Cα atom of Gln325 colored from dark red (t = 0) to dark blue (t = 1000 ns). Conformations aligned to the cryoEM’s reference TM domain Cα atoms shown in a van der Waals representation and initial and final monomer conformations shown in a cartoon representation. (B) Head revolution angle distribution for apo (gray) and RBD-bound (navy) simulations. The angle value corresponding to the cryoEM conformation (revolution angle = 0) is indicated by a black line. Left panel shows a representation of the metric, with monomer’s head initial position shown in red, the same monomer at a time t in dark blue, and phosphorus atoms from membrane’s lipid heads shown in gray in a van der Waals representation. (C) Relative orientation of the monomer’s head in the heterodimer. The ACE2 monomers are colored dark and light blue. To see this figure in color, go online.
Figure 4
Figure 4
Transmembrane helix dynamics. (A) Distance between the center of mass of each monomer’s TM helix. (B) TM helix tilt angle relative to the membrane’s normal. The values corresponding to the cryoEM conformation are indicated by a black line. Left panels show representation of the metric, with ACE2 monomers colored dark and light blue, RBDs colored pink, and phosphorus atoms from membrane’s lipid heads shown in gray in a van der Waals representation. To see this figure in color, go online.
Figure 5
Figure 5
ACE2-RBD interactions. (A) Residues in the ACE2-RBD interface colored according to the regions classification (silver, magenta, and cyan) and shown with licorice representation. The ACE2 monomer is shown with dark blue cartoons and the RBD with pink cartoons. Glycans have been omitted from (A) for clarity. (B) Distribution of the fraction of native contacts in each of the interaction regions. The colors are the same as in (A). (C) Glycans in the ACE2-RBD interface, shown with surface representation with the following color scheme: N53 (cyan), N90 (orange), N103 (purple), N322 (yellow), N546 (lime), and N343 (dark red). (D) Box plot of the number of glycan-protein contacts for the interface glycans shown in (C), using the same color scheme. The horizontal black lines indicate the mean value, boxes extend to the lower and upper quartiles, and whiskers show the total range of the data. To see this figure in color, go online.
Figure 6
Figure 6
ACE2 homodimer contacts for RBD-bound simulations. (A) Fraction of the native contacts between ACE2 monomers considering only protein components of the glycoprotein. The neck and PD interacting regions are depicted separately. (B) Total glycan-protein interactions formed within each ACE2 monomer, per glycan. The horizontal black lines indicate mean value, boxes extend to the lower and upper quartiles, and whiskers show the total range of the data. (C) Glycan-protein contacts between glycans in one of the monomer and protein residues in the opposite monomer. (D) Glycan-glycan contacts between the glycan in one of the monomers (glycan A) and its copy in the other monomer (glycan A’). (E) The ACE2 dimer with glycans in a van der Waals representation is colored according to (B)–(D). The ACE2 protein dimer is colored gray and RBDs in light pink. To see this figure in color, go online.
Figure 7
Figure 7
ACE2 flexibility’s impact on S interaction. (A) ACE2 monomer conformations taken from equally spaced frames from the simulations, aligned via the flexible linker. (B) Proposed effect of ACE2’s flexibility on the spike’s dynamics, communicated through the ACE2-RBD complex. The three chains in the spike model are colored in different shades of purple, with the “up” RBD shown in light purple in surface representation. The phosphorus atoms from membrane’s lipid heads are shown in gray in a van der Waals representation. The red arrows indicate the proposed effect of ACE2 flexibility in the ACE2-S complex dynamics. (C) Proposed complex of two ACE2 dimers bound to a single spike, with two RBDs in the “up” conformation. The ACE2 dimers are shown in dark and light blue and dark and light pink, respectively. The RBDs are shown in a surface representation. A schematic of the membrane is indicated. (D) Detailed view of the ACE2 heads in (C), with N90 and N103 glycans highlighted. To see this figure in color, go online.

Update of

Comment in

References

    1. Hoffmann M., Kleine-Weber H., Pöhlmann S. SARS-CoV-2 cell entry depends on ACE2 and TMPRSS2 and is blocked by a clinically proven protease inhibitor. Cell. 2020;181:271–280.e8. - PMC - PubMed
    1. Zhou P., Yang X.L., Shi Z.L. A pneumonia outbreak associated with a new coronavirus of probable bat origin. Nature. 2020;579:270–273. - PMC - PubMed
    1. Wang Q., Zhang Y., Qi J. Structural and functional basis of SARS-CoV-2 entry by using human ACE2. Cell. 2020;181:894–904.e9. - PMC - PubMed
    1. Huang C., Wang Y., Cao B. Clinical features of patients infected with 2019 novel coronavirus in Wuhan, China. Lancet. 2020;395:497–506. - PMC - PubMed
    1. Wang C., Horby P.W., Gao G.F. A novel coronavirus outbreak of global health concern. Lancet. 2020;395:470–473. - PMC - PubMed

MeSH terms

Substances