. 2021;11(4):909-933.
doi: 10.1016/j.jcmgh.2020.11.002. Epub 2020 Nov 12.

Intestinal Dysbiosis Amplifies Acetaminophen-Induced Acute Liver Injury

Affiliations

Intestinal Dysbiosis Amplifies Acetaminophen-Induced Acute Liver Injury

Kai Markus Schneider et al. Cell Mol Gastroenterol Hepatol. 2021.

Abstract

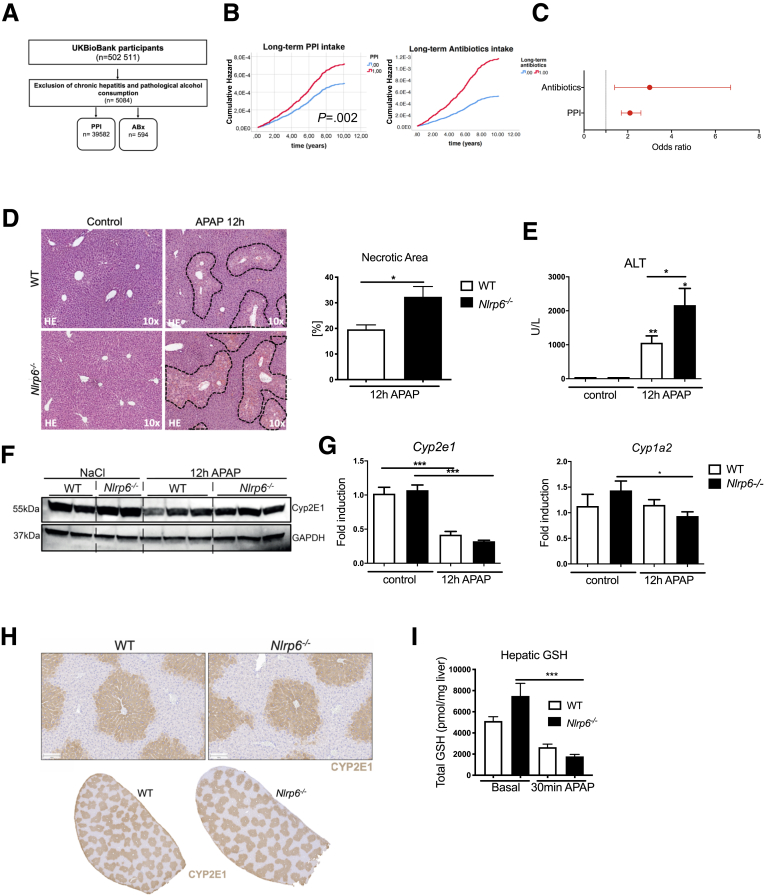
Background & aims: Acute liver failure (ALF) represents an unmet medical need in Western countries. Although the link between intestinal dysbiosis and chronic liver disease is well-established, there is little evidence for a functional role of gut-liver interaction during ALF. Here we hypothesized that intestinal dysbiosis may affect ALF.

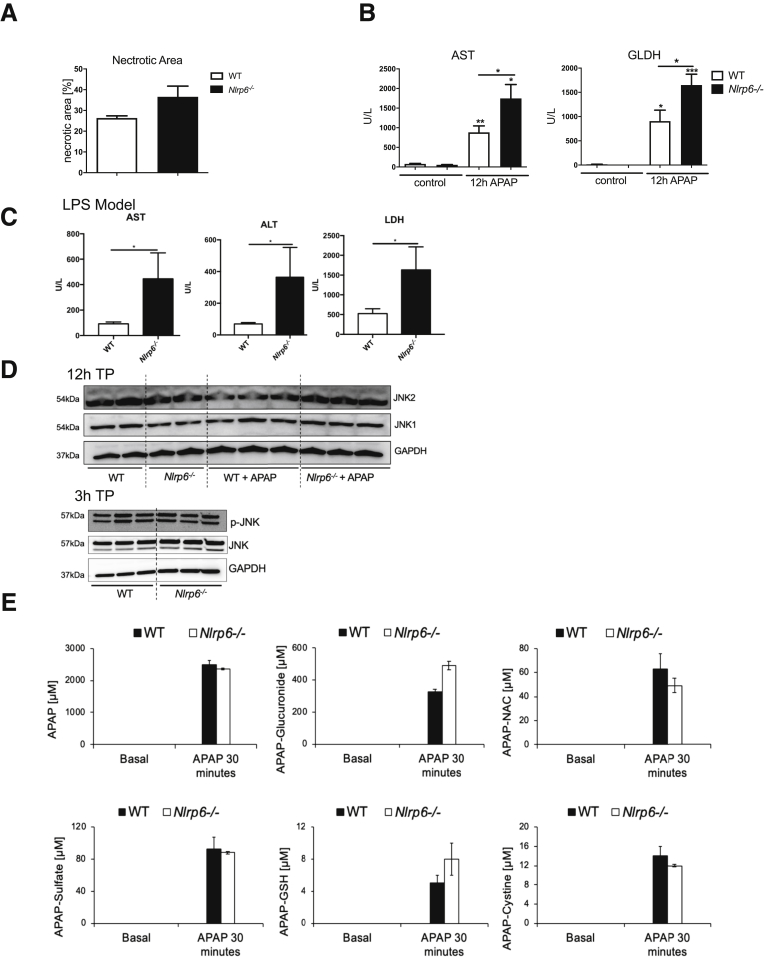
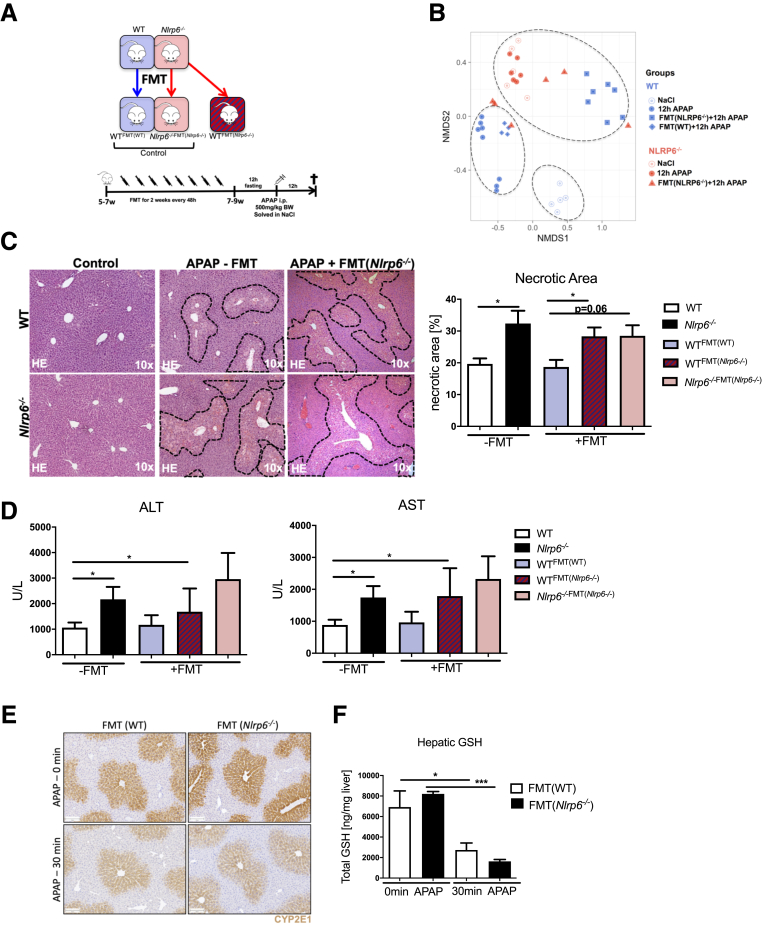
Methods: To test this hypothesis, we assessed the association of proton pump inhibitor (PPI) or long-term antibiotics (ABx) intake, which have both been linked to intestinal dysbiosis, and occurrence of ALF in the 500,000 participants of the UK BioBank population-based cohort. For functional studies, male Nlrp6-/- mice were used as a dysbiotic mouse model and injected with a sublethal dose of acetaminophen (APAP) or lipopolysaccharide (LPS) to induce ALF.

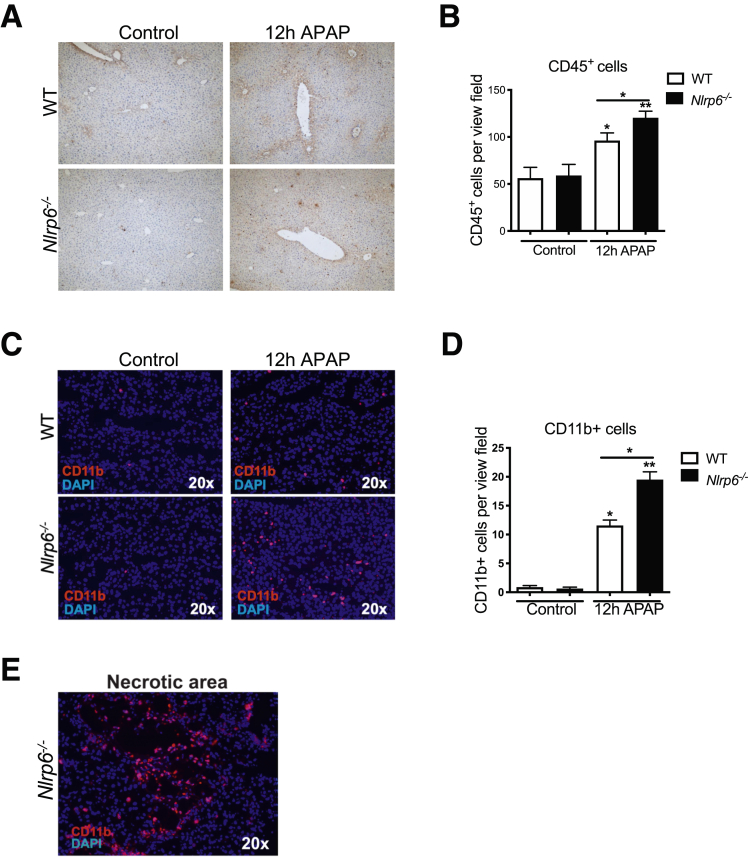
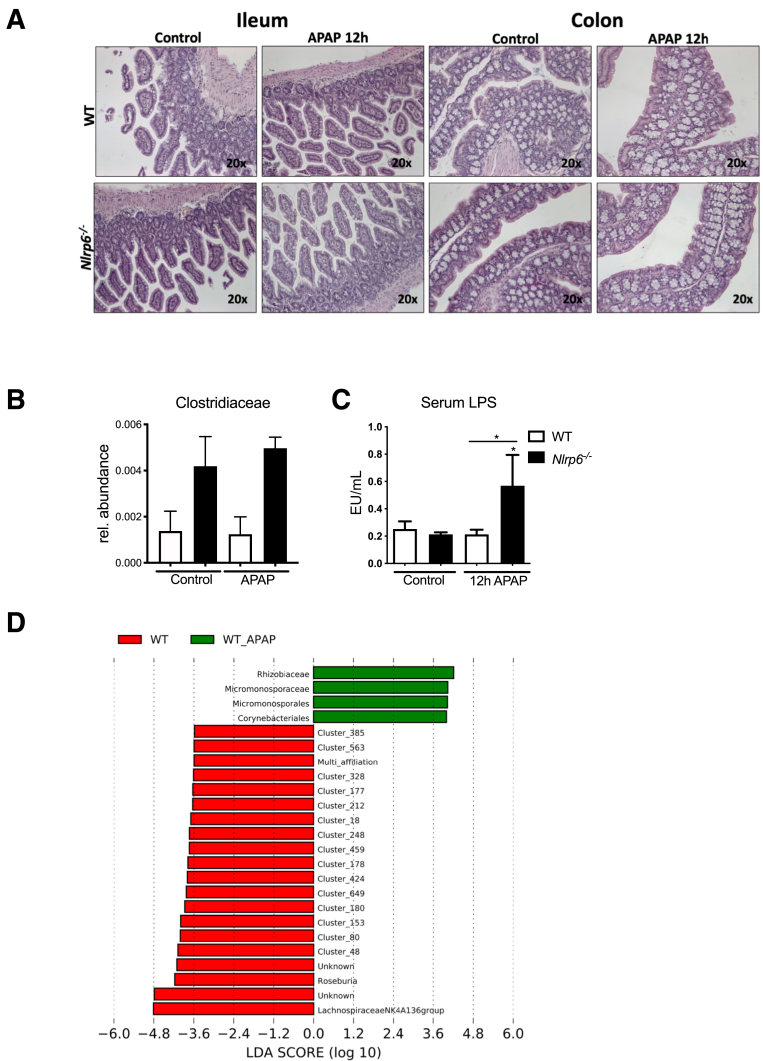
Results: Multivariate Cox regression analyses revealed a significantly increased risk (odds ratio, 2.3-3) for developing ALF in UK BioBank participants with PPI or ABx. Similarly, dysbiotic Nlrp6-/- mice displayed exacerbated APAP- and LPS-induced liver injury, which was linked to significantly reduced gut and liver tissue microbiota diversity and correlated with increased intestinal permeability at baseline. Fecal microbiota transfer (FMT) from Nlrp6-/- mice into wild-type (WT) mice augmented liver injury on APAP treatment in recipient WT mice, resembling the inflammatory phenotype of Nlrp6-/- mice. Specifically, FMT skewed monocyte polarization in WT mice toward a Ly6Chi inflammatory phenotype, suggesting a critical function of these cells as sensors of gut-derived signals orchestrating the inflammatory response.

Conclusions: Our data show an important yet unknown function of intestinal microbiota during ALF. Intestinal dysbiosis was transferrable to healthy WT mice via FMT and aggravated liver injury. Our study highlights intestinal microbiota as a targetable risk factor for ALF.

Keywords: Acute Liver Failure; Dysbiosis; Gut-Liver-Axis; Microbiota.


Figures

None
Graphical abstract
Figure 1
Figure 1
Intestinal dysbiosis is associated with increased risk and severity of ALF. (A) Overview of the analyzed population. Population-based study analyzing UK BioBank participants. (B) Multivariate Cox regression analysis showing cumulative risks for developing ALF in patients with long-term ABx or PPI medication compared with patients without medication. (C) Odds ratio for developing ALF in patients with PPI or ABx. Corrected for age, sex, APRI, Charlson comorbidity index. (D) Representative liver histopathology (hematoxylin-eosin staining) showing necrotic areas, which were quantified on high-resolution liver scans of WT and Nlrp6-/- mice 12 hours after treatment (n = 6). (E) Liver injury assessed by serum ALT levels after APAP (n = 13) or control (n = 5) treatment. (F) Cytochrome Cyp2E1 protein expression in liver samples of representative NaCl (n = 2) and APAP (n = 3) treated WT and Nlrp6-/- mice. (G) Quantitative PCR of liver samples showing mRNA levels of cytochromes Cyp1A2 and Cyp2E1 after NaCl (n = 5) or APAP treatment (n = 13). (H) Immunohistochemistry staining against CYP2E1 in livers of WT and Nlrp6-/- mice. (I) Total hepatic GSH levels (pmol/mg liver tissue) in control (n = 7) liver and 30 minutes after APAP (n = 4) administration. All data are presented as mean ± standard error of mean and considered significant at ∗P < .05, ∗∗P < .01, and ∗∗∗P < .001, respectively (unpaired Student t test). ∗Significantly different from respective control group.
Figure 2
Figure 2
Nlrp6-/-do not show increased apoptosis, JNK activation, or altered APAP metabolism. (A) Quantitative measurement of necrotic areas on high-resolution liver scans of WT (n = 3) and Nlrp6-/- mice (n = 3) 24 hours after treatment. (B) Liver injury assessed by serum AST and GLDH levels after 12-hour APAP (n = 13) or control (n = 5) treatment. (C) Liver injury assessed by serum AST, ALT, and LDH levels 6 hours after LPS injection in WT (n = 6) or Nlrp6-/- (n = 5) mice. (D) Western blot analysis of JNK1 and JNK2 protein in WT and Nlrp6-/- mice 12 hours and 3 hours after control or APAP treatment. (E) High-performance liquid chromatography analysis of APAP serum metabolites in WT (n = 4) and Nlrp6-/- (n = 4) 30 minutes after APAP administration. All data are presented as mean ± standard error of mean and considered significant at ∗P < .05, ∗∗P < .01, and ∗∗∗P < .001, respectively (unpaired Student t test). ∗Significantly different from respective control group. AILI, acetaminophen-induced liver injury; NAC, N-acteylcysteine; TP, time point.
Figure 3
Figure 3
NLRP6 modulates the inflammatory response after APAP administration. (A) Immunohistochemistry staining against CD45 and (C) immunofluorescent staining against CD11b in livers of WT and Nlrp6-/- mice on 12-hour NaCl (control) or APAP challenge. (B) Corresponding quantitative analysis of CD45 positive stained cells in livers of WT and Nlrp6-/- mice upon 12 hours of treatment (Control: n = 2, APAP: n ≥ 6). (D) Quantification of CD11b positive stained cells in livers of WT and Nlrp6-/- mice (Control: n = 3, APAP: n ≥ 10). (E) Exemplary immunofluorescent staining against CD11b on frozen liver sections depicting a necrotic area. All data are presented as mean ± standard error of mean and considered significant at ∗P < .05, ∗∗P < .01, and ∗∗∗P < .001, respectively (unpaired Student t test). ∗Significantly different from respective control group.
Figure 4
Figure 4
APAP-induced shift in microbiota composition is restricted to WT mice. (A) NMDS analyses based on UniFrac beta diversity metric from cecal stool samples of WT and Nlrp6-/- mice 12 hours after NaCl (n = 5) or APAP (n ≥ 6) injection. Every point represents cecal microbiota composition of 1 mouse. Similar microbiota composition is reflected in closer ordination. (B) Permutational multivariate analysis of variance (adonis) considering the factors genotype and treatment. (C) Shannon diversity of microbiota species in cecum stool of WT and Nlrp6-/- mice taken after 12 hours of NaCl (WT: n = 5, Nlrp6-/-: n = 5) or APAP (WT: n = 8, Nlrp6-/-: n = 6) treatment. (D) Computational LEfSe analysis comparing NaCl-treated with APAP-treated WT mice. (E) Relative abundance of Lachnospiraceae and Firmicutes in WT and Nlrp6-/- mice. All data are presented as mean ± standard error of mean and considered significant at ∗P < .05, ∗∗P < .01, and ∗∗∗P < .001, respectively (unpaired Student t test). ∗Significantly different from respective control group. OTU, operational taxonomic unit.
Figure 5
Figure 5
APAP treatment results in intestinal barrier impairment and shapes hepatic tissue microbiota. (A) Representative ileum and colon histology (hematoxylin-eosin staining) of WT and Nlrp6-/- mice 12 hours after APAP administration. (B) Hepatic abundance of Clostridiaceae DNA after 12 hours of NaCl (WT: n = 6, Nlrp6-/-: n = 6) or APAP (WT: n = 5, Nlrp6-/-: n = 5) challenge. (C) LPS concentrations in portal serum of control (WT: n = 4, Nlrp6-/-: n = 4) and APAP-treated (WT: n = 6, Nlrp6-/-: n = 6) WT and Nlrp6-/- mice. (D) Computational LEfSe analysis comparing hepatic microbiota composition of NaCl-treated with APAP-treated WT mice. All data are presented as mean ± standard error of mean and considered significant at ∗P < .05, ∗∗P < .01, and ∗∗∗P < .001, respectively (unpaired Student t test). ∗Significantly different from respective control group.
Figure 6
Figure 6
Intestinal barrier impairment on APAP challenge. (A) Representative immunofluorescence of colon of WT and Nlrp6-/- mice staining against zonula occludens-1. (B) Western blot analyses and (C) quantification of occludin protein expression in ileum of representative WT and Nlrp6-/- mice after 12 hours of NaCl (n = 3) or APAP (n = 5) treatment. (D) Colonic mucus layers and bacterial colonization shown by immunofluorescent staining against Muc2 and fluorescence in situ hybridization using EuBac-probe for eubacteria in colon of WT and Nlrp6-/- mice. (E) Enzyme-linked immunosorbent assay of fecal albumin concentrations in freshly collected fecal pellets from APAP-treated WT (n = 9) and Nlrp6-/- (n = 7) mice and controls (WT: n = 4, Nlrp6-/-: n = 3). (F) Quantitative analysis of thickness of colonic mucus layers in immunofluorescent stainings (NaCl: WT: n = 4, Nlrp6-/-: n = 2; APAP: WT: n = 3, Nlrp6-/-: n = 5) 24 hours after APAP administration. All data are presented as mean ± standard error of mean and considered significant at ∗P < .05, ∗∗P < .01, and ∗∗∗P < .001, respectively (unpaired Student t test).
Figure 7
Figure 7
Intestinal barrier impairment prompts bacterial translocation and shapes hepatic tissue microbiota. (A) Hepatic 16s rDNA copies/mg liver tissue of NaCl (WT: n = 6, Nlrp6-/-: n = 6) or APAP (WT: n = 5, Nlrp6-/-: n = 5) treated mice. (B) Hepatic bacterial DNA alpha diversity (Chao1 index) in control (n = 6) or APAP (n = 5) treated Nlrp6-/- and WT mice. (C) Hepatic 16s rDNA microbiota profiles of WT and Nlrp6-/- mice shown by ordination plots based on generalized UniFrac distances. Every dot represents 1 mouse. (D) Hepatic abundance of LachnospiraceaeNK4A136 and Firmicutes DNA after 12 hours of NaCl (WT: n = 6, Nlrp6-/-: n = 6) or APAP (WT: n = 5, Nlrp6-/-: n = 5) challenge. (E) Relative abundance of hepatic Clostridiaceae DNA correlates with serum GLDH levels (Spearman). All data are presented as mean ± standard error of mean and considered significant at ∗P < .05, ∗∗P < .01, and ∗∗∗P < .001, respectively (unpaired Student t). ∗Significantly different from respective control group.
Figure 8
Figure 8
Increased severity of DILI is transmissible to wild-type animals via FMT. (A) Experimental setup: FMT was performed from WT to WT and Nlrp6-/- to WT as well as Nlrp6-/- animals. WT and Nlrp6-/- mice were treated with fresh Nlrp6-/- or WT feces every 48 hours via oral gavage for 2 weeks, fasted 12 hours before injection of APAP (500 mg/kg) or NaCl, and were analyzed 12 hours after injection. (B) NMDS analysis based on UniFrac beta diversity metric displaying microbiota composition in cecal stool samples taken after 12 hours of NaCl or APAP treatment from WT and Nlrp6-/- mice as well as FMT-treated WT and Nlrp6-/- mice. (C) Representative liver histology (hematoxylin-eosin staining) showing necrotic areas and inflammation in 12-hour NaCl (Control) challenged and either non–FMT-treated or with Nlrp6-/- feces FMT-treated APAP challenged WT and Nlrp6-/- mice. Quantitative measurement of necrotic areas on high-resolution liver scans of WT, Nlrp6-/- (n = 6) and FMT-treated WT and Nlrp6-/- mice (n ≥ 4) after 12 hours of APAP treatment. (D) Liver damage indicated by serum ALT and AST levels of 12-hour APAP challenged WT, Nlrp6-/- (n = 13), WTFMT(Nlrp6-/-) (n = 6), WTFMT(WT) (n = 4), and FMT-treated Nlrp6-/-FMT(Nlrp6-/-) mice (n = 6). (E) Immunohistochemistry staining against CYP2E1 in mouse livers before or 30 minutes after APAP injection. (F) Total GSH levels in liver tissue before or 30 minutes after APAP injection (n = 4). All data are presented as mean ± standard error of mean and considered significant at ∗P < .05, ∗∗P < .01, and ∗∗∗P < .001, respectively (unpaired Student t test).
Figure 9
Figure 9
FMT does not affect hepatic Cyp2E1 expression. (A) Immunohistochemistry staining against CYP2E1 of whole liver scans of WT mice treated with WT microbiota (FMT(WT)) or Nlrp6-/- microbiota (FMT(Nlrp6-/-)) before and 30 minutes after APAP treatment.
Figure 10
Figure 10
Liver injury on FMT of Nlrp6-/-microbiota is orchestrated by Ly6Chiinflammatory monocytes. (A) Immunofluorescence staining against CD11b and (B) quantitative analysis of CD11b+ stained cells in liver samples of WT and Nlrp6-/- mice either with (n ≥ 3) or without (n ≥ 10) previous FMT after 12 hours of APAP treatment. (C) Quantification of MoMFs (defined as CD11bhiF4/80low) as percent of living liver leukocytes of either non–FMT-treated (–FMT, WT: n = 10, Nlrp6-/-: n = 11) or FMT(Nlrp6-/-)-treated (+FMT, WT: n = 7, Nlrp6-/-: n = 3) WT and Nlrp6-/- mice determined by fluorescence-activated cell sorter analysis. (D) Flow cytometry analysis of Ly6Chi expression of MoMFs in liver samples of WTFMT(WT) (n = 4) or WTFMT(Nlrp6-/-) (n = 7) mice after 12-hour APAP treatment. (E) NMDS analyses based on UniFrac beta diversity metric. Every point represents cecal microbiota composition of 1 mouse. Similar microbiota composition is reflected in closer ordination. (F) Microbiota alpha diversity shown by Shannon index in APAP- and NaCl-treated WT and Nlrp6-/- mice without (WT/Nlrp6-/-: n ≥ 5) and with (WT NaCl: n = 2; WT APAP: n = 4, Nlrp6-/- APAP: n = 3) ABx treatment. (G) Representative liver histology showing necrotic areas and inflammation in ABx-treated mice. (H) Quantitative measurement of necrotic areas on high-resolution liver scans of APAP-treated WT (n = 5) and Nlrp6-/- (n = 7) mice 12 hours after treatment. (I) Liver injury assessed by serum ALT and GLDH levels after APAP (WT: n = 5, Nlrp6-/-: n = 7). (J) Liver-to-bodyweight ratio of ABx-treated WT and Nlrp6-/- mice. Every dot represents 1 mouse. All data are presented as mean ± standard error of mean and considered significant at ∗P < .05, ∗∗P < .01, and ∗∗∗P < .001, respectively (unpaired Student t test). ∗Significantly different from respective control group.

References

    1. Lee W.M. AASLD position paper: update. Hepatology. 2005;41:1179–1197. - PubMed
    1. Sandhu N., Navarro V. Drug-induced liver injury in GI practice. Hepatol Commun. 2020 - PMC - PubMed
    1. Andrade R.J., Aithal G.P., Björnsson E.S., Kaplowitz N., Kullak-Ublick G.A., Larrey D., Karlsen T.H. EASL clinical practice guidelines: drug-induced liver injury. J Hepatol. 2019;70:1222–1261. - PubMed
    1. Davidson D.G.D., Eastham W.N. Acute liver necrosis following overdose of paracetamol. Br Med J. 1966;2:497–499. - PMC - PubMed
    1. Krenkel O., Mossanen J.C., Tacke F. Immune mechanisms in acetaminophen-induced acute liver failure. Hepatobiliary Surg Nutr. 2014;3:331–343. - PMC - PubMed

Publication types

Substances

LinkOut - more resources