. 2021 Jan:38:101771.
doi: 10.1016/j.redox.2020.101771. Epub 2020 Nov 1.

Songorine promotes cardiac mitochondrial biogenesis via Nrf2 induction during sepsis

Affiliations

Songorine promotes cardiac mitochondrial biogenesis via Nrf2 induction during sepsis

Yi Li et al. Redox Biol. 2021 Jan.

Abstract

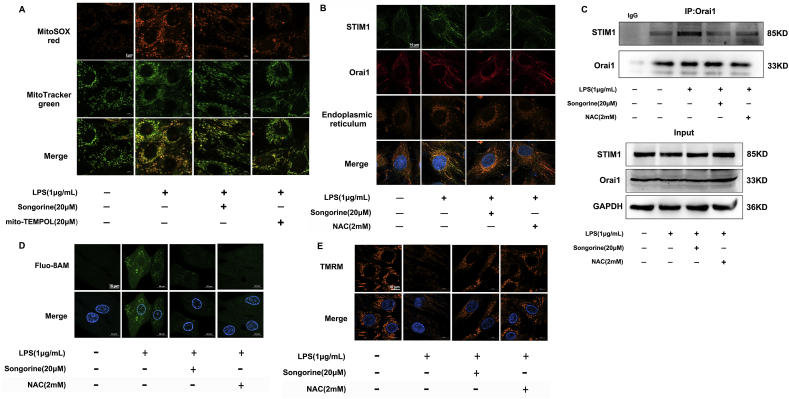
Septic cardiomyopathy is characterized by impaired contractive function with mitochondrial dysregulation. Songorine is a typical active C20-diterpene alkaloid from the lateral root of Aconitum carmichaelii, which has been used for the treatment of heart failure. This study investigated the protective role of songorine in septic heart injury from the aspect of mitochondrial biogenesis. Songorine (10, 50 mg/kg) protected cardiac contractive function against endotoxin insult in mice with Nrf2 induction. In cardiomyocytes, lipopolysaccharide (LPS) evoked mitochondrial reactive oxygen species (ROS) production and redistributed STIM1 to interact with Orai1 for the formation of calcium release-activated calcium (CRAC) channels, mediating calcium influx, which were prevented by songorine, likely due to ROS suppression. Songorine activated Nrf2 by promoting Keap1 degradation, having a contribution to enhancing antioxidant defenses. When LPS shifted metabolism away from mitochondrial oxidative phosphorylation (OXPHOS) in cardiomyocytes, songorine upregulated mitochondrial genes involved in fatty acid β-oxidation, tricarboxylic acid (TCA) cycle and electron transport chain in a manner dependent on Nrf2, resultantly protecting the capability of OXPHOS. Songorine increased luciferase report gene activities of nuclear respiratory factor-1 (Nrf1) and mitochondrial transcription factor A (Tfam) dependently on Nrf2, indicative of the regulation of Nrf2/ARE and NRF1 signaling cascades. Songorine promoted PGC-1α binding to Nrf2, and the cooperation was required for songorine to activate Nrf2/ARE and NRF1 for the control of mitochondrial quality and quantity. In support, the beneficial effects of songorine on cardioprotection and mitochondrial biogenesis were diminished by cardiac Nrf2 deficiency in mice subjected to LPS challenge. Taken together, these results showed that Nrf2 transcriptionally promoted mitochondrial biogenesis in cooperation with PGC-1α. Songorine activated Nrf2/ARE and NRF1 signaling cascades to rescue cardiomyocytes from endotoxin insult, suggesting that protection of mitochondrial biogenesis was a way for pharmacological intervention to prevent septic heart injury.

Keywords: Mitochondrial biogenesis; Nrf2; PGC-1α; Septic cardiomyopathy; Songorine.


Conflict of interest statement

None.

Figures

Image 1
Graphical abstract
Fig. 1
Fig. 1
Songorine protected heart function with Nrf2 activation in septic heart. (A) songorine was intraperitoneally administrated 1 h before LPS injection (30 mg/kg) and then administered for 3 consecutive days. The mortality in mice within 72 h was recorded (n = 8). B–I: mice were administrated with songorine (i.p.) 1 h before and 12 h after LPS challenge (10 mg/kg), and the cardiac function was examined after 24 h: (B) ejection fractions (EF), shortening fraction (FS), (C) left ventricular end-systolic volumes (LVVs), left ventricular end-diastolic volumes (LVVd) and (D) left ventricular mass (LV Mass) (n = 6); (E) the morphology of mitochondria in the heart was viewed using transmission electronic microscopy (n = 5, scale bar: 5 μm); (F–H) ROS production, F4/80 staining and Nrf2 protein staining in the heart were observed by immunofluorescence (n = 5, scale bar: 50 μm or 100 μm). (I-J) genes expression of Hmox1, Nqo1, superoxide dismutase 2 (Sod2) and Cat were detected by Q-PCR. Data are presented as mean ± SEM (n = 5). *p < 0.05, **p < 0.01, ***p < 0.001 vs. LPS treatment; #p < 0.05, ###p < 0.001 vs. indicated treatment; ns: no significant difference. p values are determined by one-way ANOVA followed by Tukey's test.
Fig. 2
Fig. 2
Songorine prevented ROS-associated calcium overload. Primary neonatal rat ventricular myocytes (NRVMs) were stimulated with LPS (1 μg/mL) for 24 h. (A) mitochondrial ROS production in NRVMs (scale bar: 5 μm); (B) the view of co-localization of STIM1 and Orai1 in NRVMs (scale bar: 10 μm, green: STIM1, red: Orai1, yellow: endoplasmic reticulum); (C) the binding of STIM1 to Orai1 determined by immunoprecipitation in NRVMs; (D) calcium influx and (E) mitochondrial membrane potential (Δψm) in NRVMs (scale bar: 10 μm). NAC, n-acetylcysteine. All data are repeated in five independent experiments. p values are determined by one-way ANOVA followed by Tukey's test. (For interpretation of the references to colour in this figure legend, the reader is referred to the Web version of this article.)
Fig. 3
Fig. 3
Songorine preserved Nrf2 protein abundance in cardiomyocytes. (A) Keap1 protein degradation when protein synthesis was inhibited by cycloheximide in primary neonatal rat ventricular myocytes (NRVMs); (B) exogenous Nrf2 protein stability when protein synthesis was inhibited by cycloheximide in NRVMS; (C, D) Keap1 and Nrf2 protein expression in NRVMs stimulated with LPS for 24 h; (E) gene expression of superoxide dismutase 2 (Sod2) and Cat in NRVMs exposed to LPS for 24 h. All data are presented as mean ± SEM (n = 5). *p < 0.05, **p < 0.01, ***p < 0.001 vs. LPS or LPS + shNC treatment; ###p < 0.001 vs. indicated treatment. p values are determined by one-way ANOVA followed by Tukey's test.
Fig. 4
Fig. 4
Songorine protected mitochondrial respiration. Primary neonatal rat ventricular myocytes (NRVMs) were treated with LPS (1 μg/mL) for 24 h: (A, B) oxygen consumption rate (OCR) and extracellular acidification rate (ECAR) were measured in NRVMs; (C) ATP production in NRVMs; (D) gene expression of Cpt1α and Ehhadh were detected in NRVMs; (E) gene expression of Fh, Idh3a and Sdha were detected in NRVMs; (F) gene expression of Cycs, Ndufv1 and Ndufs1 were detected in NRVMs; (G) gene expression of ND1 and COX1 were detected in NRVMs; (H) mitochondrial mass staining with nonyl acridine orange (NAO) in NRVMs (scale bar: 20 μm). NAC, n-acetylcysteine. All data are presented as mean ± SEM (n = 5). *p < 0.05, **p < 0.01, ***p < 0.001 vs. LPS or LPS + shNC treatment; #p < 0.05, ##p < 0.01, ###p < 0.001 vs. indicated treatment; ns: no significant difference. p values are determined by one-way ANOVA followed by Tukey's test. (For interpretation of the references to colour in this figure legend, the reader is referred to the Web version of this article.)
Fig. 5
Fig. 5
Songorine regulated NRF1 and TFAM activity. (A) Nrf1 and Tfam gene expression in primary neonatal rat ventricular myocytes (NRVMs) exposed to LPS for 24 h; (B) the view of Nrf2 transport into the nucleus with co-location of NRF1 in NRVMs stimulated with LPS for 24 h (scale bar: 5 μm, green: NRF1, red: Nrf2) (n = 5); (C, D) luciferase report activity of Nrf1 and Tfam in H9C2 cells stimulated with LPS for 24 h. All data are presented as mean ± SEM (n = 5). *p < 0.05, **p < 0.01, ***p < 0.001 vs. LPS or LPS + shNC treatment; #p < 0.05, ##p < 0.01, ###p < 0.001 vs. indicated treatment. p values are determined by one-way ANOVA followed by Tukey's test. (For interpretation of the references to colour in this figure legend, the reader is referred to the Web version of this article.)
Fig. 6
Fig. 6
PGC-1α was required for songorine induction of mitochondrial biogenesis. (A) PGC-1α gene and protein expression in primary neonatal rat ventricular myocytes (NRVMs) stimulated with LPS for 24 h; (B) the immunoprecipitation assay of the binding of PGC-1α to Nrf2 in NRVMs stimulated with LPS for 24 h; (C, D) luciferase report activities of Nrf1 and Tfam in H9C2 cells stimulated with LPS for 24 h; (E) gene expression of Nrf1 and Tfam in NRVMs exposed to LPS for 24 h; (F) mitochondrial number labeled with nonyl acridine orange (NAO) was viewed using flow cytometry in NRVMs stimulated with LPS for 24 h; (G, H) MTCO1 and VDAC1 protein expression in NRVMs treated with LPS for 24 h. All data are presented as mean ± SEM (n = 5); *p < 0.05, **p < 0.01, ***p < 0.001 vs. LPS or LPS + pEX3-NC treatment; #p < 0.05, ##p < 0.01, ###p < 0.001 vs. indicated treatment. p values are determined by one-way ANOVA followed by Tukey's test. (For interpretation of the references to colour in this figure legend, the reader is referred to the Web version of this article.)
Fig. 7
Fig. 7
Cardiac Nrf2 deficiency attenuated protective effects of songorine. Male C57BL/6 mice were injected with AAV9-shNfe2l2 or AAV9-shNC through the caudal vein. Mice were administrated with songorine (i.p.) 1 h before and 12 h after LPS challenge (10 mg/kg), and the heart was examined 24 h later: (A) ejection fraction (EF), shortening fractional (FS), left ventricular end-systolic volumes (LVVs), left ventricular end-diastolic volumes (LVVd) and left ventricular mass (LV Mass) (n = 7); (B) immunofluorescence staining of cardiac SIRT1 protein (scale bar: 100 μm), one presentation of five mice; (C) immunoprecipitation examination of the binding of PGC-1α to Nrf2 (n = 5); (D-F) cardiac genes expression of Nrf1 and Tfam,ND1 and COX1, Cycs, Ndufv1 and Ndufs1were detected; (G) MTCO1 and VDAC1 protein expression in heart tissue. All data are presented as mean ± SEM (n = 5). *p < 0.05, **p < 0.01, ***p < 0.001 vs. LPS + AAV9-shNC treatment; #p < 0.05,##p < 0.01, ###p < 0.001 vs. indicated treatment. p values are determined by one-way ANOVA followed by Tukey's test.
Fig. 8
Fig. 8
Schematic regulatory mechanism of songorine action. Songorine activated Nrf2 that transcriptionally regulated NRF1 induction in cooperation with PGC-1α. NRF1 directly and indirectly (in TFAM induction) upregulated nuclearly and mitochondrially encoded OXPHOS genes to promote mitochondrial biogenesis. In addition, songorine reduced CRAC channels-mediated calcium influx to protect mitochondrial function by suppressing mitochondrial ROS production.
Supplement Fig. 1
Supplement Fig. 1
Chemical structure of songorine.
Supplement Fig. 2
Supplement Fig. 2
Songorine protected heart function in septic heart. Mice were treated with songorine (50 mg/kg) 1 h before and 24 h after LPS treatment, as the Pre-songorine group, while the group of Post-songorine was administrated with songorine (50 mg/kg) 2 h and 24 h after LPS treatment (n = 9). The cardiac function was examined 48 h after LPS treatment: (A) ejection fractions (EF), shortening fraction (FS), (B) left ventricular end-systolic volumes (LVVs), left ventricular end-diastolic volumes (LVVd) and (C) left ventricular mass (LV Mass). *p < 0.05, ***p < 0.001vs. LPS treatment; #p < 0.05, ###p < 0.001vs. indicated treatment; ns: no significant difference. p values are determined by one-way ANOVA followed by Tukey's test.
Supplement Fig. 3
Supplement Fig. 3
Songorine inhibited ROS production and calcium overload in cardiomyocytes. (A) ROS production in primary neonatal rat ventricular myocytes (NRVMs) exposed to LPS for 24 h; (B) cell survival in songorine-treated NRVMs was measures by a microplate reader. The data are presented as mean ± SEM (n = 5), *p < 0.05, ***p < 0.001vs. Control treatment. (C–F) H9C2 cells were treated with songorine (20 μM) and exposed to LPS at the indicated time points. (C) mitochondrial ROS production and (D) calcium content were measured by a microplate reader. H9C2 cells were post-treated with songorine (20 μM) 2 h after LPS stimulation, (E) mitochondrial ROS production and (F) calcium content were measured by a microplate reader 24 h later. All data are presented as mean ± SEM (n = 5 or 6). *p < 0.05, **p < 0.01, ***p < 0.001 vs. LPS treatment; ###p < 0.001vs. indicated treatment. p values are determined by one-way ANOVA followed by Tukey's test.
Supplement Fig. 4
Supplement Fig. 4
Short hairpin RNA (shRNA) plasmid screening. Primary neonatal rat ventricular myocytes (NRVMs) were transfected with shNC, shNfe2l2, shNrf1 or shPpargc1α plasmids using Lipofectamine 3000 transfection reagent for 48 h. (A-C) The gene expression of Nfe2l2,Nrf1 and Ppargc1α were tested by qRT-PCR. All data are presented as mean ± SEM (n = 5). ***p < 0.001vs. shNC treatment. p values are determined by one-way ANOVA followed by Tukey's test.
Supplement Fig. 5
Supplement Fig. 5
Songorine protected mitochondrial mass in the presence of autophagy inhibitor. Mitochondrial number was detected with nonyl acridine orange (NAO) and measured using a microplate reader in primary neonatal rat ventricular myocytes (NRVMs) stimulated with LPS for 24 h (3-MA, 3-methyladenine). All data are presented as mean ± SEM (n = 5). ***p < 0.001 vs. LPS treatment; ##p < 0.01, ###p < 0.001 vs. indicated treatment. p values are determined by one-way ANOVA followed by Tukey's test.
Supplement Fig. 6
Supplement Fig. 6
Songorine improved PGC-1α protein stability. (A) NAD+/NADH ratio in primary neonatal rat ventricular myocytes (NRVMs) after LPS stimulation; (B) SIRT1 protein expression in NRVMs; (C) PGC-1α protein expression in the indicated time. All data are presented as mean ± SEM (n = 5). *p < 0.05, **p < 0.01, ***p < 0.001 vs. LPS treatment; #p < 0.05, ##p < 0.01, ###p < 0.001 vs. Control or indicated treatment. p values are determined by one-way ANOVA followed by Tukey's test.
Supplement Fig. 7
Supplement Fig. 7
Gene and protein level of Nrf2 in Nrf2 knockdown heart. Male C57BL/6 mice were injected with AAV9-shNfe2l2 or AAV9-shNC through the caudal vein: (A) the cardiac mRNA level of Nfe2l2. The data are presented as mean ± SEM (n = 5). ###p < 0.001 vs. indicated treatment. After tested for normal distribution using the Shapiro-Wilk test, data were analyzed by unpaired Student's t-test (2 groups). (B) immunofluorescence staining of cardiac Nrf2 protein (scale bar: 100 μm), one presentation of five mice.

References

    1. Pulido J.N., Afessa B., Masaki M. Clinical spectrum, frequency, and significance of myocardial dysfunction in severe sepsis and septic shock [J] Mayo Clin. Proc. 2012;87(7):620–628. doi: 10.1016/j.mayocp.2012.01.018. - DOI - PMC - PubMed
    1. Martin L., Derwall M., Al Zoubi S. The septic heart: current understanding of molecular mechanisms and clinical implications [J] Chest. 2019;155(2):427–437. doi: 10.1016/j.chest.2018.08.1037. - DOI - PubMed
    1. Kumar V. Sepsis roadmap: what we know, what we learned, and where we are going [J] Clin. Immunol. 2020;210:108264. doi: 10.1016/j.clim.2019.108264. - DOI - PubMed
    1. Durand A., Duburcq T., Dekeyser T. Involvement of mitochondrial disorders in septic cardiomyopathy [J] Oxid. Med. Cell Longev. 2017;2017:4076348. doi: 10.1155/2017/4076348. - DOI - PMC - PubMed
    1. Murphy M.P., Hartley R.C. Mitochondria as a therapeutic target for common pathologies [J] Nat. Rev. Drug Discov. 2018;17(12):865–886. doi: 10.1038/nrd.2018.174. - DOI - PubMed

Substances