. 2020 Nov 25;63(22):13719-13732.
doi: 10.1021/acs.jmedchem.0c01277. Epub 2020 Nov 15.

Cancer Cell Resistance Against the Clinically Investigated Thiosemicarbazone COTI-2 Is Based on Formation of Intracellular Copper Complex Glutathione Adducts and ABCC1-Mediated Efflux

Affiliations

Cancer Cell Resistance Against the Clinically Investigated Thiosemicarbazone COTI-2 Is Based on Formation of Intracellular Copper Complex Glutathione Adducts and ABCC1-Mediated Efflux

Julia H Bormio Nunes et al. J Med Chem. .

Abstract

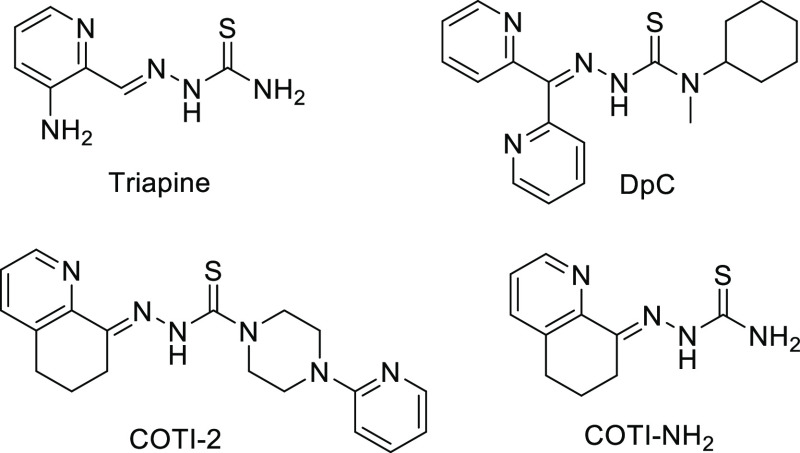
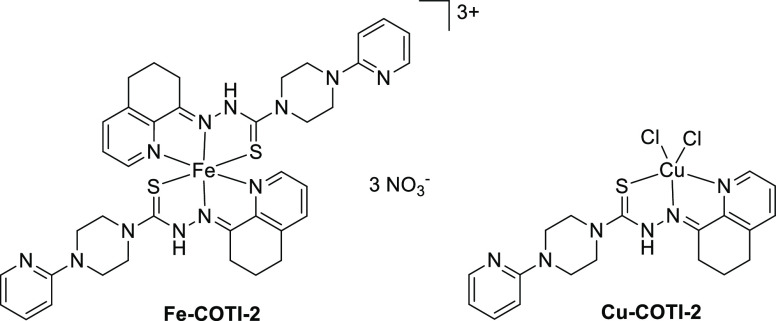
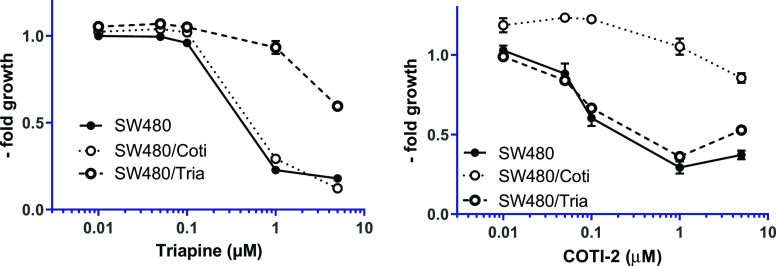
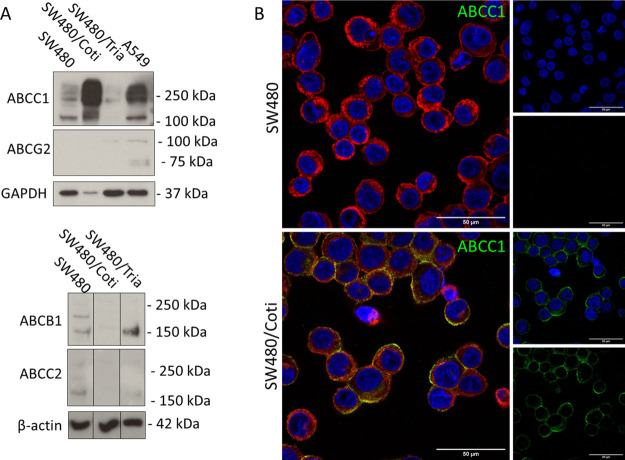
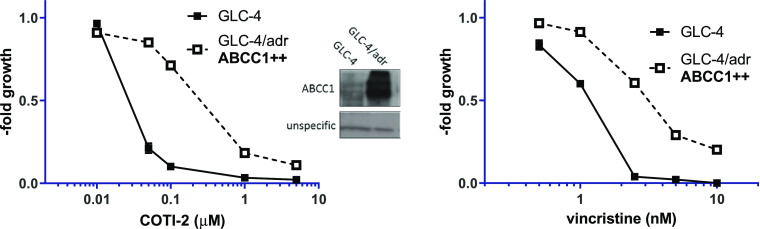
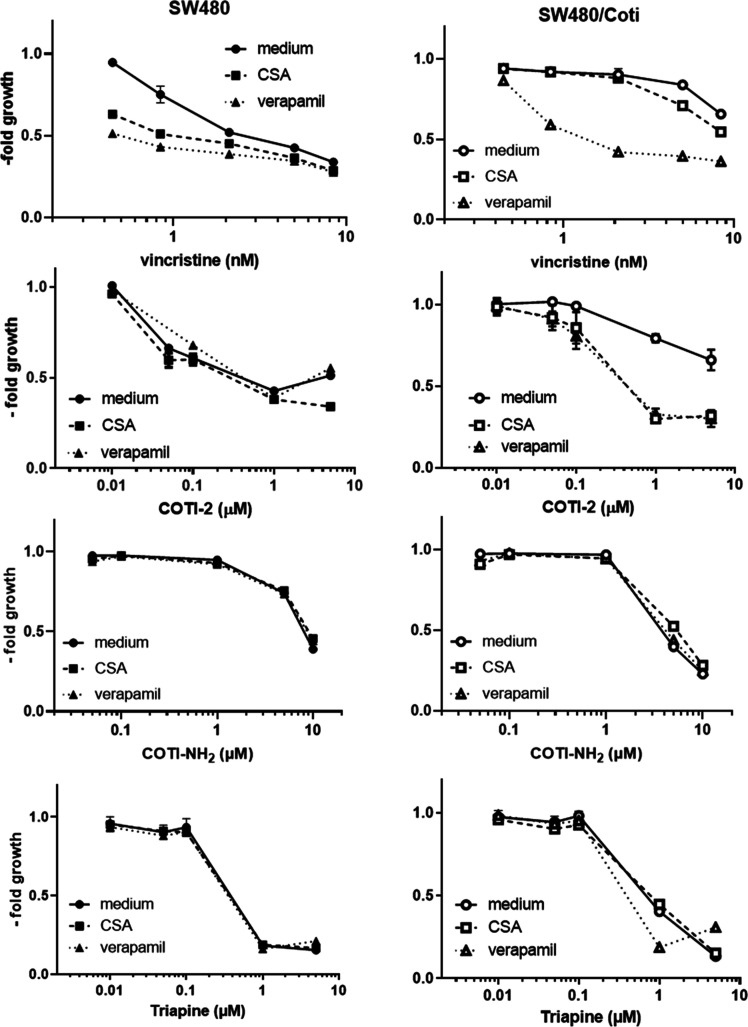
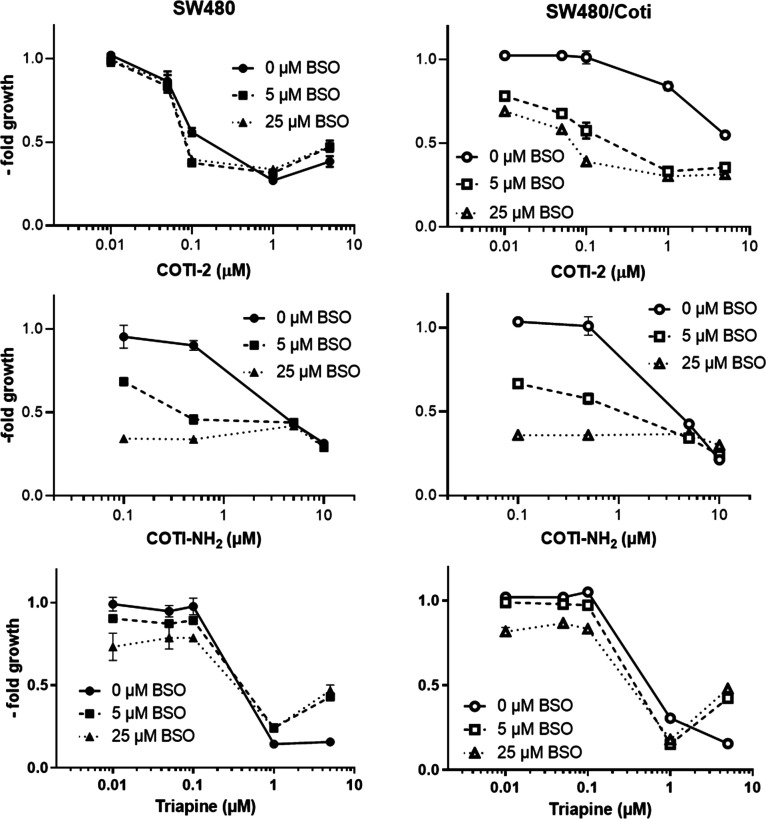
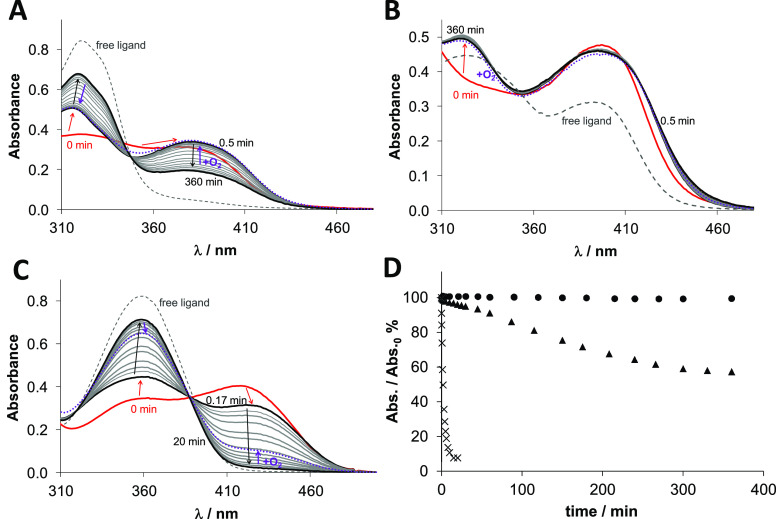
COTI-2 is a novel anticancer thiosemicarbazone in phase I clinical trial. However, the effects of metal complexation (a main characteristic of thiosemicarbazones) and acquired resistance mechanisms are widely unknown. Therefore, in this study, the copper and iron complexes of COTI-2 were synthesized and evaluated for their anticancer activity and impact on drug resistance in comparison to metal-free thiosemicarbazones. Investigations using Triapine-resistant SW480/Tria and newly established COTI-2-resistant SW480/Coti cells revealed distinct structure-activity relationships. SW480/Coti cells were found to overexpress ABCC1, and COTI-2 being a substrate for this efflux pump. This was unexpected, as ABCC1 has strong selectivity for glutathione adducts. The recognition by ABCC1 could be explained by the reduction kinetics of a ternary Cu-COTI-2 complex with glutathione. Thus, only thiosemicarbazones forming stable, nonreducible copper(II)-glutathione adducts are recognized and, in turn, effluxed by ABCC1. This reveals a crucial connection between copper complex chemistry, glutathione interaction, and the resistance profile of clinically relevant thiosemicarbazones.


Conflict of interest statement

The authors declare no competing financial interest.

Figures

Scheme 1
Scheme 1. Chemical Structures of the Clinically Investigated Triapine, DpC, and COTI-2 as well as the Terminally Unsubstituted Derivative COTI-NH2
Scheme 2
Scheme 2. Different Possible Isomers of COTI-2. The Z- and E′-Isomers Have Strongly Downfield Shifted NH Rresonance NMR Signals due to the Presence of Intramolecular Hydrogen Bonds
Scheme 3
Scheme 3. Chemical Structure of the Iron(III) and Copper(II) Complex of COTI-2
Figure 1
Figure 1
ORTEP plots of (A) COTI-2, (B) Cu-COTI-2a, and (C) Cu-COTI-2b with atom numbering. Ellipsoids are drawn at the 50% probability level. Selected bond lengths (Å) and bond angles (°) for (A) COTI-2 (bond precision for C–C single bond is 0.0030 Å): C8–N2 1.300(9), N2–N3 1.354(3), N3–C10 1.351(8), C10–S 1.717(1), C10–N4 1.361(4); N1–C9–C8 116.3, N2–N3–C10 112.0. For (B) Cu-COTI-2a (bond precision for C–C single bond is 0.0030 Å), two different types of Cu–Cl bonds occur: Cu1–Cl1 2.255(8) Å, Cu1–Cl1′ (1–X,–Y,–Z) 2.748(6) Å. Further selected bond lengths (Å) and bond angles (°): N1–Cu 2.029(9) Å, N2–Cu 1.961(3), S1–Cu 2.268(2) Å, Cu···Cu 3.52; Cl–Cu1–Cl′ 91.2, Cl–Cu–S 97.8, N1–Cu–N2 80.9, N2–Cu–S 84.2, N1–Cu1–Cl 96.3. For (C) Cu-COTI-2b (bond precision for C–C single bonds is 0.0121 Å), the main residue disorder is 39%. The counter ion [CuCl4]−2 position is shifted, and solvent (H2O) and the disordered second part were omitted for clarity. Two different types of Cu–Cl bonds occur: Cu1–Cl1 2.245(3) Å (light red shaded) and Cu1–Cl1′ (1–X,1–Y,1–Z) 2.719(8) Å (light orange shaded). Green-shaded areas visualize protonated nitrogen positions. Further selected bond lengths (Å) and bond angles (°): N1–Cu 2.022(7) Å, N2–Cu 1.958(8), S1–Cu 2.260(7) Å, Cu···Cu 3.42; Cl–Cu1–Cl′ 93.3, Cl–Cu–S 95.8, N1–Cu–N2 80.5, N2–Cu–S 84.8, N1–Cu1–Cl 98.1.
Figure 2
Figure 2
Resistance of SW480/Tria and SW480/Coti cells against Triapine and COTI-2. Anticancer activity of the drugs was tested by the MTT viability assay after 72 h drug incubation in SW480 vs the resistant sublines. Mean ± standard deviation (SD) was derived from triplicates of one representative experiment out of three.
Figure 3
Figure 3
Cell cycle arrest and cell death induction by COTI-2 in SW480 and SW480/Coti cells after 24 h treatment. (A) The percentage of cells in G2/M phase was analyzed by staining ethanol-fixed cells with propidium iodide (PI) followed by flow cytometry. Mean ± SD was derived from three independent experiments. (B) Nucleic morphology was analyzed by DAPI staining of methanol/acetone (1:1)-fixed cells. Mitotic cells are indicated with an arrow (scale bar: 50 μm). (C) Cell death induction was analyzed by AV and PI stain followed by flow cytometry. Mean ± SD was derived from three independent experiments. (D) Representative microscopy images of paraptotic vesicle formation (arrow) in SW480 and SW480/Coti cells after 24 h treatment with 1 μM COTI-2 (scale bar: 50 μm). (E) Percentage of vacuolated cells (counted in Image J). Mean ± SD was derived from three independent experiments. Significance between cell lines (asterix between bars) was calculated in (A) and (E) by two-way ANOVA and the Sidak’s multiple comparison test. Significant difference to the control group (indicated by the asterisk above bar) was calculated in (A) and (C) by one-way ANOVA and the Dunnett’s multiple comparison test (p < 0.05 *, p < 0.01 **, p < 0.001 ***, p < 0.0001 ****).
Figure 4
Figure 4
ABC transporter expression of the investigated SW480 cell clones. (A) Protein expression of ABC transporters was investigated in membrane-enriched fractions of the indicated cell lines by Western blotting. GADPH and β-actin were used as loading controls and A549 as positive control for ABCC1 and ABCG2 expression. Borders between cell lines indicate the rearrangement of original lanes of the same blot. (B) Immunofluorescence staining of ABCC1 (green) in SW480 and SW480/Coti cells. Cells were transferred to microscopy slides by cytospin and fixed with 4% PFA. DAPI (blue) and rhodamine-conjugated wheat-germ agglutinin (red) were used as counterstains for nuclei and membranes, respectively. (Scale bar: 50 μm).
Figure 5
Figure 5
Influence of ABCC1 expression on the activity of COTI-2. Anticancer activity of COTI-2 was tested in GLC-4 and GLC-4/adr lung cancer cells by the MTT assay after 72 h drug incubation. Vincristine, a known ABCC1 substrate, was used as a reference drug. Values given are means ± SD of three experiments performed in triplicates. The insert shows a Western blot of membrane-enriched protein fractions confirming the overexpression of ABCC1 in GLC-4/adr compared to parental GLC-4 cells.
Figure 6
Figure 6
Impact of ABC transporter modulators (1 μM CSA and 10 μM verapamil) on the anticancer activities of vincristine, COTI-2, COTI-NH2, and Triapine in the SW480/Coti cells in comparison to the parental cells. Vincristine was used as a positive control of an ABCC1 substrate. Viability was measured by the MTT assay after 72 h of combined drug treatment. Mean ± SD was derived from triplicates of one representative experiment out of three. Values are given normalized to their respective controls. Thus, modulator controls were set to 1.
Figure 7
Figure 7
Impact of GSH synthesis inhibition by BSO on the anticancer activity of COTI-2, COTI-NH2, and Triapine in SW480 and SW480/Coti cells. BSO was added 18 h before drug treatment, and viability was measured by MTT after 72 h of drug treatment. Mean ± SD was derived from triplicates of one representative experiment out of three.
Figure 8
Figure 8
Time-dependent changes of the UV–vis spectra of the (A) Cu-COTI-NH2, (B) Cu-COTI-2, and (C) Cu-Triapine complex (30 μM) in the presence of 300 equiv of GSH at pH 7.4 in aqueous solution under anaerobic conditions. (T = 25 °C; pH = 7.40 (50 mM HEPES)). Dashed lines represents the metal-free ligand and red lines the Cu-TSC complex without GSH. Red arrows indicate the change after the addition of GSH, black arrows after incubation with GSH for up to 360 min and violet arrows after oxygen exposure. (D) Time-dependent absorbance changes at the λmax of the S → Cu charge transfer band for the Cu-COTI-2 (circle solid), Cu-COTI-NH2 (triangle up solid), and Cu-Triapine complex (times) (30 μM) in the presence of 300 equiv of GSH at pH 7.4 in aqueous solution under anaerobic conditions (T = 25 °C; pH = 7.40 (50 mM HEPES)).

References

    1. Lobana T. S.; Sharma R.; Bawa G.; Khanna S. Bonding and structure trends of thiosemicarbazone derivatives of metals-An overview. Coord. Chem. Rev. 2009, 253, 977–1055. 10.1016/j.ccr.2008.07.004. - DOI
    1. Beraldo H.; Gambino D. The wide pharmacological versatility of semicarbazones, thiosemicarba-zones and their metal complexes. Mini-Rev. Med. Chem. 2004, 4, 31.10.2174/1389557043487484. - DOI - PubMed
    1. Yu Y.; Kalinowski D. S.; Kovacevic Z.; Siafakas A. R.; Jansson P. J.; Stefani C.; Lovejoy D. B.; Sharpe P. C.; Bernhardt P. V.; Richardson D. R. Thiosemicarbazones from the old to new: Iron chelators that are more than just ribonucleotide reductase inhibitors. J. Med. Chem. 2009, 52, 5271–5294. 10.1021/jm900552r. - DOI - PubMed
    1. Heffeter P.; Pape V. F. S.; Enyedy E. A.; Keppler B. K.; Szakacs G.; Kowol C. R. Anticancer thiosemicarbazones: chemical properties, interaction with iron metabolism, and resistance development. Antioxid. Redox Signaling 2019, 30, 1062–1082. 10.1089/ars.2017.7487. - DOI - PubMed
    1. Lovejoy D. B.; Jansson P. J.; Brunk U. T.; Wong J.; Ponka P.; Richardson D. R. Antitumor Activity of Metal-Chelating Compound Dp44mT Is Mediated by Formation of a Redox-Active Copper Complex That Accumulates in Lysosomes. Cancer Res. 2011, 71, 5871–5880. 10.1158/0008-5472.CAN-11-1218. - DOI - PubMed

Publication types

MeSH terms