. 2021 Jan 1;20(1):880-887.
doi: 10.1021/acs.jproteome.0c00675. Epub 2020 Nov 14.

Optimizing Accuracy and Depth of Protein Quantification in Experiments Using Isobaric Carriers

Affiliations

Optimizing Accuracy and Depth of Protein Quantification in Experiments Using Isobaric Carriers

Harrison Specht et al. J Proteome Res. .

Abstract

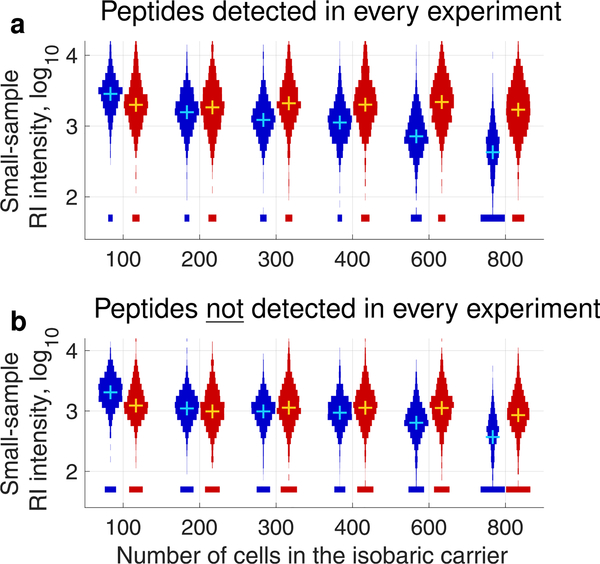
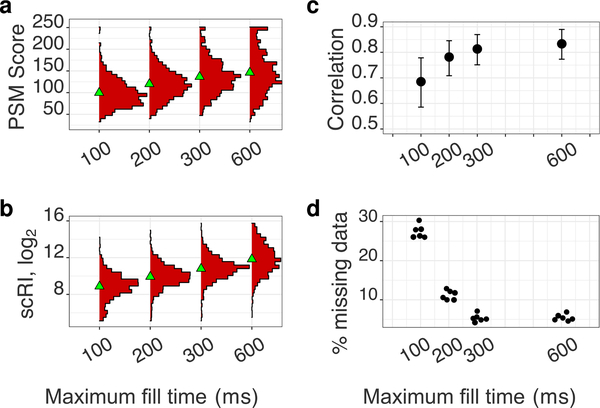
The isobaric carrier approach, which combines small isobarically labeled samples with a larger isobarically labeled carrier sample, finds diverse applications in ultrasensitive mass spectrometry analysis of very small samples, such as single cells. To enhance the growing use of isobaric carriers, we characterized the trade-offs of using isobaric carriers in controlled experiments with complex human proteomes. The data indicate that isobaric carriers directly enhance peptide sequence identification without simultaneously increasing the number of protein copies sampled from small samples. The results also indicate strategies for optimizing the amount of isobaric carrier and analytical parameters, such as ion accumulation time, for different priorities such as improved quantification or an increased number of identified proteins. Balancing these trade-offs enables adapting isobaric carrier experiments to different applications, such as quantifying proteins from limited biopsies or organoids, building single-cell atlases, or modeling protein networks in single cells. In all cases, the reliability of protein quantification should be estimated and incorporated in all subsequent analyses. We expect that these guidelines will aid in explicit incorporation of the characterized trade-offs in experimental designs and transparent error propagation in data analysis.

Keywords: benchmarking; data reliability; isobaric carrier; optimizing mass spectrometry analysis; quantification accuracy; single-cell proteomics.


Conflict of interest statement

The authors declare no competing financial interest.

Figures

Figure 1.
Figure 1.
Schematic diagram of the isobaric carrier concept. The peptides from small samples and from a larger (carrier) sample are labeled with isobaric tags, mixed, and analyzed by MS/MS. Some sets, as the standards listed in Table 1, may have more than one isobaric carrier sample. This approach increases the intensity of precursor ions (1), provides RIs for quantification (2), and facilitates sequence identifications based on the peptide fragments pooled across all samples (3).
Figure 2.
Figure 2.
Increasing input from 1 to 100 cells primarily benefits the identification rate of MS2 spectra. Replicates of 1-cell and 100-cell HeLa samples were analyzed by label-free proteomics by Cong et al. (a) Number of peptide-like features (unique isotopic envelopes resolved with respect to m/z and retention time with a charge ≥+2), the number of MS2 spectra recorded, and the number of peptide-spectral matches (PSMs) determined by MaxQuant at a 1% false-discovery rate (FDR). (b) Percent increase in each metric from 1 to 100 cell inputs. The percent increase in PSMs and identification rate (PSMs/MS2: the number of PSMs at a 1% FDR divided by the number of MS2 scans obtained) is greater than the percent increase in peptide-like features or MS2 scans obtained. The black bars denote medians.
Figure 3.
Figure 3.
Theoretically expected effects of increased isobaric carrier. Increasing the number of cells in the isobaric carrier increases the rate of accumulating peptide fragments for MS2 analysis. When the target AGC is reached, accumulation of ions stops, which may increase the speed of the analysis at the expense of decreased sampling of peptides from the small samples.
Figure 4.
Figure 4.
Number of identified peptides. Increasing the number of cells in the isobaric carrier results in a larger number of confidently identified peptides at any level of confidence as quantified by the posterior error probability (PEP). This trend is observed both with the low MS2 AGC target (50,000) shown in (a) and with the high MS2 AGC target (1,000,000) shown in (b). The MS2 scans of the run displayed with a dotted curve were performed at 35k resolution to demonstrate the potential advantage of low AGC for scanning and identifying more peptides. The MS2 scans of all other runs were performed at 70k resolution. The PEPs are estimated by MaxQuant using only the mass spectra and do not include additional features, such as retention time. These plots are standard components of the DO-MS reports, and the full reports are included in the Supporting Information and at scope2.slavovlab.net.
Figure 5.
Figure 5.
Effects of increasing the size of the isobaric carrier on peptide accumulation and sequence identification. (a) Distributions of MS2 accumulation times for all peptides identified across all displayed experiments with standards listed in Table 1. (b) Number of peptide fragments detected per PSM for all peptides that are identified in each experiment. For visualization purposes, peptides with more than 39 fragments were set to have 39 fragments. The confidence of sequence identification for peptides identified across all experiments is shown as distributions of scores computed either by Andromeda (c) or by Pulsar (d). These scores quantify the confidence of PSMs;, For visualization purposes, Andromeda scores exceeding 200 were set to 200 and Pulsar scores exeeding 350 were set to 350. The distributions shown here can be generated by DO-MS (DO-MS is software freely available at do-ms.slavovlab.net) and can be used to evaluate the regime of analysis for any particular set of experiments. To enable controlled comparisons, the distributions show data only for the subset of peptides identified across all levels of isobaric carriers., The plus marks denote medians.
Figure 6.
Figure 6.
Effects of increasing the size of the isobaric carrier on the RI intensities in the small samples. Both (a) and (b) show distributions of RI intensities from the small samples of the standards listed in Table 1. As shown in Figure 5, the blue distributions correspond to MS2 AGC = 50,000, and the red distributions correspond to MS2 AGC = 1,000,000. (a) Only the RI intensities for peptides identified across all experiments are shown to allow for a well-controlled comparison., (b) Only the RI intensities for peptides not identified across all experiments are shown to evaluate whether some of these peptides have a high enough RI intensity to be quantifiable. The means and medians of these distributions cannot be meaningfully compared because of nonignorable missing data.
Figure 7.
Figure 7.
Effects of increasing the size of the isobaric carrier for two target levels of peptide quantification. (a) Correlations between the protein fold changes (between monocytes and T-cells) estimated from the small samples and the carrier samples. All peptides quantified across all samples at a 1% FDR are used for this analysis. For the lower AGC series, there were 966 unique peptides and 382 unique proteins quantified in every experiment. For the higher AGC series, there were 982 unique peptides and 349 unique proteins quantified in every experiment. (b) Correlations between fold changes as in (a) but only for peptides whose RI intensities in the small samples are larger than 2000. In both (a) and (b), error bars represent the 90% confidence intervals computed from resampling subsets of the data. For the lower AGC series, there were 725 unique peptides and 298 unique proteins quantified in every experiment. For the higher AGC series, there were unique 657 peptides and 240 unique proteins quantified in every experiment.
Figure 8.
Figure 8.
Effects of increasing the maximum MS2 fill time from 100 to 600 ms for a standard with a 100-cell isobaric carrier. All peptides quantified across all samples at a 1% FDR are used for this analysis. (a) The confidence of sequence identification for peptides is shown as distributions of scores computed by Andromeda. (b) Distributions of RI intensities from the small samples (scRI) of a standard with a 100-cell isobaric carrier across all maximum fill times. (c) Correlations between the protein fold changes (between monocytes and HEK-293) estimated from the small samples and the isobaric carrier samples. (d) Fraction of missing RI intensities from the small samples as a function of maximum fill time.

References

    1. Cravatt BF; Simon GM; Yates JR III The biological impact of mass-spectrometry-based proteomics. Nature 2007, 450, 991. - PubMed
    1. Zhang Y; Fonslow BR; Shan B; Baek M-C; Yates JR III Protein analysis by shotgun/bottom-up proteomics. Chem. Rev 2013, 113, 2343–2394. - PMC - PubMed
    1. Chen AT; Franks A; Slavov N DART-ID increases single-cell proteome coverage. PLoS Comput. Biol 2019, 15, No. e1007082. - PMC - PubMed
    1. Specht H; Slavov N Transformative opportunities for single-cell proteomics. J. Proteome Res 2018, 17, 2565–2571. - PMC - PubMed
    1. Marx V A dream of single-cell proteomics. Nat. Methods 2019, 16, 809–812. - PubMed

Publication types