

Wastewater surveillance for SARS-CoV-2: Lessons learnt from recent studies to define future applications
- PMID: 33190883
- PMCID: PMC7648500
- DOI: 10.1016/j.scitotenv.2020.143493
Wastewater surveillance for SARS-CoV-2: Lessons learnt from recent studies to define future applications
Erratum in
-
Corrigendum to "Wastewater surveillance for SARS-CoV-2: Lessons learnt from recent studies to define future applications" [Sci. Total Environ. 759 (2021) 143493].Sci Total Environ. 2022 Mar 1;810:152346. doi: 10.1016/j.scitotenv.2021.152346. Epub 2021 Dec 15. Sci Total Environ. 2022. PMID: 34920241 Free PMC article. No abstract available.
Abstract
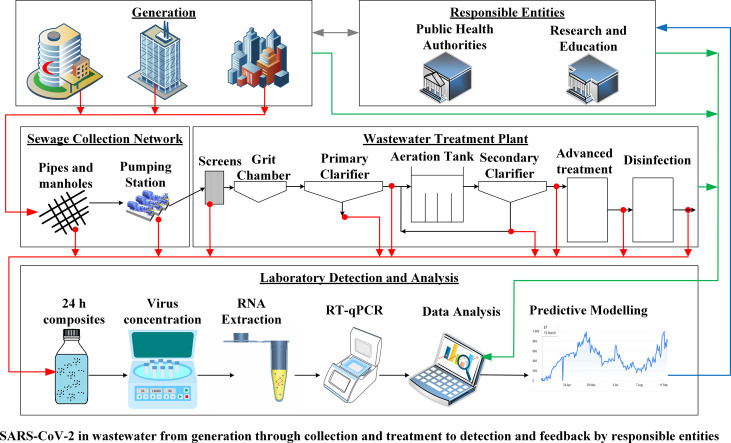
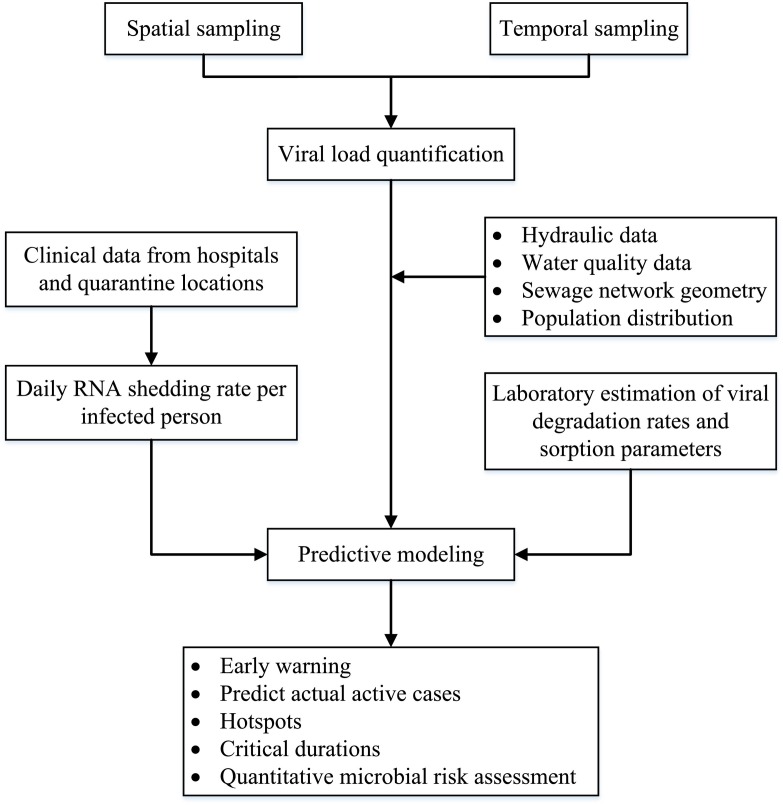
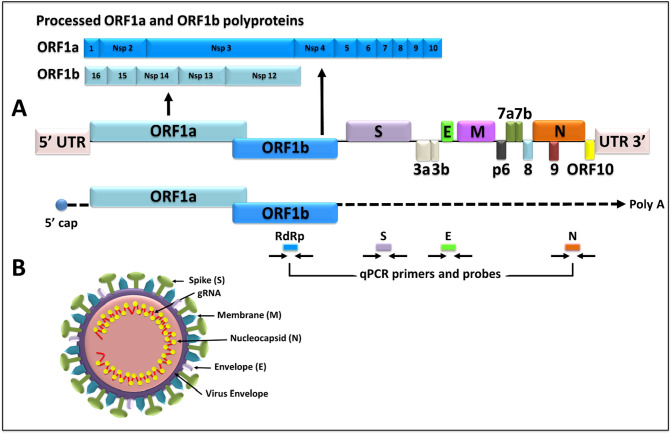
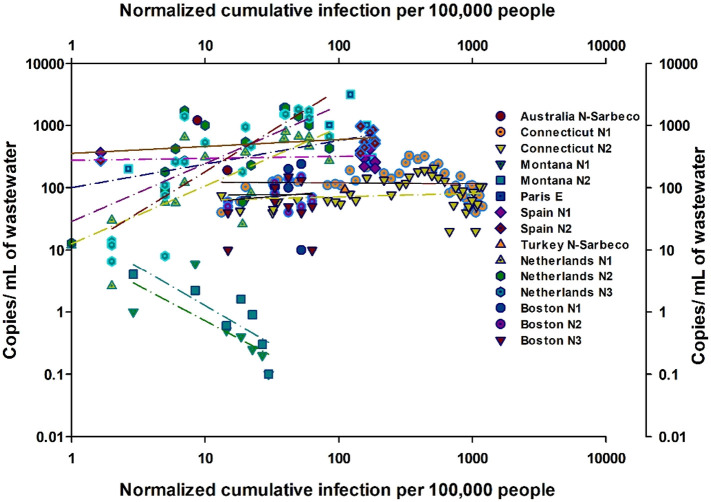
Wastewater-based epidemiology (WBE) is successful in the detection of the spread of SARS-CoV-2. This review examines the methods used and results of recent studies on the quantification of SARS-CoV-2 in wastewater. WBE becomes essential, especially with virus transmission path uncertainty, limitations on the number of clinical tests that could be conducted, and a relatively long period for infected people to show symptoms. Wastewater surveillance was used to show the effect of lockdown on the virus spread. A WBE framework tailored for SARS-CoV-2 that incorporates lessons learnt from the reviewed studies was developed. Results of the review helped outline challenges facing the detection of SARS-CoV-2 in wastewater samples. A comparison between the various studies with regards to sample concentration and virus quantification was conducted. Five different primers sets were used for qPCR quantification; however, due to limited data availability, there is no consensus on the most sensitive primer. Correlating the slope of the relationship between the number of gene copies vs. the cumulative number of infections normalized to the total population served with the average new cases, suggests that qPCR results could help estimating the number of new infections. The correlation is improved when a lag period was introduced to account for asymptomatic infections. Based on lessons learnt from recent studies, it is recommended that future applications should consider the following: 1) ensuring occupational safety in managing sewage collection and processing, 2) evaluating the effectiveness of greywater disinfection, 3) measuring viral RNA decay due to biological and chemical activities during collection and treatment, 4) assessing the effectiveness of digital PCR, and 5) conducting large scale international studies that follow standardized protocols.
Keywords: COVID-19; SARS-CoV-2; Virus concentration; Wastewater virus surveillance; Wastewater-based epidemiology.
Copyright © 2020 Elsevier B.V. All rights reserved.
Conflict of interest statement
Declaration of competing interest No potential conflict of interest was reported by the authors.
Figures
References
-
- Adcock N.J., Rice E.W., Sivaganesan M., Brown J.D., Stallknecht D.E., Swayne D.E. The use of bacteriophages of the family Cystoviridae as surrogates for H5N1 highly pathogenic avian influenza viruses in persistence and inactivation studies. J. Environ. Sci. Health A. 2009;44:1362–1366. - PubMed
-
- Ahmed W., Angel N., Edson J., Bibby K., Bivins A., O’Brien J.W., Choi P.M., Kitajima M., Simpson S.L., Li J., Tscharke B., Verhagen R., Smith W.J.M., Zaugg J., Dierens L., Hugenholtz P., Thomas K.V., Mueller J.F. First confirmed detection of SARS-CoV-2 in untreated wastewater in Australia: a proof of concept for the wastewater surveillance of COVID-19 in the community. Sci. Total Environ. 2020;728 doi: 10.1016/j.scitotenv.2020.138764. - DOI - PMC - PubMed
-
- Ahmed W., Bertsch P., Bivins A., Bibby K., Farkas K., Gathercole A., Haramoto E., Gyawali P., Korajkic A., McMinn B.R., Mueller J., Simpson S., Smith W.J.M., Symonds E.M., Thomas K.V., Verhagen R., Kitajima M. Comparison of virus concentration methods for the RT-qPCR-based recovery of murine hepatitis virus, a surrogate for SARS-CoV-2 from untreated wastewater. Sci. Total Environ. 2020:139960. doi: 10.1016/j.scitotenv.2020.139960. - DOI - PMC - PubMed
-
- Ahmed W., Bertsch P.M., Angel N., Bibby K., Bivins A., Dierens L., Edson J., Ehret J., Gyawali P., Hamilton K., Hosegood I., Hugenholtz P., Jiang G., Kitajima M., Sichani H.T., Shi J., Shimko K.M., Simpson S.L., Smith W.J.M., Symonds E.M., Thomas D.S.C., K.V., Verhagen R., Zaugg J., Mueller J.F. Detection of SARS-CoV-2 RNA in commercial passenger aircraft and cruise ship wastewater: a surveillance tool for assessing the presence of COVID-19 infected travelers. Journal of Travel Medicine. 2020 doi: 10.1093/jtm/taaa116. - DOI - PMC - PubMed
Publication types
MeSH terms
Substances
LinkOut - more resources
Full Text Sources
Other Literature Sources
Medical
Miscellaneous
