. 2020 Nov 16;36(12):184.
doi: 10.1007/s11274-020-02957-5.

Microbial population dynamics during traditional production of Mabisi, a spontaneous fermented milk product from Zambia: a field trial

Affiliations

Microbial population dynamics during traditional production of Mabisi, a spontaneous fermented milk product from Zambia: a field trial

Anneloes E Groenenboom et al. World J Microbiol Biotechnol. .

Abstract

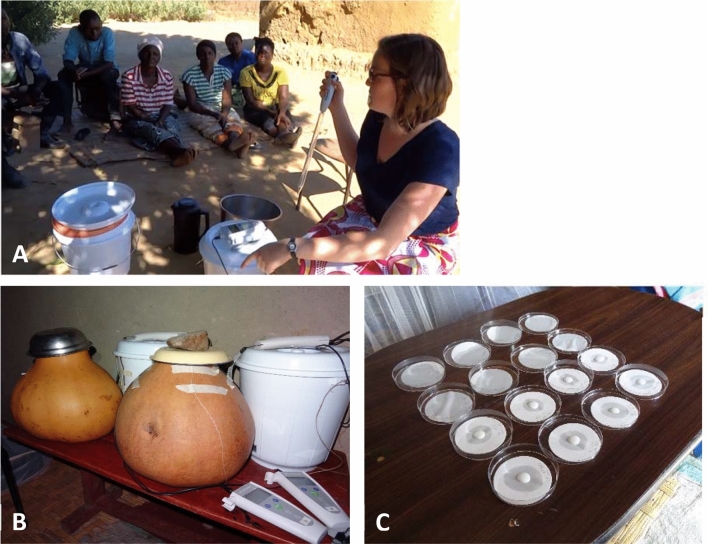
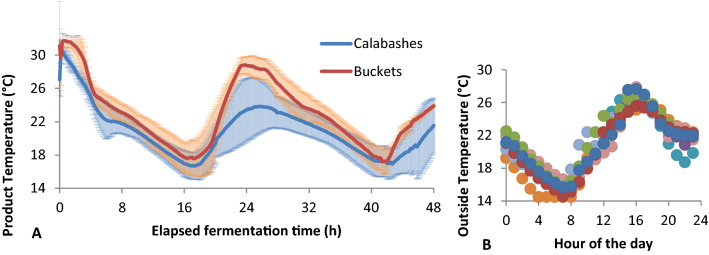
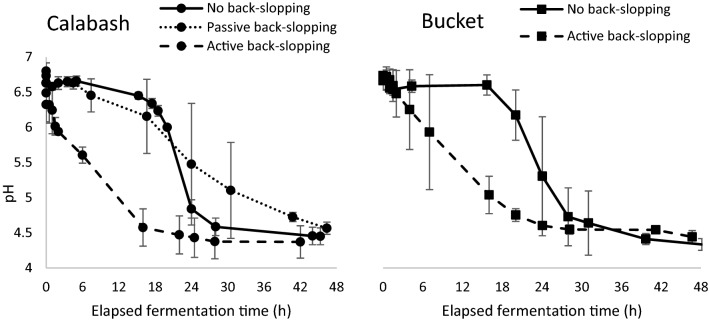
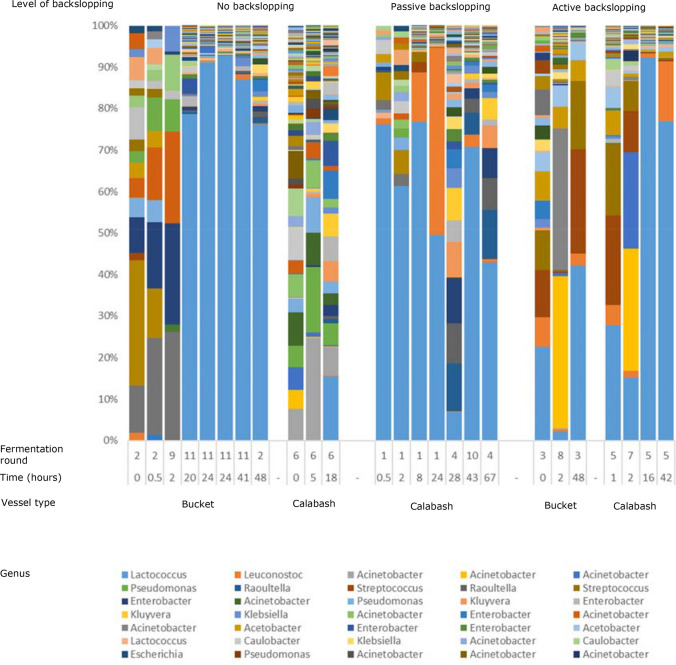
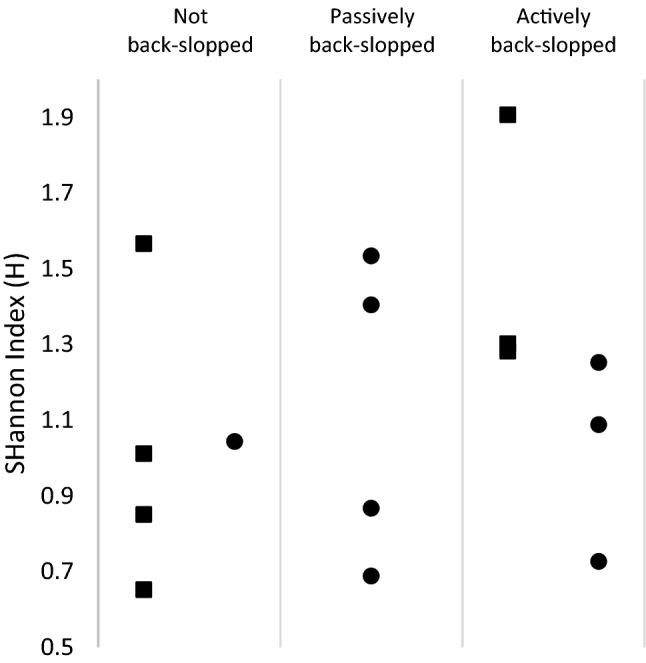
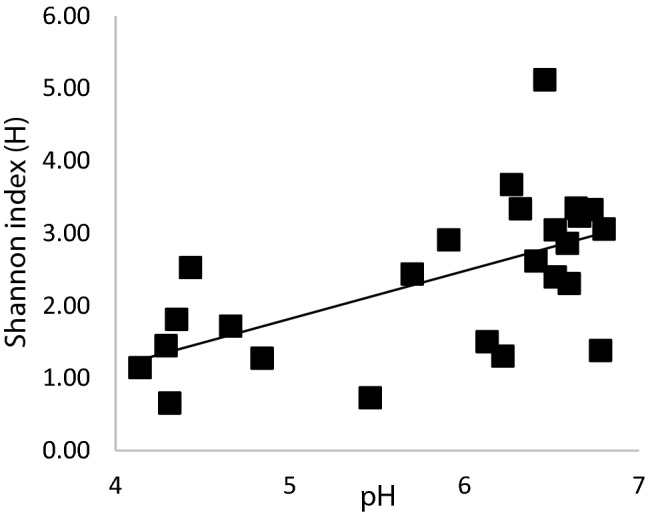
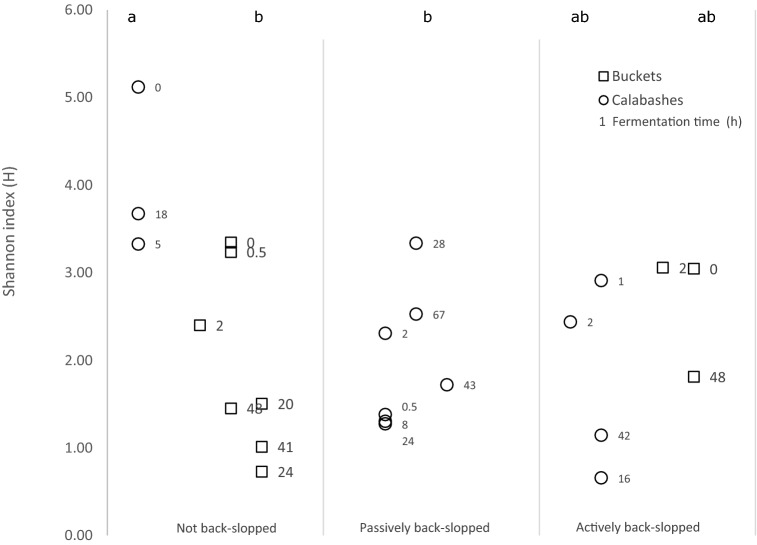
Mabisi is a fermented milk product, traditionally produced in a calabash by uncontrolled fermentation. Due to high costs and a reduced availability of calabashes, nowadays plastic containers are also used for Mabisi production. However, the effect of this change in production practice on the properties of the product has not been documented. Therefore, we aimed at determining the effect of fermentation vessels and types of back-slopping on acidification and microbial communities during fermentation. A series of fifteen experiments using two types of fermentation vessels (plastic buckets and calabashes) in combination with different types of back-slopping (no back-slopping, passive back-slopping, and active back-slopping) were set up at a field site in rural Zambia. In each of the fifteen fermentations we analysed acidification rate of traditional Mabisi fermentation and bacterial diversity over time. No significant difference was found in terms of microbial diversity during and at the end of fermentation between fermentations performed in buckets or previously used calabashes. Bacterial communities in general decreased in diversity over time, where the drop in pH correlated with a decrease in Shannon Index. In case of active back-slopping, the pH drop started right after inoculation while in the no back-slopping and passive back-slopping fermentations, there was a clear lag phase before acidification started. All experimental series resulted in a microbial community dominated by Lactococcus lactis and a Shannon Index, as a measure for diversity, between 0.6 and 2.0. The use of plastic buckets for Mabisi fermentation can be a valuable alternative to the use of calabashes as this study showed no biological and physico-chemical differences between Mabisi resulting from both fermentation vessels, although the reason for perceived differences should be further investigated.

Keywords: Bacterial community; Dairy; Fermentation vessel; Field study; Traditional fermentation.


Conflict of interest statement

All research is performed with respect to international regulations and scientific ethical practices. The authors declare no conflict of interest. Ethical clearance for this study was obtained from ethics committees at the University of Zambia and at Wageningen University.

Figures

Fig. 1
Fig. 1
Set-up of the field-experiments. Panel a In the afternoon the fermentations were started. Active back-slopping was performed using a pipette. The local community showed great interest in the study. b Fermentation was performed in calabashes and plastic buckets, with pH meters and temperature probes attached. At night the containers were put inside the house to prevent temperature drops. c Samples of Mabisi at different stages of fermentation were stabilised on a filter paper
Fig. 2
Fig. 2
Temperature during fermentation a Temperatures measured using a temperature button in the milk during fermentation. Lines show averages of all fermentations using a calabash (blue line) and a bucket (red line). Error bars indicate standard error from the average calculated over 6 fermentations in calabashes and 5 fermentations in buckets. Start of fermentation (t = 0 h) happened at different time of the day for all fermentation but was typically between 1 and 4PM. b Daily air temperatures measured inside the hut where the fermentation vessels were stored at night for the period between 16 and 27th July 2015. Different colours indicate different days. The temperature buttons could not measure below 14 °C
Fig. 3
Fig. 3
Temperature change as a function of volume of milk used for fermentation in calabashes (filled circle) and buckets (filled square). Temperature change is the difference in temperature between the minimal (around 16 h after the start of fermentation) and maximal (around 24 h after the start of fermentation) measurement during the fermentation cycle. Pearson correlation: r =  − 0.568, p = 0.068
Fig. 4
Fig. 4
pH over time during fermentation with no back-slopping and passive and active back-slopping in calabashes and no back-slopping and active back-slopping in buckets
Fig. 5
Fig. 5
Bacterial community structure of representative Mabisi samples during the course of fermentation using different levels of backslopping. Different colours represent different operational taxonomic units (OTUs). Total number of OTUs per sample was taken as 100%. BLAST results to the genus level of the most abundant 21 OTUs are given. *Fermentation round, details in Table 1. **Time after start of fermentation in hours. Some samples could not be included because the field experiment did not allow regular sampling and some samples were lost due to contamination. This figure shows a representative subset of all samples that were analysed. The results of all samples are in Online supplementary material 1
Fig. 6
Fig. 6
Shannon Index of microbial communities at the end of fermentation in calabashes (filled circle) and buckets (filled square). Only one fermentation was performed in a new calabash and due to the smooth inner surface, the possibility for passive back-slopping in buckets was neglected. No significant differences between fermentation could be found, possibly due to lack of statistical power
Fig. 7
Fig. 7
Shannon index (based on OTU) plotted as a function of pH indicated a significant positive correlation between the two. The pH lowered as the fermentation progressed which led to a lower species diversity (Spearman’s correlation coefficient = 0.582, df = 23, p = 0.002)
Fig. 8
Fig. 8
Additional pictures of the field work. Panel (A) In the early afternoon the cows are milked for the second time that day. This milk was used for the fermentations described in this study. The time of milking differed per day and per farmer and was dependent on the other activities on the farm. As the milk was originating from different farmers, also the time between milking and ‘start of fermentation’ was variable. (B) During the experiments, aspects of the study, such as pH measurements, were explained to the interested local community. (C) Milk obtained from the morning milking was brought to the milk collection centre for shipment and sale to a nationwide operating dairy company. (D & E) Temperature and pH was monitored in the fermenting milk in the calabashes. Both temperature and pH probes were positioned in the centre of the fermenting liquid. (F) Fermented Mabisi in a bucket ready for mixing and consumption. Temperature and pH probes were removed and show thickening of the milk. (G) Field laboratory for performing simple analyses and sampling. Here the samples were transferred to the filter paper, the temperature and pH probes were cleaned. (H) During the day all fermentation vessels were placed in the sun to allow temperature increase.
Fig. 9
Fig. 9
Shannon index based on OsTUs as a measure for bacterial diversity during fermentations in buckets (open square) and calabashes (open circle) with and without back-slopping. Number next to data points indicate time after start of fermentation in hours. Different fermentations from one processing method presented next to each other. Letters above the columns indicate significant difference at the 0.05 level taking all samples from one method together. Some samples could not be included because the field experiment did not allow regular sampling and some samples were lost due to contamination

References

    1. Altschul SF, Gish W, Miller W, Myers EW, Lipman DJ. Basic local alignment search tool. J Mol Biol. 1990;215:403–410. doi: 10.1016/S0022-2836(05)80360-2. - DOI - PubMed
    1. Bik HM, Maritz JM, Luong A, Shin H, Dominguez-Bello MG, Carlton JM. Microbial community patterns associated with automated teller machine keypads in New York city. mSphere. 2016;1:e00226–e216. doi: 10.1128/mSphere.00226-16. - DOI - PMC - PubMed
    1. Caporaso JG, et al. QIIME allows analysis of high-throughput community sequencing data. Nat Methods. 2010;7:335. doi: 10.1038/nmeth.f.303. - DOI - PMC - PubMed
    1. Chileshe J, Talsma EF, Schoustra SE, Borgonjen-van den Berg KJ, Handema R, Zwaan BJ, Brouwer ID. Potential contribution of cereal and milk based fermented foods to dietary nutrient intake of 1–5 years old children in Central province in Zambia. PLoS ONE. 2020;15:e0232824. doi: 10.1371/journal.pone.0232824. - DOI - PMC - PubMed
    1. Chileshe J, Van den Heuvel J, Handema R, Zwaan B, Talsma EF, Schoustra SE. Nutritonal composition and microbial communities of two non-alcoholic traditional fermented beverages from Zambia: a study of Mabisi an Munkoyo. Nutrients. 2020;12:1628. doi: 10.3390/nu12061628. - DOI - PMC - PubMed

LinkOut - more resources