. 2020 Nov;25(12):123702.
doi: 10.1117/1.JBO.25.12.123702.

High signal-to-noise ratio reconstruction of low bit-depth optical coherence tomography using deep learning

Affiliations

High signal-to-noise ratio reconstruction of low bit-depth optical coherence tomography using deep learning

Qiangjiang Hao et al. J Biomed Opt. 2020 Nov.

Abstract

Significance: Reducing the bit depth is an effective approach to lower the cost of an optical coherence tomography (OCT) imaging device and increase the transmission efficiency in data acquisition and telemedicine. However, a low bit depth will lead to the degradation of the detection sensitivity, thus reducing the signal-to-noise ratio (SNR) of OCT images.

Aim: We propose using deep learning to reconstruct high SNR OCT images from low bit-depth acquisition.

Approach: The feasibility of our approach is evaluated by applying this approach to the quantized 3- to 8-bit data from native 12-bit interference fringes. We employ a pixel-to-pixel generative adversarial network (pix2pixGAN) architecture in the low-to-high bit-depth OCT image transition.

Results: Extensively, qualitative and quantitative results show our method could significantly improve the SNR of the low bit-depth OCT images. The adopted pix2pixGAN is superior to other possible deep learning and compressed sensing solutions.

Conclusions: Our work demonstrates that the proper integration of OCT and deep learning could benefit the development of healthcare in low-resource settings.

Keywords: computational imaging; deep learning; image and signal reconstruction; ophthalmic imaging; optical coherence tomography.


Figures

Fig. 1
Fig. 1
Method to generate the low bit-depth OCT images.
Fig. 2
Fig. 2
Different bit-depth digital signals correspond to different quality OCT B-scan images.
Fig. 3
Fig. 3
Illustration of the proposed framework for the high SNR reconstruction of the low bit-depth OCT images.
Fig. 4
Fig. 4
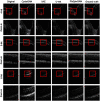
Visual comparison of the original OCT images with different bit depths, their corresponding GAN-reconstructed images, and the enlarged views of the reconstructed images in the red boxes.
Fig. 5
Fig. 5
The PSNR (a), MSSSIM (b), and CORR2 (c) as functions of bit depth. The black boxes represent the values of the original images. The red dots represent the values of the reconstructed images.
Fig. 6
Fig. 6
Visual examples of the low bit-depth OCT reconstruction using different deep learning methods. From left to right: original images, the reconstruction results using the cycleGAN, VAE, U-Net, and the pix2pixGAN adopted in this work, and the ground truth. Rows 1, 3, and 5 are the results using 4-bit, 5-bit, and 6-bit images, respectively, and rows 2, 4, and 6 are their corresponding enlarged views inside the red boxes.
Fig. 7
Fig. 7
Quantitative metrics of the low bit-depth OCT reconstruction using different methods. From top to bottom are the PSNR, MSSSIM, and CORR2 as functions of the bit depth. The left column is the results using deep learning methods. The right column is the results using compressed sensing and sparse representation methods.
Fig. 8
Fig. 8
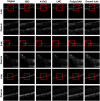
Visual examples of the low bit-depth OCT reconstruction using different sparse representation methods. From left to right: original images, the reconstruction results using the SBD, K-SVD, LMC, and the pix2pixGAN adopted in this work, and the ground truth. Rows 1, 3, and 5 are the results using 4-bit, 5-bit, and 6-bit images, respectively, and rows 2, 4, and 6 are their corresponding enlarged views inside the red boxes.
Fig. 9
Fig. 9
Influence of the (a) batch size, (b) hyperparameter of the L1 loss, (c) epoch number, and (d) learning rate on the results of the deep-learning-based reconstruction. We use the MSSSIM as the quantitative measure, which is derived by comparing the reconstructed image and the 12-bit ground truth.
Fig. 10
Fig. 10
Reconstruction results of using different digital resolutions. From left to right: 256×256  pixels, 512×512  pixels, 1024×1024  pixels, and the ground truth. We also use the 4-bit OCT images for the reconstruction here.
Fig. 11
Fig. 11
The segmentation results of the CSI (red lines) using the original and reconstructed images with different bit depths.
Fig. 12
Fig. 12
The segmentation errors of the original (black) and reconstructed (red) images with the bit depths of 3- to 6-bit. (a) 3 bit, (b) 4 bit, (c) 5 bit, and (d) 6 bit.
Fig. 13
Fig. 13
Schematic of reconstructing high SNR OCT images from low bit-depth signals using deep learning. (a) Converting the low bit-depth signals into OCT images and then using a deep neural network (DNN-1) to generate high SNR OCT images. (b) Directly converting the low bit-depth signals into high SNR images using the DNN-2. (c) Using telecommunication to transmit the low bit-depth interferograms to the servers of medical experts then converting them into OCT images using the DNN-2.

References

    1. Swanson E. A., Fujimoto J. G., “The ecosystem that powered the translation of OCT from fundamental research to clinical and commercial impact [Invited],” Biomed. Opt. Express 8(3), 1638–1664 (2017).BOEICL10.1364/BOE.8.001638 - DOI - PMC - PubMed
    1. Adhi M., Duker J. S., “Optical coherence tomography—current and future applications,” Curr. Opin. Ophthalmol. 24(3), 213 (2013).COOTEF10.1097/ICU.0b013e32835f8bf8 - DOI - PMC - PubMed
    1. Klein T., Huber R., “High-speed OCT light sources and systems [Invited],” Biomed. Opt. Express 8(2), 828–859 (2017).BOEICL10.1364/BOE.8.000828 - DOI - PMC - PubMed
    1. Yanagihara R. T., et al. , “Methodological challenges of deep learning in optical coherence tomography for retinal diseases: a review,” Transl. Vision Sci. Technol. 9(2), 11 (2020).10.1167/tvst.9.2.11 - DOI - PMC - PubMed
    1. Graff C. G., Sidky E. Y., “Compressive sensing in medical imaging,” Appl. Opt. 54(8), C23 (2015).APOPAI10.1364/AO.54.000C23 - DOI - PMC - PubMed

Publication types