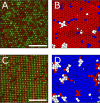
Crystal-to-Crystal Transitions in Binary Mixtures of Soft Colloids
- PMID: 33191738
- PMCID: PMC7690049
- DOI: 10.1021/acsnano.0c03966
Crystal-to-Crystal Transitions in Binary Mixtures of Soft Colloids
Abstract
In this article, we demonstrate a method for inducing reversible crystal-to-crystal transitions in binary mixtures of soft colloidal particles. Through a controlled decrease of salinity and increasingly dominating electrostatic interactions, a single sample is shown to reversibly organize into entropic crystals, electrostatic attraction-dominated crystals, or aggregated gels, which we quantify using microscopy and image analysis. We furthermore analyze crystalline structures with bond order analysis to discern between two crystal phases. We observe the different phases using a sample holder geometry that allows both in situ salinity control and imaging through confocal laser scanning microscopy and apply a synthesis method producing particles with high resolvability in microscopy with control over particle size. The particle softness provides for an enhanced crystallization speed, while altering the re-entrant melting behavior as compared to hard sphere systems. This work thus provides several tools for use in the reproducible manufacture and analysis of binary colloidal crystals.
Keywords: binary colloidal crystals; colloidal particles; crystal transitions; phase transitions; soft colloids; tunable materials.
Conflict of interest statement
The authors declare no competing financial interest.
Figures


Similar articles
-
Automated preparation method for colloidal crystal arrays of monodisperse and binary colloid mixtures by contact printing with a pintool plotter.Langmuir. 2007 Mar 13;23(6):3478-84. doi: 10.1021/la063122z. Epub 2007 Feb 2. Langmuir. 2007. PMID: 17269810
-
Work hardening in colloidal crystals.Nature. 2024 Jun;630(8017):648-653. doi: 10.1038/s41586-024-07453-6. Epub 2024 May 29. Nature. 2024. PMID: 38811735 Free PMC article.
-
Influence of Softness on the Stability of Binary Colloidal Crystals.ACS Nano. 2019 Dec 24;13(12):13829-13842. doi: 10.1021/acsnano.9b04274. Epub 2019 Nov 15. ACS Nano. 2019. PMID: 31692332
-
Tunable colloids: control of colloidal phase transitions with tunable interactions.Soft Matter. 2007 Aug 14;3(9):1099-1115. doi: 10.1039/b704251p. Soft Matter. 2007. PMID: 32900031 Review.
-
Binary colloidal crystals (BCCs): Interactions, fabrication, and applications.Adv Colloid Interface Sci. 2018 Nov;261:102-127. doi: 10.1016/j.cis.2018.08.005. Epub 2018 Aug 23. Adv Colloid Interface Sci. 2018. PMID: 30243666 Review.
Cited by
-
Kinetic pathways of solid-solid phase transitions dictated by short-range interactions.Proc Natl Acad Sci U S A. 2025 Jul 29;122(30):e2507403122. doi: 10.1073/pnas.2507403122. Epub 2025 Jul 23. Proc Natl Acad Sci U S A. 2025. PMID: 40699926
-
Direct observation of phase transitions in truncated tetrahedral microparticles under quasi-2D confinement.Nat Commun. 2024 Mar 25;15(1):1954. doi: 10.1038/s41467-024-46230-x. Nat Commun. 2024. PMID: 38528038 Free PMC article.
-
In situ observation of coalescence of nuclei in colloidal crystal-crystal transitions.Nat Commun. 2023 Aug 15;14(1):4905. doi: 10.1038/s41467-023-40627-w. Nat Commun. 2023. PMID: 37582924 Free PMC article.
-
ArGSLab: a tool for analyzing experimental or simulated particle networks.Soft Matter. 2021 Sep 22;17(36):8354-8362. doi: 10.1039/d1sm00692d. Soft Matter. 2021. PMID: 34550148 Free PMC article.
References
-
- Frenkel D. Soft Condensed Matter. Phys. A 2002, 313, 1–31. 10.1016/S0378-4371(02)01032-4. - DOI
-
- Lekkerkerker H. N. W.; Poon W. C. K.; Pusey P. N.; Stroobants A.; Warren P. B. Phase Behaviour of Colloid + Polymer Mixtures. Europhys. Lett. 1992, 20, 559–564. 10.1209/0295-5075/20/6/015. - DOI
-
- Senff H.; Richtering W. Temperature Sensitive Microgel Suspensions: Colloidal Phase Behavior and Rheology of Soft Spheres. J. Chem. Phys. 1999, 111, 1705–1711. 10.1063/1.479430. - DOI
LinkOut - more resources
Full Text Sources

