Review
. 2019 Apr 17;52(16):163001.
doi: 10.1088/1361-6463/ab0261. Epub 2019 Feb 18.

NanoJ: a high-performance open-source super-resolution microscopy toolbox

Affiliations
Review

NanoJ: a high-performance open-source super-resolution microscopy toolbox

Romain F Laine et al. J Phys D Appl Phys. .

Abstract

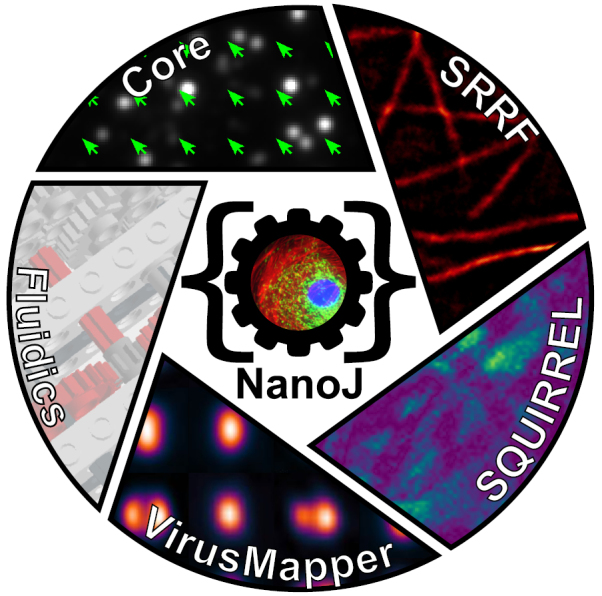
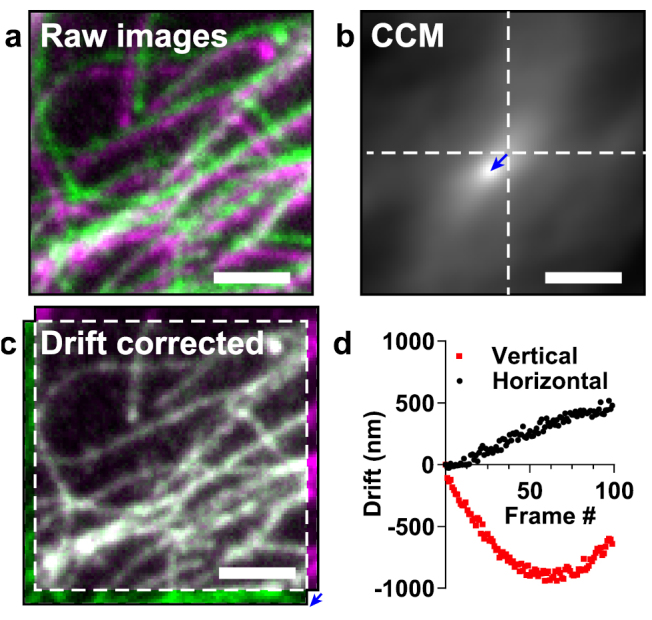
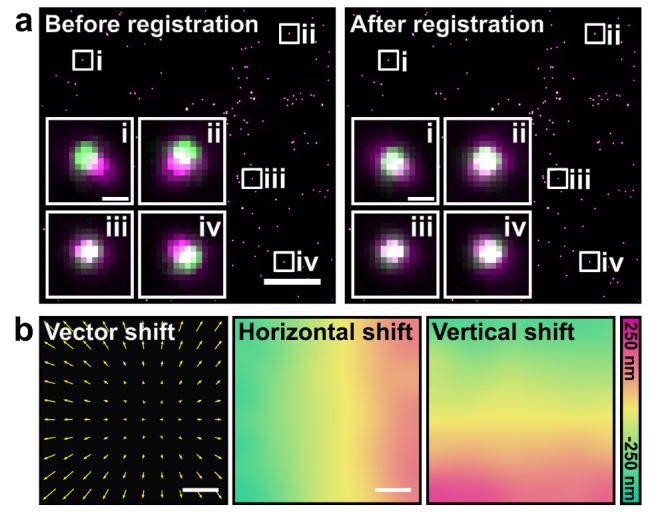
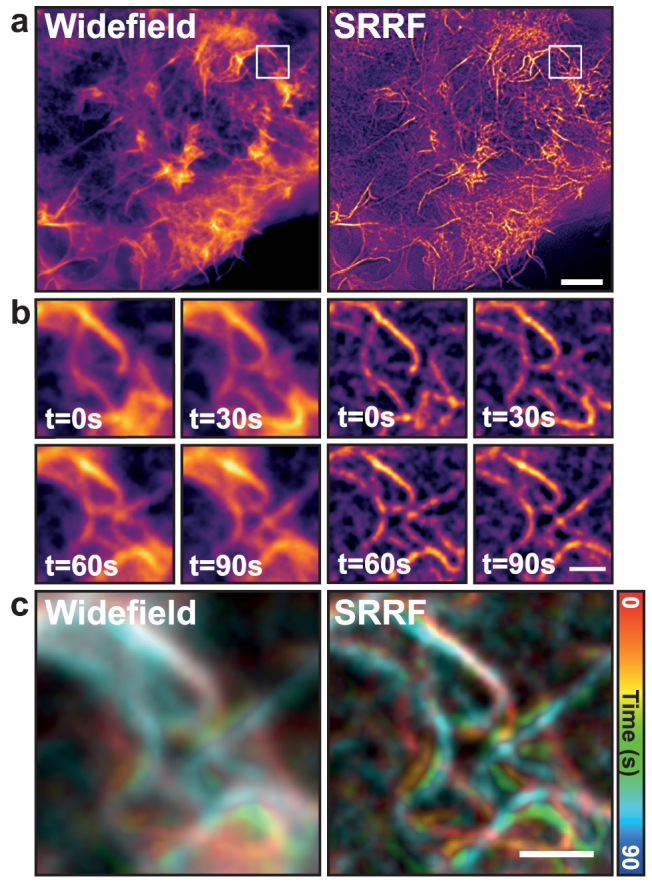
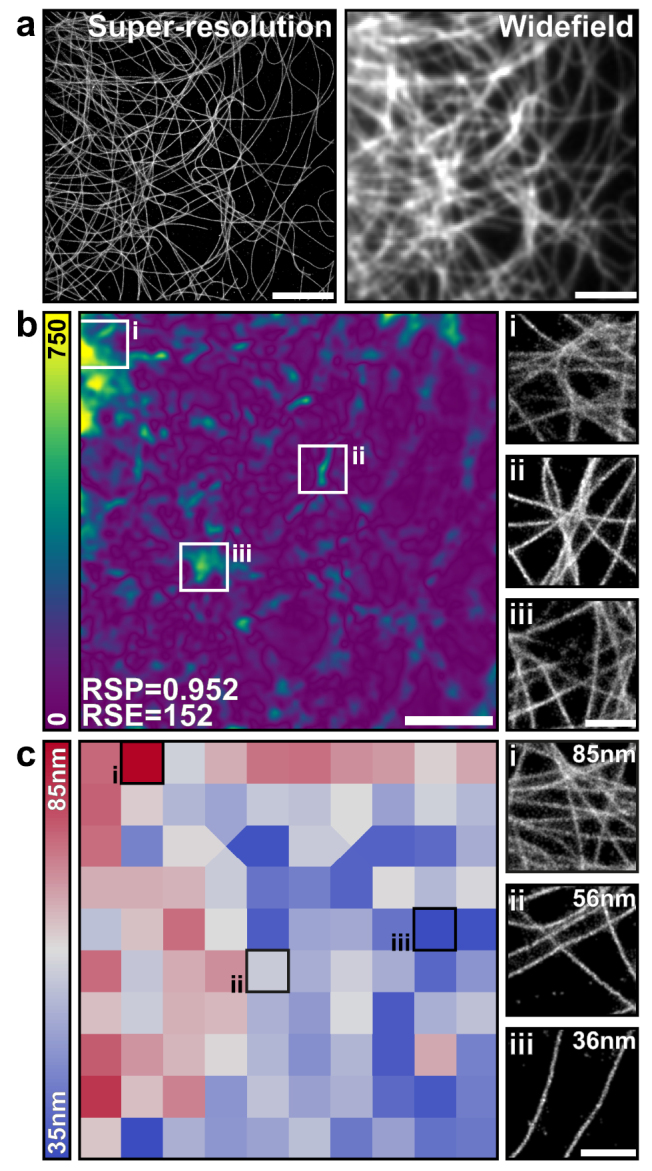
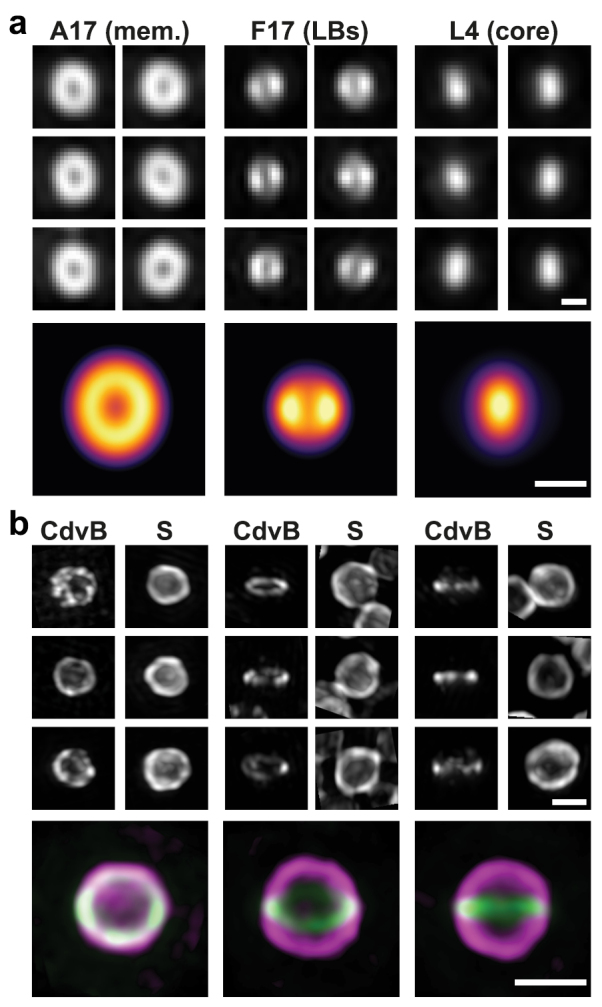
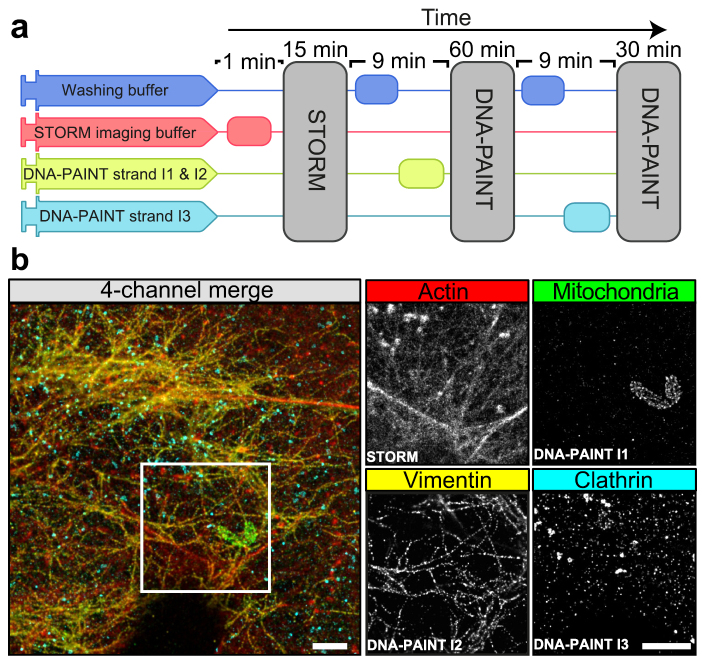
Super-resolution microscopy (SRM) has become essential for the study of nanoscale biological processes. This type of imaging often requires the use of specialised image analysis tools to process a large volume of recorded data and extract quantitative information. In recent years, our team has built an open-source image analysis framework for SRM designed to combine high performance and ease of use. We named it NanoJ-a reference to the popular ImageJ software it was developed for. In this paper, we highlight the current capabilities of NanoJ for several essential processing steps: spatio-temporal alignment of raw data (NanoJ-Core), super-resolution image reconstruction (NanoJ-SRRF), image quality assessment (NanoJ-SQUIRREL), structural modelling (NanoJ-VirusMapper) and control of the sample environment (NanoJ-Fluidics). We expect to expand NanoJ in the future through the development of new tools designed to improve quantitative data analysis and measure the reliability of fluorescent microscopy studies.

Keywords: Fiji; ImageJ; fluidics; image analysis; image quality assessment; single-particle analysis; super-resolution microscopy.


Figures

Figure 1.
Figure 1.
NanoJ framework. Currently NanoJ consists of five modules dedicated to super-resolution imaging and analysis.
Figure 2.
Figure 2.
Drift correction with NanoJ-Core. (a) Composite image of two frames from a time-lapse dataset of the same field-of-view. An artificially large drift was applied computationally in order to make it visible for figure rendering. (b) Cross-correlation matrix (CCM) between the two frames shown in (a). The vector position of the maximum indicates the linear shift between the two frames. (c) Overlay of the two frames after drift correction using NanoJ-Core. (d) Vertical and horizontal drift curves obtained using NanoJ-Core from the 100-frame raw data. The two images shown in (a) correspond to the frames 0 (green) and 97 (magenta) of the raw data.
Figure 3.
Figure 3.
Multi-colour channel registration with NanoJ-Core. (a) Composite image of multi-colour TetraSpeck beads imaged in two different channels (‘GFP-channel’ indicated in green and ‘mCherry-channel’ in magenta), prior to (left) and after (right) channel registration using NanoJ-Core. Insets—individual beads from indicated locations. Scale bars: 25 µm, insets: 0.5 µm. (b) Vectorial representation of the shift between the two channels (left, displacement vector length 50 times larger for representation purposes), horizontal (middle) and vertical (right) shift maps obtained and applied to the data shown in (a). Scale bars: 25 µm.
Figure 4.
Figure 4.
Live-cell SRM with NanoJ-SRRF. (a) Comparison of widefield (left) and SRRF reconstruction (right) obtained from a COS-7 cell expressing UtrCH-GFP to label actin filaments. Scale bar: 5 µm. (b) Time-course of the inset shown in (a), obtained from a continuous imaging at 30 ms exposure (33.3 Hz) and displayed every 30 s. Scale bar: 1 µm. (c) Colour-coded time course dataset from (b). Scale bar: 1 µm.
Figure 5.
Figure 5.
Quality assessment and resolution mapping with NanoJ-SQUIRREL. (a) A super-resolution rendering (left) and acquired widefield image (right) of fixed microtubules labelled with Alexa Fluor-647. (b) Left: SQUIRREL error map highlighting discrepancies between the super-resolution and diffraction-limited images in (a). Right: magnified insets of super-resolution rendering at indicated positions on error map. (c) Left: SQUIRREL resolution map of the super-resolution image in (a). Right: magnified insets of super-resolution rendering for indicated resolution blocks. Whole image scale bars  =  5 µm, inset scale bars  =  1 µm.
Figure 6.
Figure 6.
Quantitative SPA-based modelling with NanoJ-VirusMapper. (a) Top: aligned SIM images of individual vaccinia particles labelled for L4 (core), F17 (LBs) and A17 (membrane, mem.). Bottom: VirusMapper models of the three channels. Scale bars: 200 nm. (b) Top: aligned SIM images of individual Sulfolobus acidocaldarius cells labelled for the S-layer (S) and the archaeal ESCRT-III homolog CdvB (CdvB). Bottom: VirusMapper models of three different orientations of the cells; magenta—S-layer, green—CdvB. Scale bars: 1 µm.
Figure 7.
Figure 7.
Automated DNA-PAINT and STORM imaging. (a) NanoJ-Fluidics workflow used for multi-color STORM and DNA-PAINT imaging. (b) Left: 4-channel merge of STORM and DNA-PAINT with actin (red, STORM), mitochondria (green, DNAPAINT I1 strand), vimentin (yellow, DNA-PAINT I2 strand) and clathrin (cyan, DNAPAINT I3 strand). Right: single-channel images from the inset. Scale bars: 2 µm.

References

    1. Rino J, Braga J, Henriques R, Carmo-Fonseca M. Frontiers in fluorescence microscopy. Int. J. Dev. Biol. 2009;53:1569–79. doi: 10.1387/ijdb.072351jr. - DOI - PubMed
    1. Wheeler A, Henriques R. Standard and Super-Resolution Bioimaging Data Analysis: A Primer. New York: Wiley; 2017.
    1. Betzig E, et al. Imaging intracellular fluorescent proteins at nanometer resolution (SOM) Science. 2006;313:1642–6. doi: 10.1126/science.1127344. - DOI - PubMed
    1. Rust M J, Bates M, Zhuang X. Sub-diffraction-limit imaging by stochastic optical reconstruction microscopy (STORM) Nat. Methods. 2006;3:793–6. doi: 10.1038/nmeth929. - DOI - PMC - PubMed
    1. Hell S W, Wichmann J. Breaking the diffraction resolution limit by stimulated emission: stimulated-emission-depletion fluorescence microscopy. Opt. Lett. 1994;19:780. doi: 10.1364/OL.19.000780. - DOI - PubMed