. 2020 Nov 6:13:11377-11395.
doi: 10.2147/OTT.S271417. eCollection 2020.

Comprehensive Analysis of Aberrantly Expressed Competitive Endogenous RNA Network and Identification of Prognostic Biomarkers in Pheochromocytoma and Paraganglioma

Affiliations

Comprehensive Analysis of Aberrantly Expressed Competitive Endogenous RNA Network and Identification of Prognostic Biomarkers in Pheochromocytoma and Paraganglioma

Zijun Wang et al. Onco Targets Ther. .

Abstract

Background: Long non-coding RNA (lncRNA) functions as a competitive endogenous RNA (ceRNA) and plays an important role in the biological processes underlying tumorigenesis. However, studies describing the function of lncRNA in pheochromocytoma and paraganglioma (PCPG) remain largely unknown. Our study aims to construct a regulatory ceRNA network and explore prognostic biomarkers for PCPG through a comprehensive analysis.

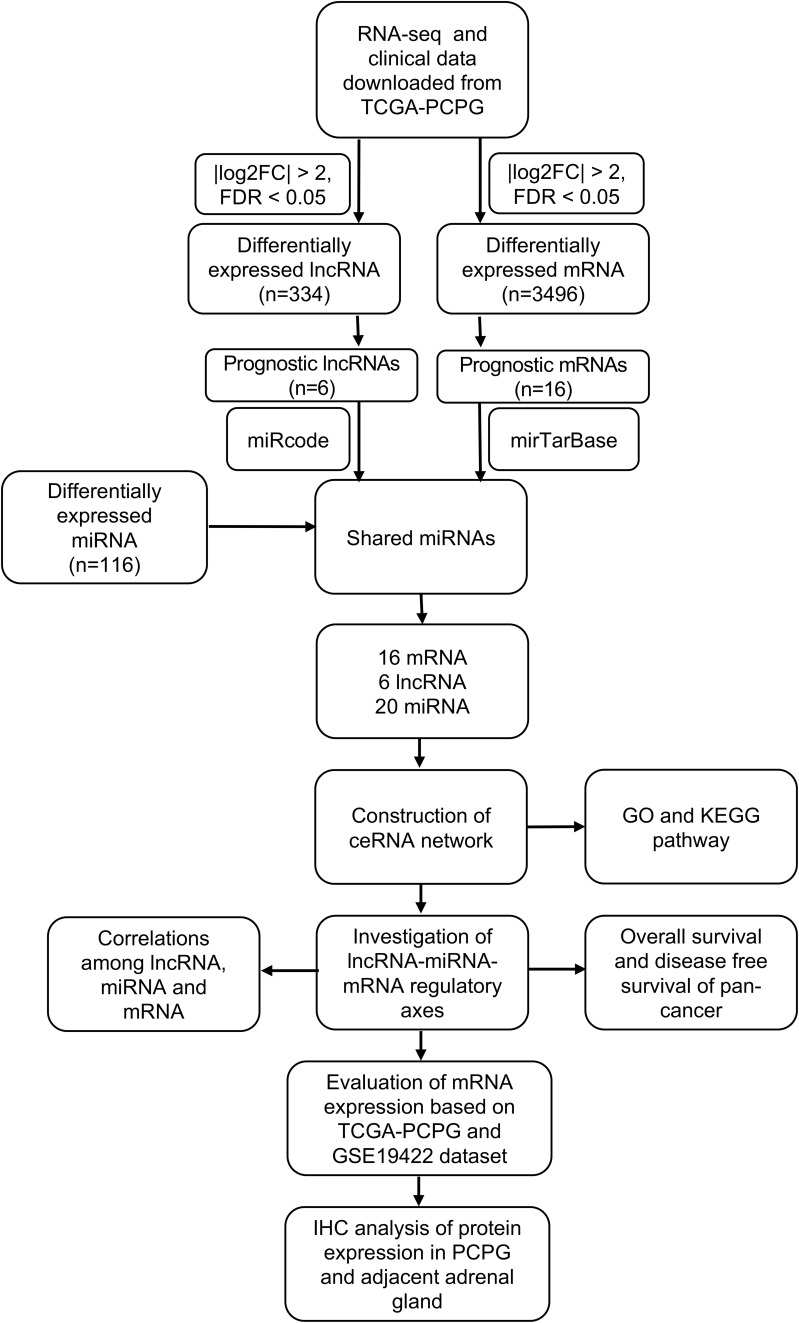
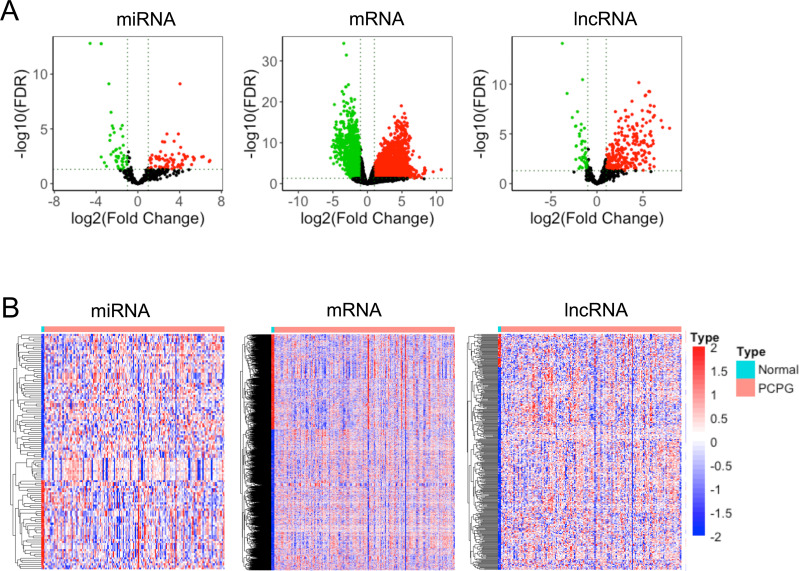
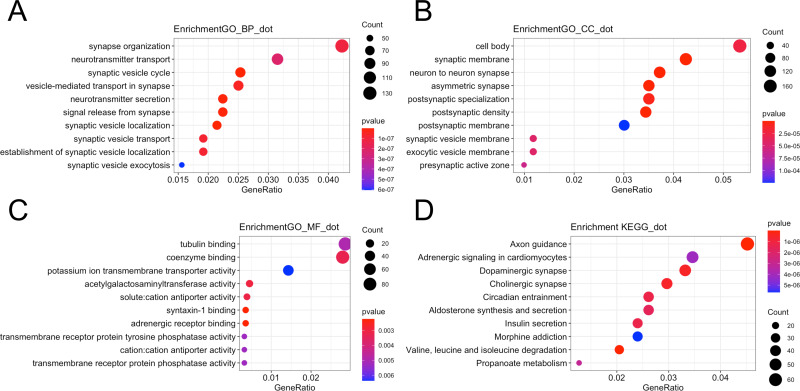
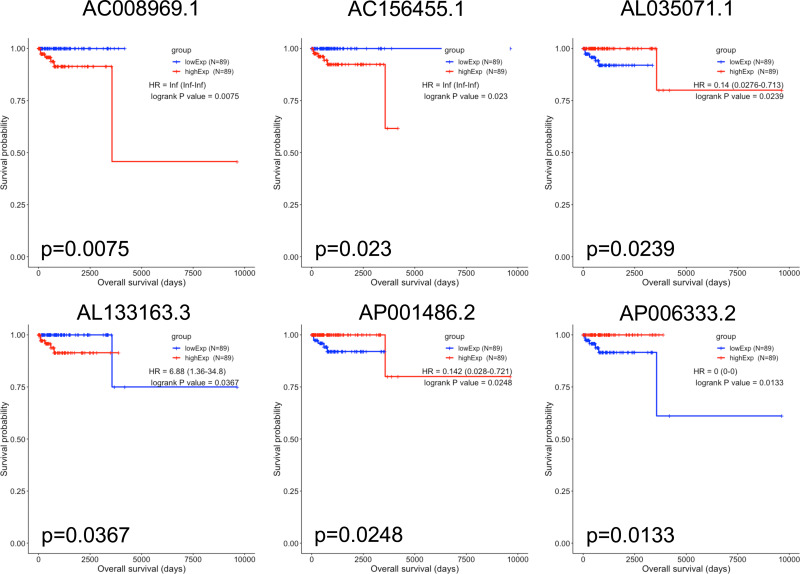
Methods: PCPG data from The Cancer Genome Atlas (TCGA) were utilized to obtain differentially expressed lncRNAs (DElncRNAs), microRNAs (DEmiRNAs), and mRNAs (DEmRNAs). Kaplan-Meier analysis was used to detect prognostic biomarkers and Cytoscape was utilized to construct a regulatory network of ceRNA. Potential lncRNA-miRNA-mRNA axes were inferred by correlation analysis. GO and KEGG pathways were constructed using "clusterProfiler" and "DOSE" R-packages. Immunohistochemistry (IHC) staining was performed to validate differential protein expression levels of genes in the axes. Finally, the GSE19422 dataset and Pan-Cancer data were applied to validate the expression pattern and survival status of mRNAs, respectively.

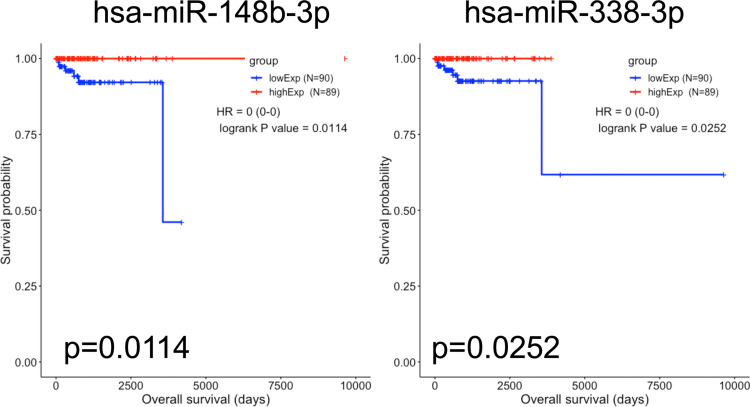
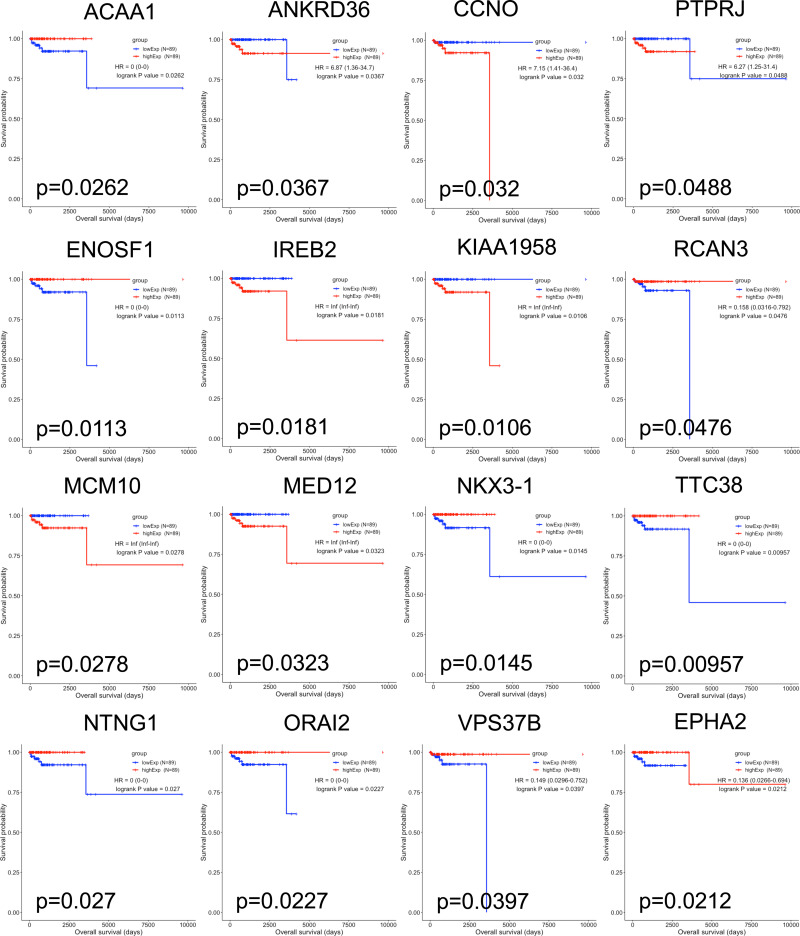
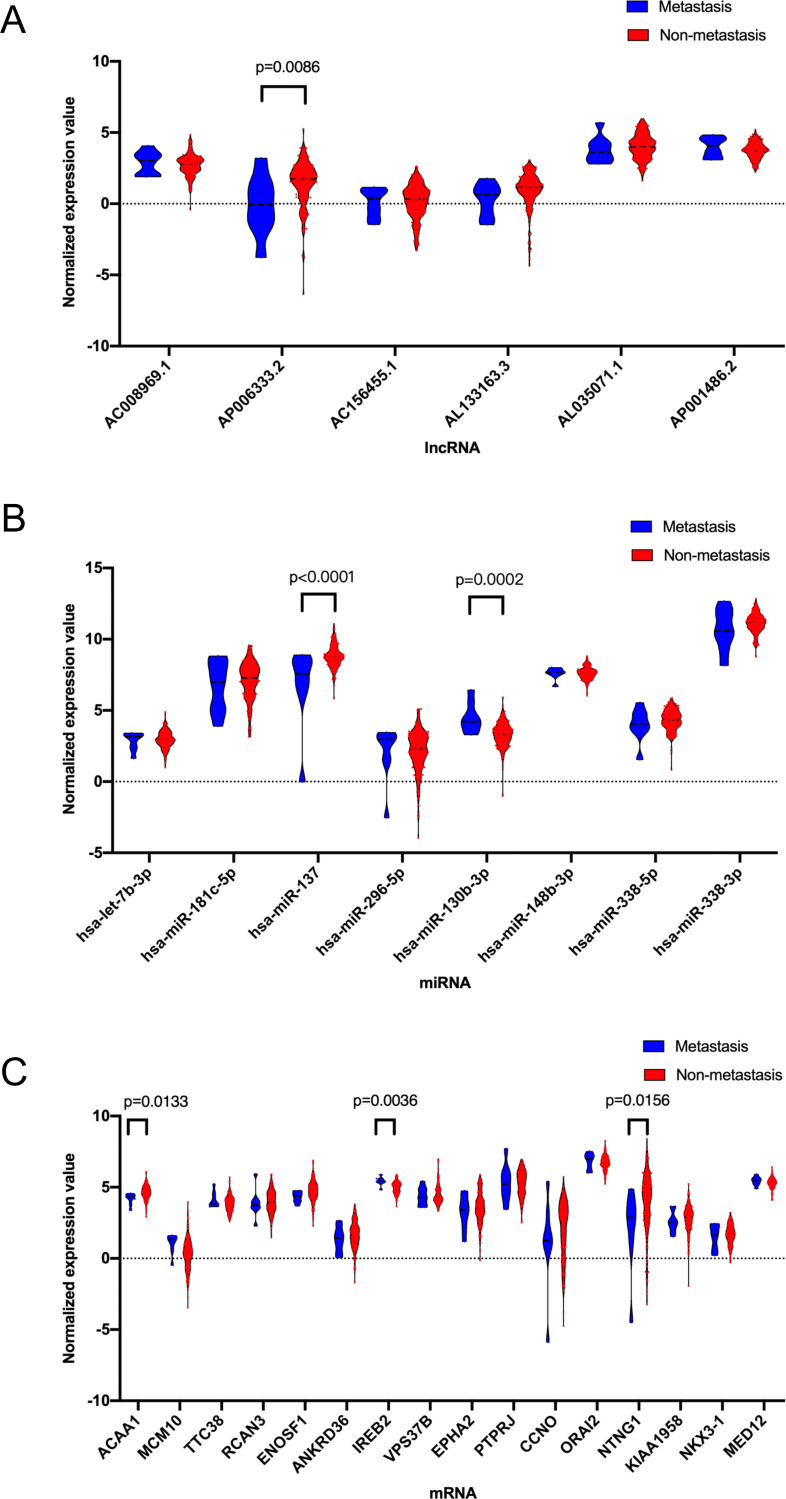
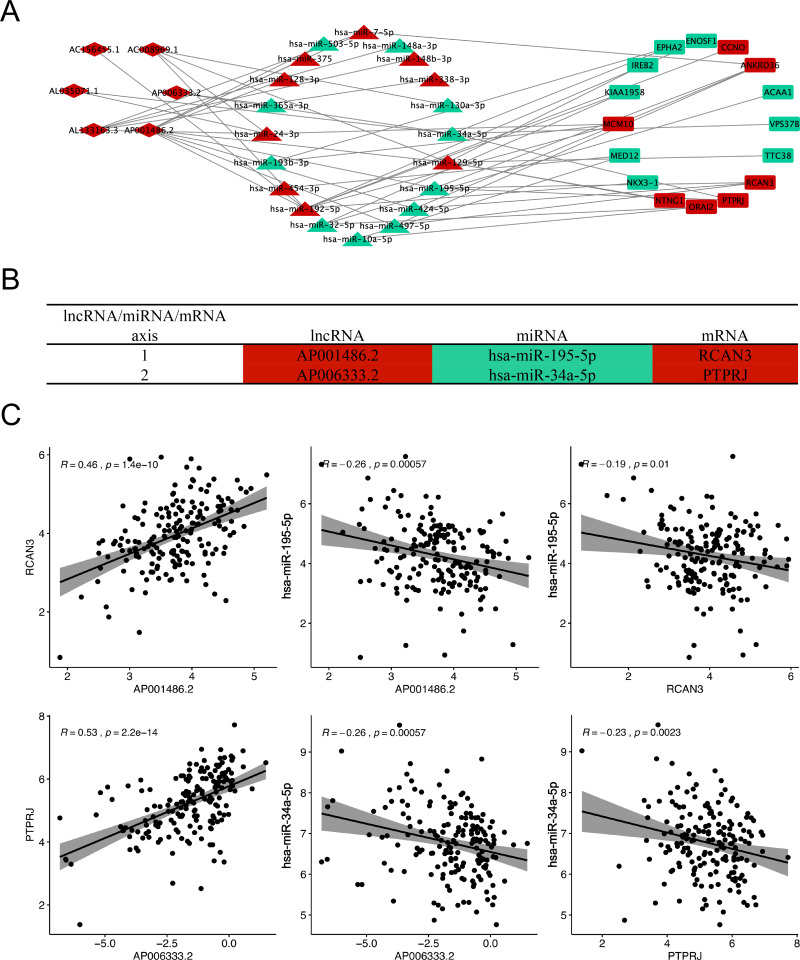
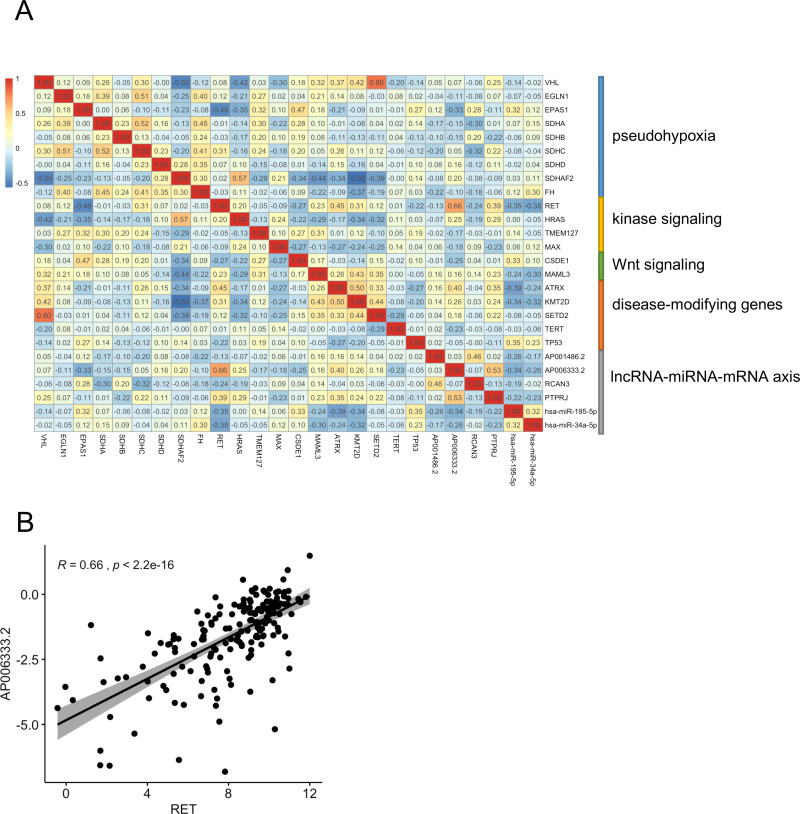
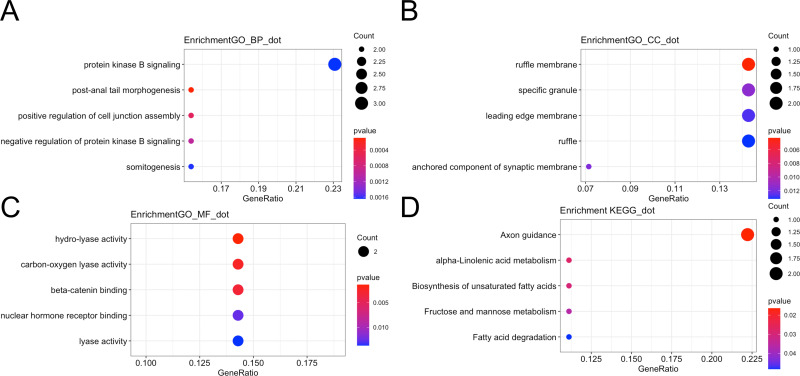
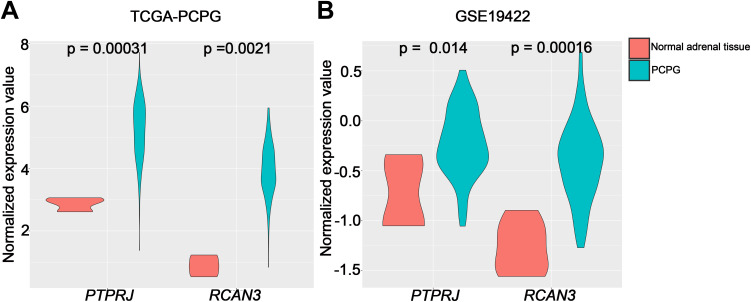
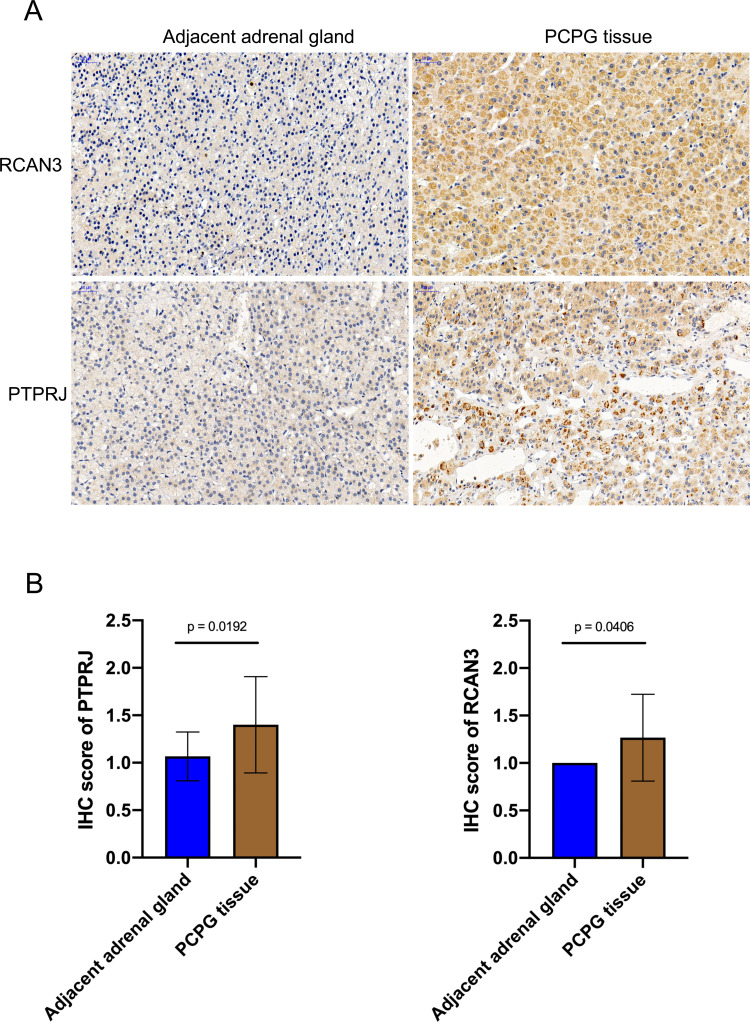
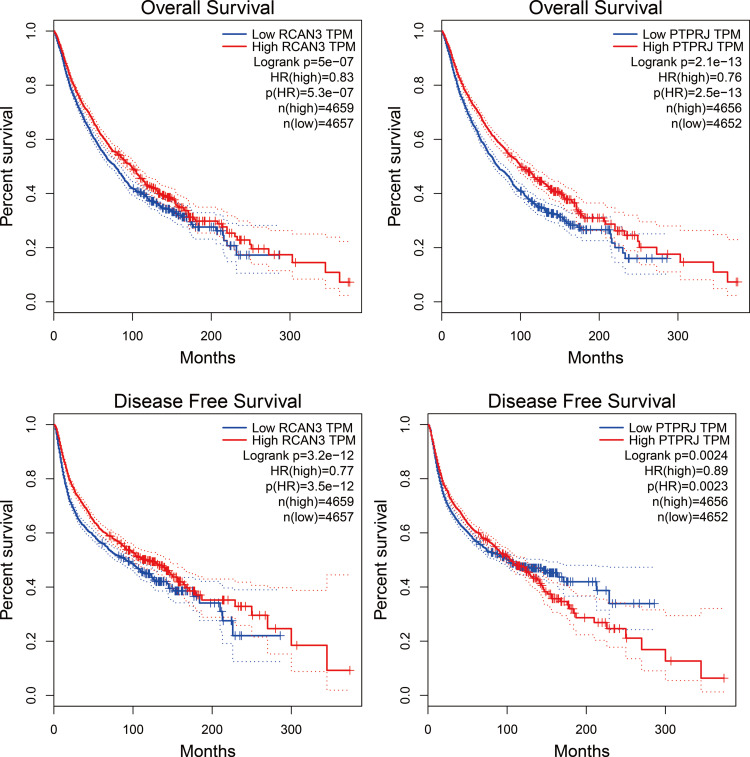
Results: A total of 334 DElncRNAs, 116 DEmiRNAs, and 3496 DEmRNAs were identified and mainly enriched in hormone secretion, metabolism signaling, metastatic and proliferative pathways. Among these differentially expressed genes, 16 mRNAs, six lncRNAs, and two miRNAs were associated with overall survival of patients with PCPG and sequentially enrolled in the ceRNA network. Two lncRNA-miRNA-mRNA regulatory axes were predicted: AP001486.2/hsa-miR-195-5p/RCAN3 and AP006333.2/hsa-miR-34a-5p/PTPRJ. The GSE19422 dataset and IHC analysis validated that mRNA and protein levels of RCAN3 and PTPRJ were upregulated in PCPG tissues compared with adjacent adrenal gland medulla tissues. Pan-Cancer data showed that the upregulated expression of RCAN3 and PTPRJ was associated with favorable overall survival and disease-free survival.

Conclusion: A regulatory lncRNA-miRNA-mRNA ceRNA network was successfully constructed and 24 prognostic biomarkers were identified for PCPG patients. These findings may contribute toward a better understanding of the biological mechanism of tumorigenesis and enable further evaluation of the prognosis of patients with PCPG.

Keywords: ceRNA network; pheochromocytoma and paraganglioma (PCPG); prognostic biomarker.


Conflict of interest statement

The authors declare that they have no conflict of interest.

Figures

Figure 1
Figure 1
Workflow of the study.
Figure 2
Figure 2
Differentially expressed miRNAs, mRNAs, and lncRNAs in tumor and normal adrenal gland tissues. (A) Volcano plots of miRNAs, mRNAs, and lncRNAs. Red: upregulated in tumor tissues. Green: upregulated in normal adrenal gland tissues. (B) Heatmap of differentially expressed lncRNAs (334 lncRNAs), differentially expressed mRNAs (3496 genes), and differentially expressed miRNAs (116 miRNAs).
Figure 3
Figure 3
GO and KEGG pathways enriched in tumor tissues. (A) The top 10 enriched biological processes of differentially expressed genes. (B) The top 10 enriched cellular components of differentially expressed genes. (C) The top 10 enriched molecular functions of differentially expressed genes. (D) Bubble plot showing the top 10 enriched pathways.
Figure 4
Figure 4
Kaplan–Meier survival curves for six differentially expressed long non-coding RNAs associated with overall survival in pheochromocytoma and paraganglioma. Six DElncRNAs are presented (p<0.05): AC008969.1, AC156455.1, AL035071.1, AL133163.3, AP001486.2, and AP006333.2. The initial pathological diagnosis of patients was set as day 0. Horizontal axis represents overall survival time (days) and vertical axis represents survival probability.
Figure 5
Figure 5
Kaplan–Meier survival curves for two differentially expressed miRNAs associated with overall survival in pheochromocytoma and paraganglioma. Two DEmiRNAs are presented (p<0.05): hsa-miR-148b-3p and hsa-miR-338-3p. The initial pathological diagnosis of patients was set as day 0. Horizontal axis represents overall survival time (days) and vertical axis represents survival probability.
Figure 6
Figure 6
Kaplan–Meier survival curves for 16 differentially expressed mRNAs associated with overall survival in pheochromocytoma and paraganglioma. Sixteen DEmRNAs are presented (p<0.05): ACAA1, ANKRD36, CCNO, PTPRJ, ENOSF1, IREB2, KIAA1958, RCAN3, MCM10, MED12, NKX3-1, TTC38, NTNG1, ORAI2, VPS378, and EPHA2. The initial pathological diagnosis of patients was set as day 0. Horizontal axis represents overall survival time (days) and vertical axis represents survival probability.
Figure 7
Figure 7
Different expression of prognostic biomarkers between metastatic and non-metastatic PCPG patients. (A) Expression of lncRNA between metastatic and non-metastatic PCPG patients. (B) Expression of miRNA between metastatic and non-metastatic PCPG patients. (C) Expression of mRNA between metastatic and non-metastatic PCPG patients.
Figure 8
Figure 8
ceRNA network and regulatory axes. (A) A regulatory lncRNA–miRNA–mRNA ceRNA network in PCPG patients. Red: downregulated. Green: upregulated. Diamond shape: lncRNA. Rounded rectangle: miRNA. Triangle: mRNA. ceRNA: competitive endogenous RNA; PCPG: pheochromocytoma and paraganglioma. (B) Two lncRNA–miRNA–mRNA axes in the ceRNA network. (C) The expression of AP001486.2 was positively correlated with RCAN3 (R=0.46, p=1.4×10⁻¹⁰), whereas the expression of AP006333.2 was positively correlated with PTPRJ (R=0.53, p=2.2×10⁻¹⁴). The expression of hsa-miR-195-5p was negatively correlated with RCAN3 (R=−0.19, p=0.01) and AP001486.2 (R=−0.26, p=0.00057), whereas the expression of hsa-miR-34a-5p was negatively correlated with PTPRJ (R=−0.23, p=0.0023) and AP006333.2 (R=−0.26, p=0.00057).
Figure 9
Figure 9
Correlations between PCPG genotypes and lncRNA–miRNA–mRNA axes. (A) Correlation heatmap of susceptibility genes and lncRNA–miRNA–mRNA axes genes. (B) Correlation plot between RET and AP006333.2.
Figure 10
Figure 10
Enriched GO and KEGG pathways in the ceRNA network. (A) The top 5 enriched biological processes of the ceRNA network. (B) The top 5 enriched cellular components of the ceRNA network. (C) The top 5 enriched molecular functions of the ceRNA network. (D) Bubble plot showing the top 5 enriched pathways of the ceRNA network.
Figure 11
Figure 11
PTPRJ and RCAN3 mRNA expression in TCGA and GSE19422 dataset. (A) PTPRJ and RCAN3 mRNA expression levels in PCPG were compared to normal adrenal gland tissue samples based on TCGA-PCPG database. (B) PTPRJ and RCAN3 mRNA expression levels in PCPG were compared to normal adrenal gland tissue levels based on the GSE19422 dataset.
Figure 12
Figure 12
Immunohistochemistry (IHC) analysis of protein expression of RCAN3 and PTPRJ in adjacent adrenal gland and PCPG tissues. (A) IHC results of RCAN3 and PTPRJ protein expression in adjacent adrenal gland and PCPG tissues. (B) Histogram of protein expression of RCAN3 and PTPRJ indicating that they were both upregulated in PCPG tissue compared with adjacent adrenal gland tissues. Scale bar, 50 µm.
Figure 13
Figure 13
Overall survival and disease-free survival of RCAN3 and PTPRJ mRNA expression in Pan-Cancer.

Similar articles

Cited by

References

    1. Pang Y, Liu Y, Pacak K, Yang C. Pheochromocytomas and paragangliomas: from genetic diversity to targeted therapies. Cancers (Basel). 2019;11(4):436. doi:10.3390/cancers11040436 - DOI - PMC - PubMed
    1. Welander J, Andreasson A, Juhlin CC, et al. Rare germline mutations identified by targeted next-generation sequencing of susceptibility genes in pheochromocytoma and paraganglioma. J Clin Endocrinol Metab. 2014;99(7):E1352–60. doi:10.1210/jc.2013-4375 - DOI - PMC - PubMed
    1. Fishbein L, Leshchiner I, Walter V, et al. Comprehensive molecular characterization of pheochromocytoma and paraganglioma. Cancer Cell. 2017;31(2):181–193. doi:10.1016/j.ccell.2017.01.001 - DOI - PMC - PubMed
    1. Calsina B, Castro-Vega LJ, Torres-Perez R, et al. Integrative multi-omics analysis identifies a prognostic miRNA signature and a targetable miR-21-3p/TSC2/mTOR axis in metastatic pheochromocytoma/paraganglioma. Theranostics. 2019;9(17):4946–4958. doi:10.7150/thno.35458 - DOI - PMC - PubMed
    1. Dhamija S, Diederichs S. From junk to master regulators of invasion: lncRNA functions in migration, EMT and metastasis. Int J Cancer. 2016;139(2):269–280. doi:10.1002/ijc.30039 - DOI - PubMed