. 2020 Oct 29:14:832.
doi: 10.3389/fnins.2020.00832. eCollection 2020.

Dexmedetomidine - Commonly Used in Functional Imaging Studies - Increases Susceptibility to Seizures in Rats But Not in Wild Type Mice

Affiliations

Dexmedetomidine - Commonly Used in Functional Imaging Studies - Increases Susceptibility to Seizures in Rats But Not in Wild Type Mice

Aleksandra Bortel et al. Front Neurosci. .

Abstract

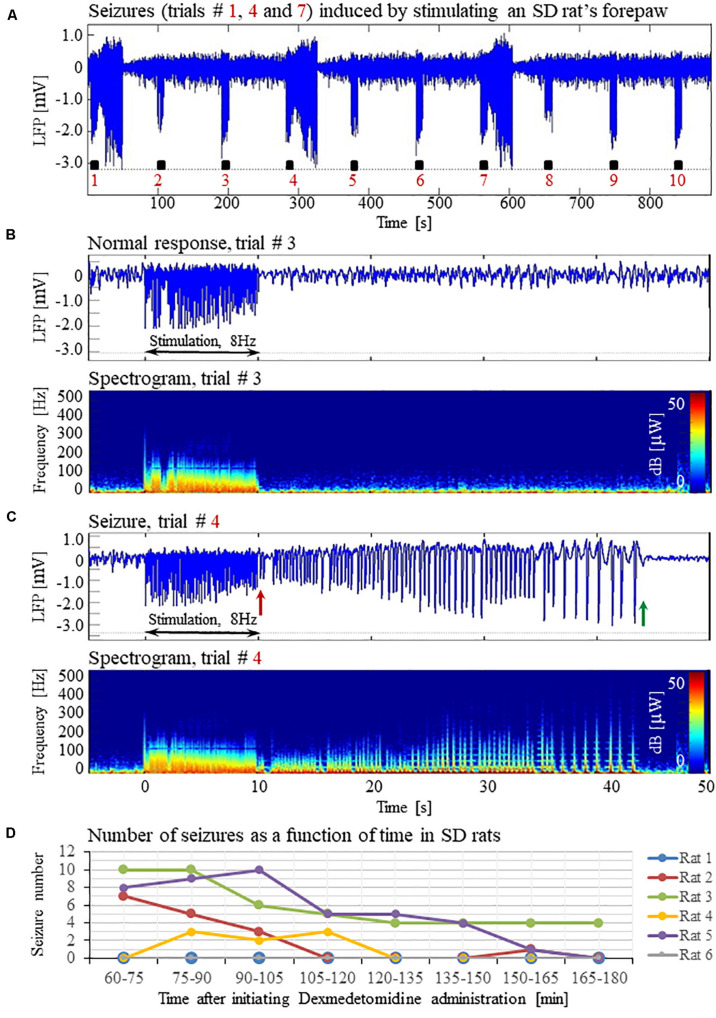
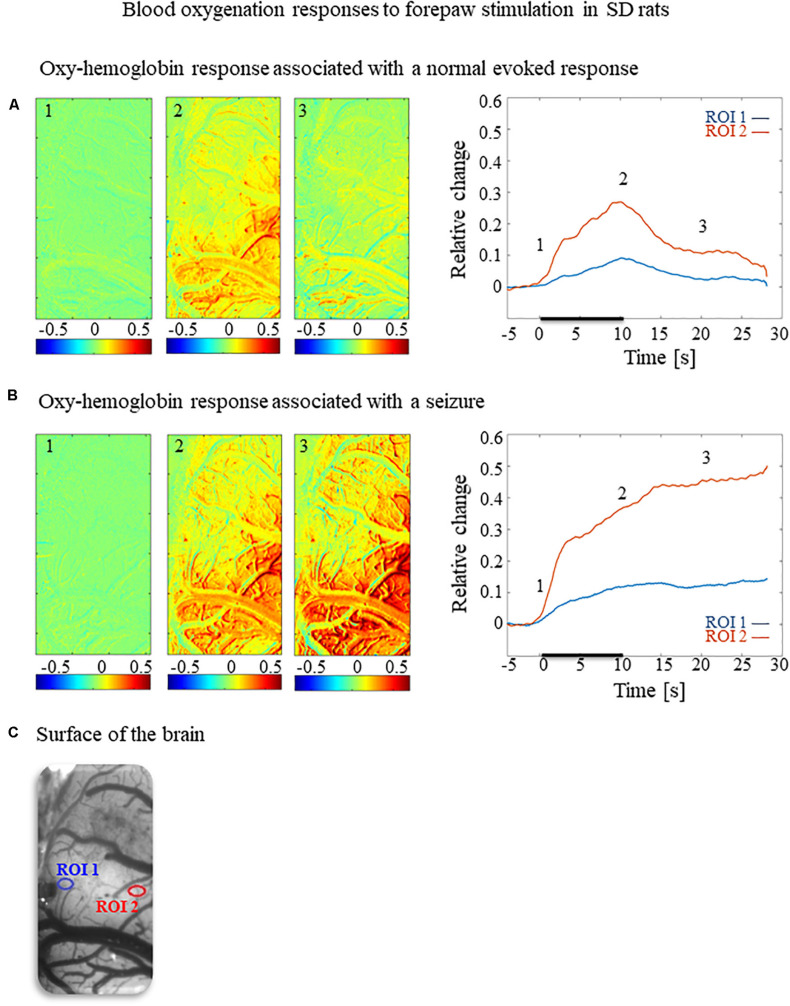
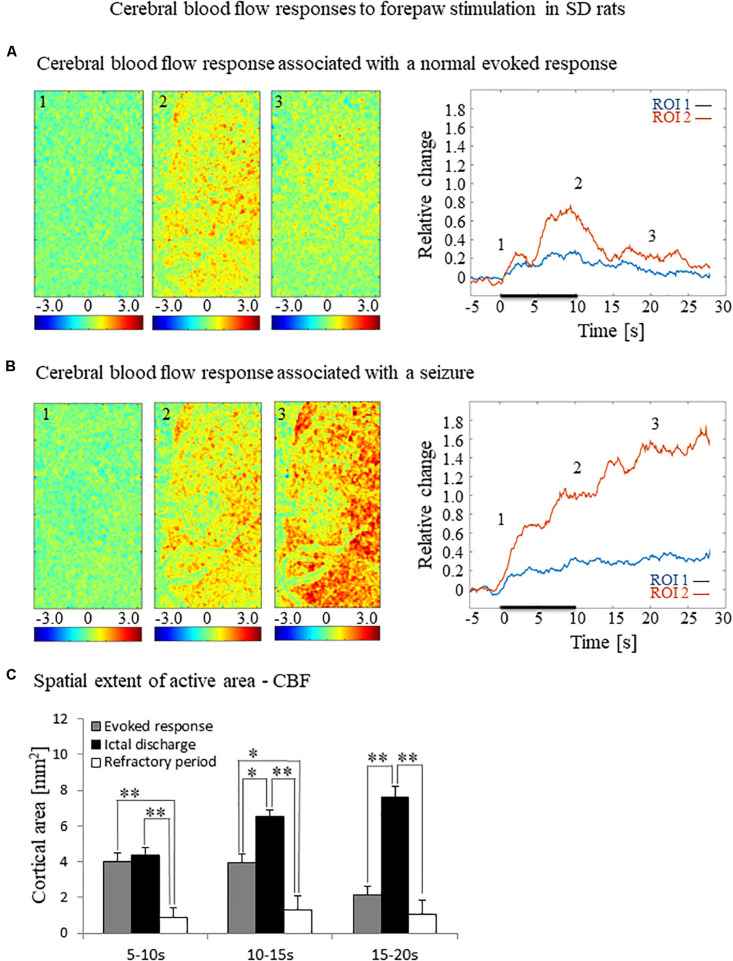
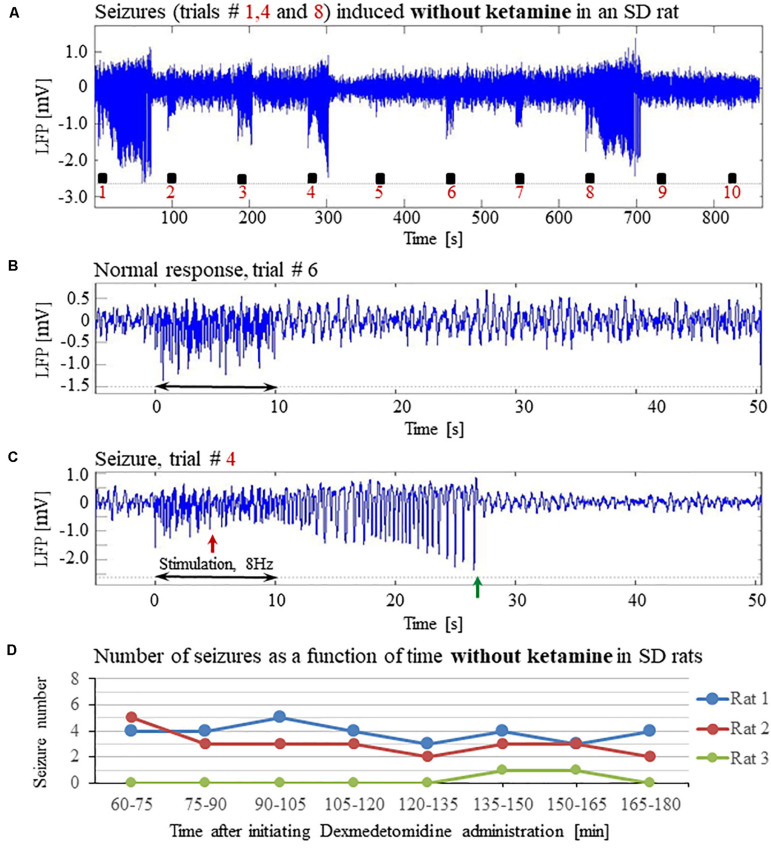
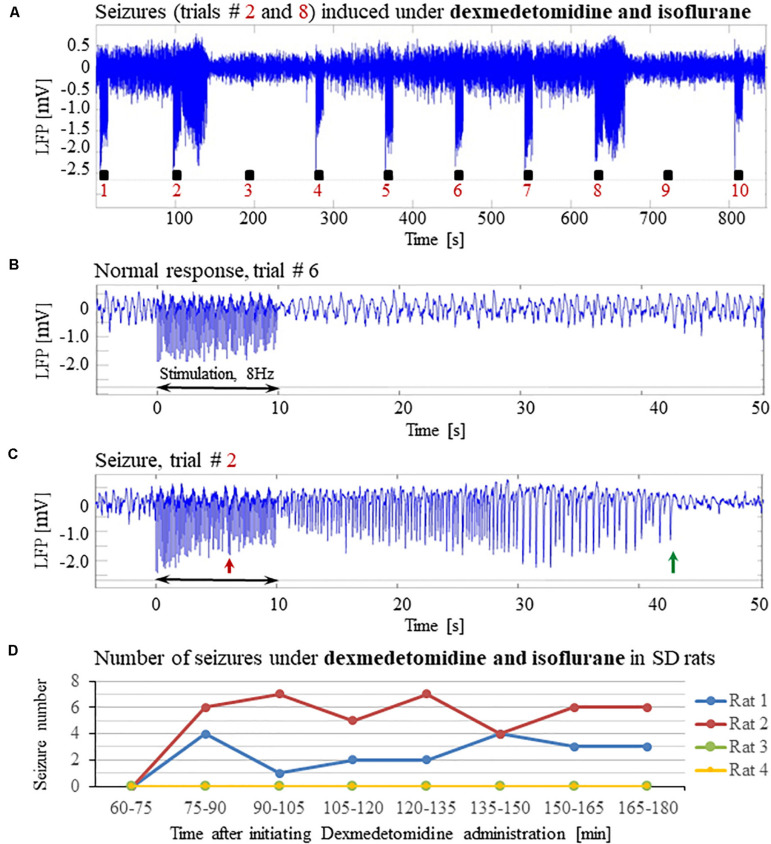
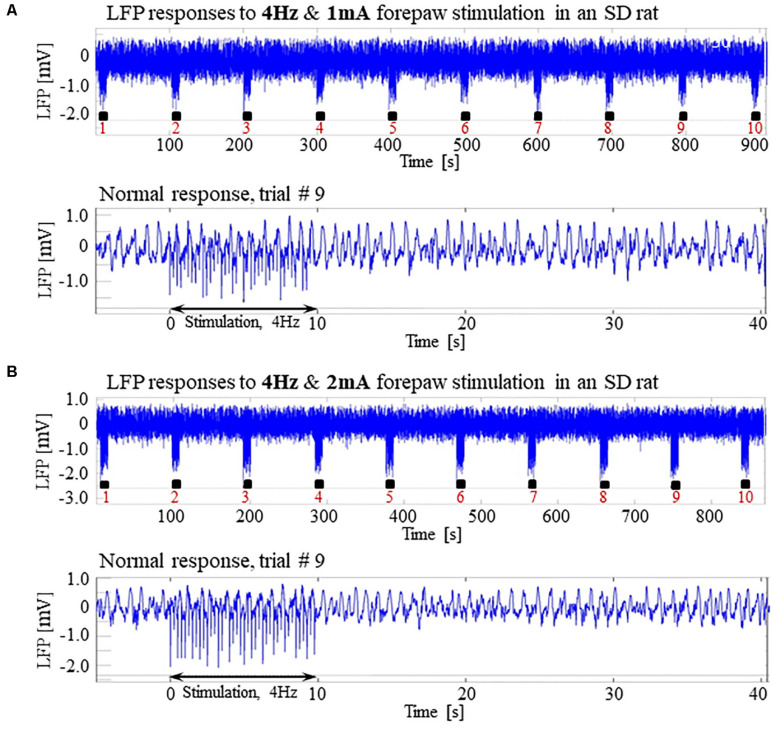
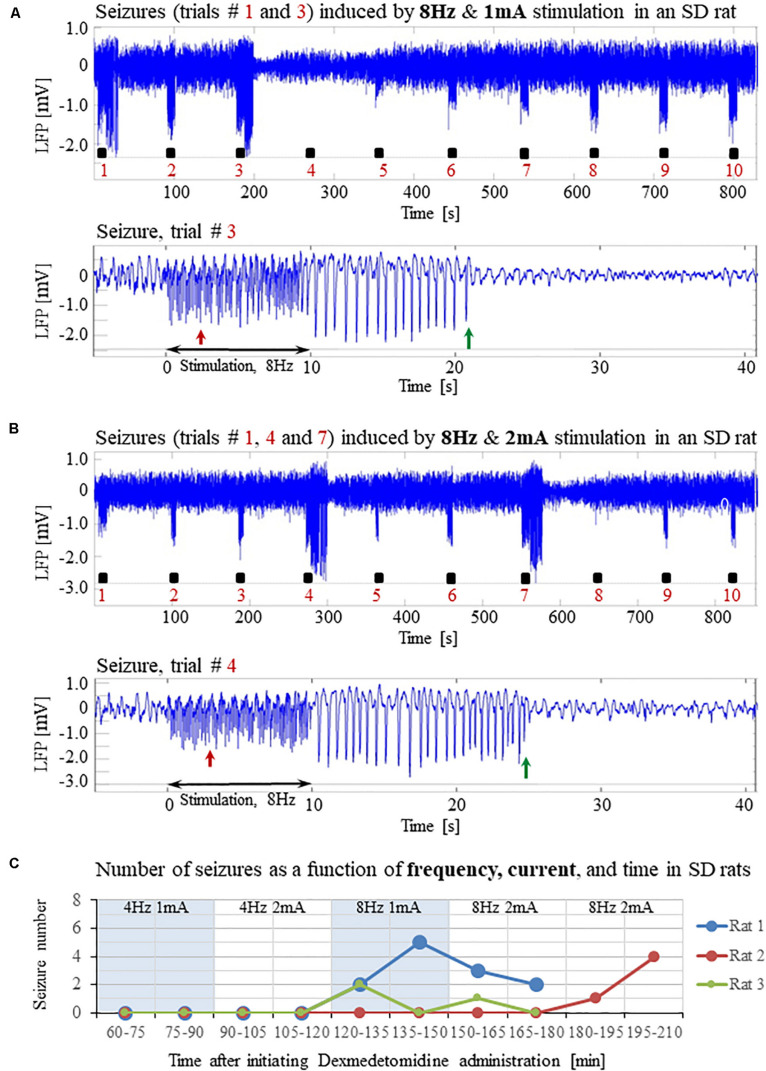
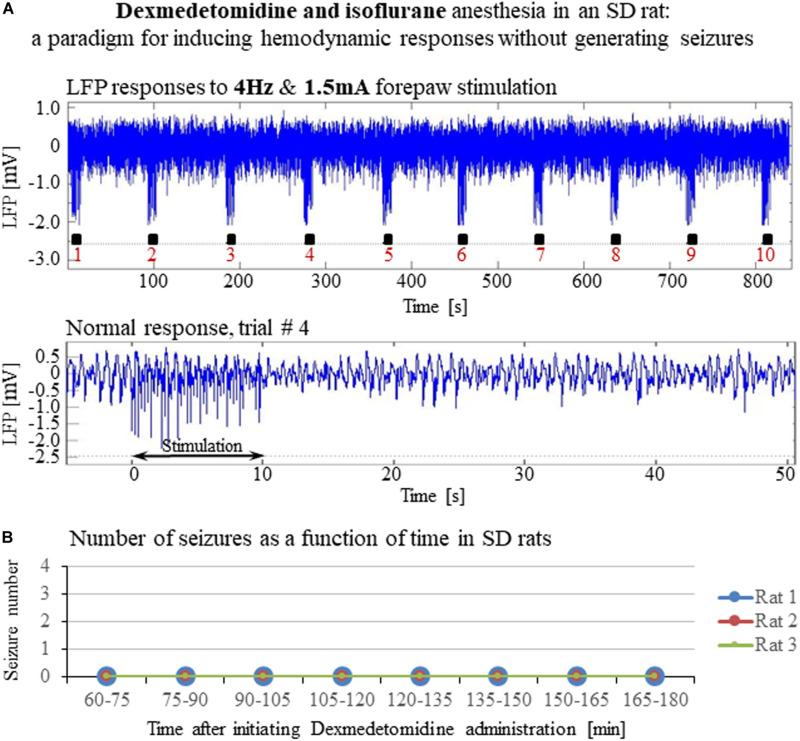
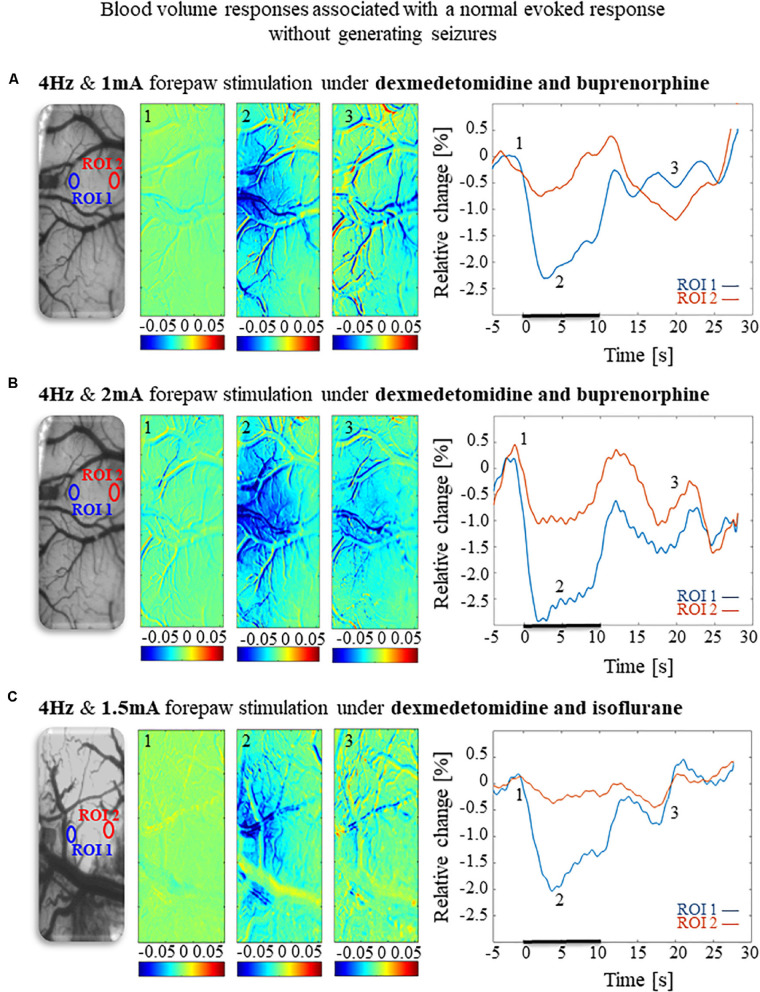
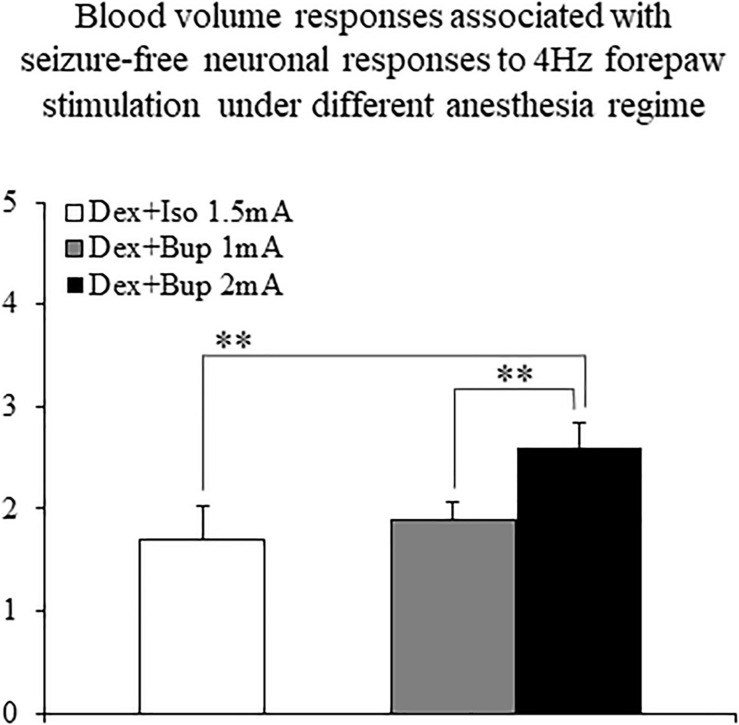
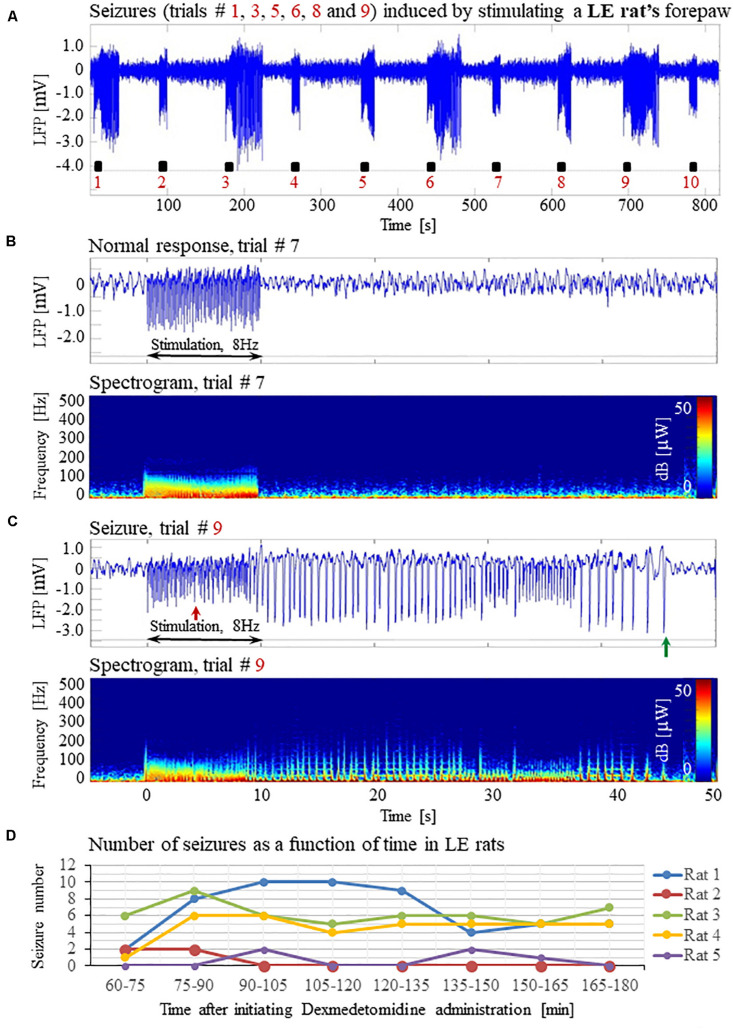
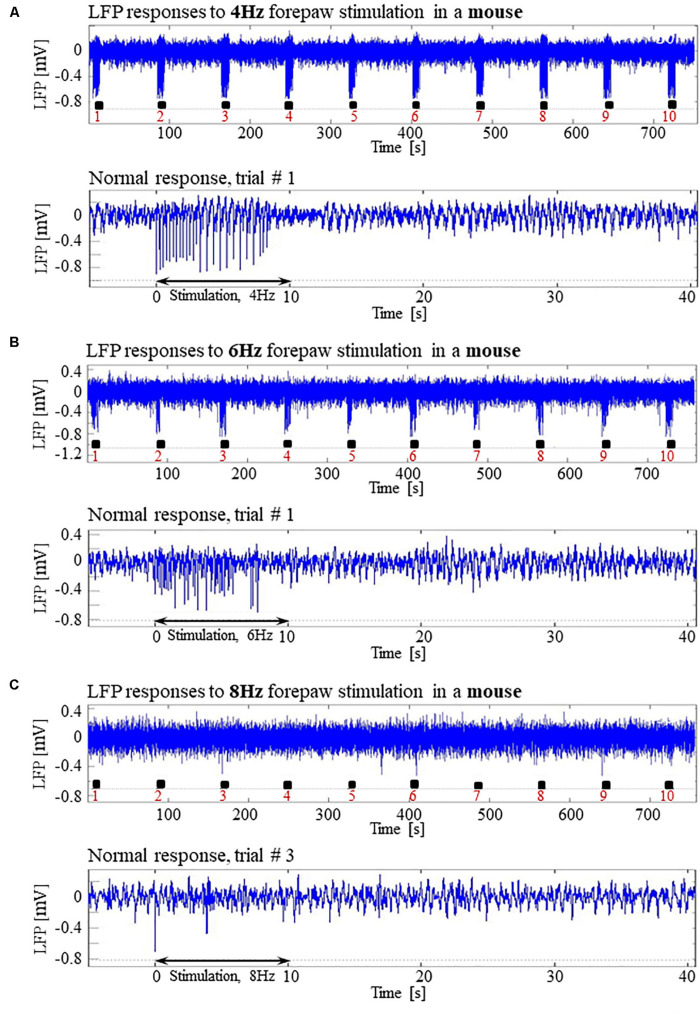
Functional MRI (fMRI) utilizes changes in metabolic and hemodynamic signals to indirectly infer the underlying local changes in neuronal activity. To investigate the mechanisms of fMRI responses, spontaneous fluctuations, and functional connectivity in the resting-state, it is important to pursue fMRI in animal models. Animal studies commonly use dexmedetomidine sedation. It has been demonstrated that potent sensory stimuli administered under dexmedetomidine are prone to inducing seizures in Sprague-Dawley (SD) rats. Here we combined optical imaging of intrinsic signals and cerebral blood flow with neurophysiological recordings to measure responses in rat area S1FL to electrical forepaw stimulation administered at 8 Hz. We show that the increased susceptibility to seizures starts no later than 1 h and ends no sooner than 3 h after initiating a continuous administration of dexmedetomidine. By administering different combinations of anesthetic and sedative agents, we demonstrate that dexmedetomidine is the sole agent necessary for the increased susceptibility to seizures. The increased susceptibility to seizures prevails under a combination of 0.3-0.5% isoflurane and dexmedetomidine anesthesia. The blood-oxygenation and cerebral blood flow responses to seizures induced by forepaw stimulation have a higher amplitude and a larger spatial extent relative to physiological responses to the same stimuli. The epileptic activity and the associated blood oxygenation and cerebral blood flow responses stretched beyond the stimulation period. We observed seizures in response to forepaw stimulation with 1-2 mA pulses administered at 8 Hz. In contrast, responses to stimuli administered at 4 Hz were seizure-free. We demonstrate that such seizures are generated not only in SD rats but also in Long-Evans rats, but not in C57BL6 mice stimulated with similar potent stimuli under dexmedetomidine sedation. We conclude that high-amplitude hemodynamic functional imaging responses evoked by peripheral stimulation in rats sedated with dexmedetomidine are possibly due to the induction of epileptic activity. Therefore, caution should be practiced in experiments that combine the administration of potent stimuli with dexmedetomidine sedation. We propose stimulation paradigms that elicit seizure-free, well detectable neurophysiological and hemodynamic responses in rats. We further conclude that the increased susceptibility to seizures under dexmedetomidine sedation is species dependent.

Keywords: blood oxygenation level-dependent functional MRI; cerebral blood flow; dexmedetomidine; forepaw electrical stimulation; hemodynamic response; medetomidine; neurovascular coupling; seizures.


Figures

FIGURE 1
FIGURE 1
Forepaw stimulation induces epileptic activity in rat area S1FL. (A) LFP recordings of ten trials, each with 10 s-long stimulation. The stimulation periods are marked by black rectangles. Each 10 s stimulus consisted of a train of electrical pulses delivered at 8 Hz to the forepaw. Note that during the first, fourth, and seventh trials, the stimulation evoked a seizure. (B) Top: The LFP (mean averaged over electrode contacts spanning the cortical depth) demonstrates a normal-evoked response in trial #3. Bottom: The corresponding spectrogram (power as a function of frequency and time) computed for the same trial. (C) Top: LFP (mean averaged over electrode contacts spanning the cortical depth) showing a seizure pattern in trial #4. The red and green arrows indicate the onset and termination, respectively, of a seizure induced by forepaw stimulation. Bottom: The corresponding spectrogram, computed for the same seizure. (D) The number of evoked seizures per rat as a function of time shows that seizures were induced already during the first or the second run, only one hour after initiating the dexmedetomidine administration.
FIGURE 2
FIGURE 2
Cerebral blood oxygenation responses evoked by forepaw stimulation. (A) Cerebral blood oxygenation response evoked by stimulation of the contralateral forepaw. To the left, the spatial responses before (the 1 s before stimulus onset), during (9–10 s following stimulus onset), and after (9–10 s following the cessation of the stimulus) the 10 s-long forepaw stimulation period. The reference for obtaining these responses was imaged between 3 and 1 seconds before stimulus onset. Note that positive responses are indicated in indexed yellow and red colors, representing increases in blood oxygenation. To the right are two time-courses presenting the corresponding temporal responses from two regions (blue and red ROIs in panel C) within the activated area. The stimulation period between 0 and 10 seconds is marked by a dark bar. (B) Maps of the blood oxygenation changes during a response that evoked a seizure, from before, during, and after the 10 s-long forepaw stimulation period (exact time periods are as in A). To the right are two time-courses presenting the corresponding temporal responses from two regions (blue and red ROIs in panel C) within the activated area. (C) The imaged cortical surface with the two ROIs used for sampling the time-courses presented in A and B.
FIGURE 3
FIGURE 3
Cerebral blood flow responses evoked by forepaw stimulation. (A) Cerebral blood flow response evoked by stimulation of the contralateral forepaw. To the left, the spatial responses before (the 1 s before stimulus onset), during (9–10 s following stimulus onset), and after (9–10 s following the cessation of the stimulus) the 10 s-long forepaw stimulation period. The reference for obtaining these responses was imaged between 3 and 1 seconds before stimulus onset. Note that positive responses indicated in indexed yellow and red colors represent increases in blood flow. To the right are two time-courses presenting the corresponding temporal responses from two regions (blue and red ROIs in Figure 2C) within the activated area. The stimulation period between 0 and 10 seconds is marked by a dark bar. (B) Maps of the blood flow changes during a response that evoked a seizure, from before, during, and after the 10 s-long forepaw stimulation period (exact time periods are as in A). To the right are two time-courses presenting the corresponding temporal responses from the same ROIs as described in (A). (C) A bar graph showing the spatial extent of the CBF response calculated for the epochs of 5–10 s, 10–15 s, and 15–20 s relative to the onset of the stimulus during normal evoked responses (n = 21), seizure responses (n = 20) and refractory periods (n = 14; *p < 0.05, **p < 0.001; Tamhane’s test).
FIGURE 4
FIGURE 4
The increased susceptibility to seizures in SD rats under dexmedetomidine and buprenorphine does not depend on ketamine. The data presented in this figure were obtained from 3 rats under dexmedetomidine and buprenorphine sedation with no administration of ketamine. The format of the presentation is similar to that used in Figure 1. (A) A time-course of LFP (averaged over electrode contacts spanning the cortical depth) recorded during ten trials, each with 10 s-long stimulation. The stimulation periods are marked by black rectangles. Note the seizures induced by the stimulus in the first, fourth, and eighth trials. (B) A normal-evoked LFP response recorded in trial #6. (C) A seizure pattern recorded in trial #4. The red and green arrows indicate the onset and termination of the seizure, respectively. (D) The number of seizures recorded in each of the 3 rats as a function of time after the initiation of the dexmedetomidine administration.
FIGURE 5
FIGURE 5
Potent forepaw stimulation induces seizures in SD rats under dexmedetomidine and isoflurane anesthesia. The data presented in this figure were obtained from 4 rats under dexmedetomidine and isoflurane anesthesia. (A) LFP recordings of ten trials, each with 10 s-long stimulation. Note the seizures induced by the stimulus in the second and eighth trials. (B) A normal-evoked LFP response recorded in trial #6. (C) A seizure pattern recorded in trial #2. (D) The number of seizures recorded in each of the 4 rats as a function of time after the initiation of the dexmedetomidine administration. Seizures were induced already during the second run, less than 90 min after initiating the dexmedetomidine administration.
FIGURE 6
FIGURE 6
Normal LFP responses to forepaw stimulation administered at 4 Hz in SD rats under dexmedetomidine and buprenorphine. The data presented in this figure were obtained from 3 rats under dexmedetomidine and buprenorphine sedation. (A) Top: Normal LFP responses obtained from area S1FL, in response to 4 Hz & 1 mA forepaw stimulation. The panel shows ten trials, each with 10 s-long stimulation. Bottom: A magnification of the normal evoked response from the ninth trial. (B) Top: Normal LFP responses to 4 Hz & 2 mA forepaw stimulation. Bottom: A magnification of the normal evoked response from the ninth trial.
FIGURE 7
FIGURE 7
Forepaw stimulation administered at 8Hz induces epileptic activity in SD rats under dexmedetomidine and buprenorphine. The data presented in this figure were obtained from the same 3 rats whose responses to forepaw stimulation with different parameters are presented in Figure 6. (A) Top: LFP responses to 8 Hz & 1 mA forepaw stimulation. Note the seizures induced by the stimulus in the first and third trials. Bottom: A magnified view of the seizure recorded in the third trial. (B) Top: LFP responses to 8 Hz & 2 mA forepaw stimulation. Note the seizures induced by the stimulus in the first, fourth, and seventh trials. Bottom: A magnified view of the seizure recorded in the fourth trial. (C) The number of seizures recorded in each of the 3 rats whose responses to forepaw stimulation are presented in Figures 6 and 7. The number of seizures is presented as a function of time after the initiation of the dexmedetomidine administration. The stimulation parameters used for each pair of consecutive blocks are presented at the upper part of the panel.
FIGURE 8
FIGURE 8
A paradigm for seizure-free forepaw stimulation under dexmedetomidine and isoflurane. The data presented in this figure were obtained from 3 rats under dexmedetomidine and isoflurane anesthesia. Forepaw stimuli of 1.5 mA were administered at a rate of 4 Hz. (A) Top: Normal LFP responses to 10 s-long stimulation blocks obtained from area S1FL. Bottom: A magnification of the normal evoked response from the fourth trial. (B) The number of seizures (none) recorded in each of the 3 rats as a function of time shows that forepaw stimuli of 1.5 mA administered at 4 Hz do not induce seizures in SD rats under dexmedetomidine and isoflurane anesthesia.
FIGURE 9
FIGURE 9
Cerebral blood volume responses associated with seizure-free responses to 4 Hz forepaw stimulation under different anesthesia regimes. (A) A cerebral blood volume response to a 10 s-long block of forepaw stimuli of 1 mA administered at 4 Hz under dexmedetomidine and buprenorphine sedation. To the left, the imaged cortical surface. The 3 maps presented in color show the spatial responses before (the 1 s before stimulus onset), during (4–5 s following stimulus onset), and after (9–10 s following the cessation of the stimulus) the 10 s-long forepaw stimulation period. The reference for obtaining these responses was imaged between 3 and 1 seconds before stimulus onset. Note that negative responses indicated in indexed blue colors represent increases in blood volume. To the right are two time-courses presenting the corresponding temporal responses from two regions (blue and red ROIs in the left panel) within the activated area. The stimulation period between 0 and 10 seconds is marked by a dark bar. (B) Cerebral blood volume response evoked by 4 Hz and 2 mA forepaw stimulation under dexmedetomidine and buprenorphine sedation. The format of the presentation is identical to that used in panel A. (C) Cerebral blood volume response evoked by 4 Hz and 1.5 A forepaw stimulation under dexmedetomidine and isoflurane anesthesia. The format of the presentation is identical to that used in panel A.
FIGURE 10
FIGURE 10
The amplitudes of cerebral blood volume responses associated with seizure-free responses to 4 Hz forepaw stimulation under different anesthesia regimes. A bar graph showing the peak amplitude of CBV normal responses sampled from the gray matter region that showed the highest response. The white bar to the left shows the amplitude of response to stimuli of 1.5 mA administered at 4 Hz under dexmedetomidine and isoflurane anesthesia (Dex + Iso; mean ± SEM, n = 60 trials from 3 SD rats). The gray and black bars show the amplitudes of responses to stimuli of 1.0 mA and 2.0 mA, respectively, administered at 4 Hz under dexmedetomidine and buprenorphine sedation (Dex + Bup; n = 60 trials from the same 3 SD rats). **p < 0.001; Tamhane’s test.
FIGURE 11
FIGURE 11
Forepaw stimulation induces epileptic activity in LE rat. (A) LFP recordings of ten trials, each with 10 s-long stimulation. The stimulation periods are marked by black rectangles. Note that during the first, third, fifth, sixth, eighth, and ninth trials, the stimulation induced a seizure. (B) Top: The LFP (mean averaged over electrode contacts spanning the cortical depth) demonstrates a normal-evoked response in trial #7. Bottom: The corresponding spectrogram (power as a function of frequency and time) computed for the same trial. (C) Top: LFP (mean averaged over electrode contacts spanning the cortical depth) showing a seizure pattern in trial #9. The red and green arrows indicate the onset and termination, respectively, of a seizure induced by forepaw stimulation. Bottom: The corresponding spectrogram, computed for the same seizure. (D) The number of evoked seizures per rat as a function of time shows that seizures are induced already during the first or the third run, only one hour after initiating the dexmedetomidine administration.
FIGURE 12
FIGURE 12
Absence of seizures in the C57BL6 mouse strain. (A) Top: Normal LFP responses obtained from area S1FL, in response to 4 Hz forepaw stimulation. The panel shows ten trials, each with 10 s-long stimulation. The stimulation blocks are marked by black rectangles. Bottom: A magnification of the normal evoked response from the first trial. (B) Top: Normal LFP responses to 6 Hz forepaw stimulation. Bottom: A magnification of the normal evoked response from the first trial. (C) Top: A typical activity pattern of evoked responses to 8 Hz forepaw stimulation. Bottom: A magnification of the normal evoked response from the third trial.

Similar articles

Cited by

References

    1. Adamczak J. M., Farr T. D., Seehafer J. U., Kalthoff D., Hoehn M. (2010). High field BOLD response to forepaw stimulation in the mouse. Neuroimage 51 704–712. 10.1016/j.neuroimage.2010.02.083 - DOI - PubMed
    1. Airaksinen A. M., Hekmatyar S. K., Jerome N., Niskanen J. P., Huttunen J. K., Pitkanen A., et al. (2012). Simultaneous BOLD fMRI and local field potential measurements during kainic acid-induced seizures. Epilepsia 53 1245–1253. 10.1111/j.1528-1167.2012.03539.x - DOI - PubMed
    1. Airaksinen A. M., Niskanen J. P., Chamberlain R., Huttunen J. K., Nissinen J., Garwood M., et al. (2010). Simultaneous fMRI and local field potential measurements during epileptic seizures in medetomidine-sedated rats using raser pulse sequence. Magn. Reson. Med. 64 1191–1199. 10.1002/mrm.22508 - DOI - PMC - PubMed
    1. Albers F., Schmid F., Wachsmuth L., Faber C. (2018). Line scanning fMRI reveals earlier onset of optogenetically evoked BOLD response in rat somatosensory cortex as compared to sensory stimulation. Neuroimage 164 144–154. 10.1016/j.neuroimage.2016.12.059 - DOI - PubMed
    1. Barton M. E., Klein B. D., Wolf H. H., White H. S. (2001). Pharmacological characterization of the 6 Hz psychomotor seizure model of partial epilepsy. Epilepsy Res. 47 217–227. 10.1016/s0920-1211(01)00302-3 - DOI - PubMed

LinkOut - more resources