

Systematic Review: Anaesthetic Protocols and Management as Confounders in Rodent Blood Oxygen Level Dependent Functional Magnetic Resonance Imaging (BOLD fMRI)-Part A: Effects of Changes in Physiological Parameters
- PMID: 33192261
- PMCID: PMC7646331
- DOI: 10.3389/fnins.2020.577119
Systematic Review: Anaesthetic Protocols and Management as Confounders in Rodent Blood Oxygen Level Dependent Functional Magnetic Resonance Imaging (BOLD fMRI)-Part A: Effects of Changes in Physiological Parameters
Abstract
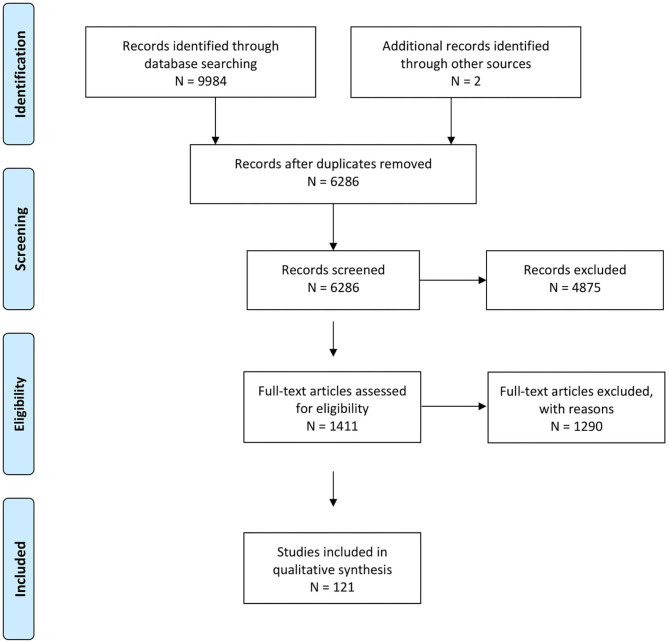
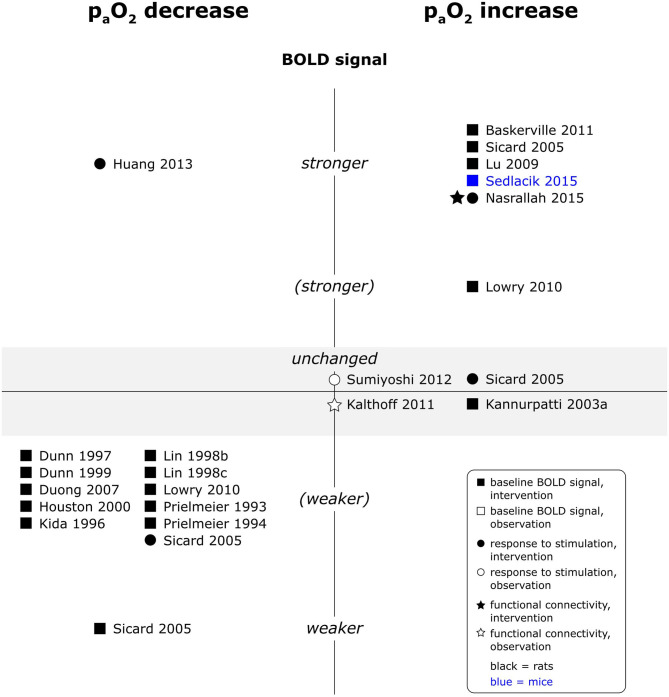
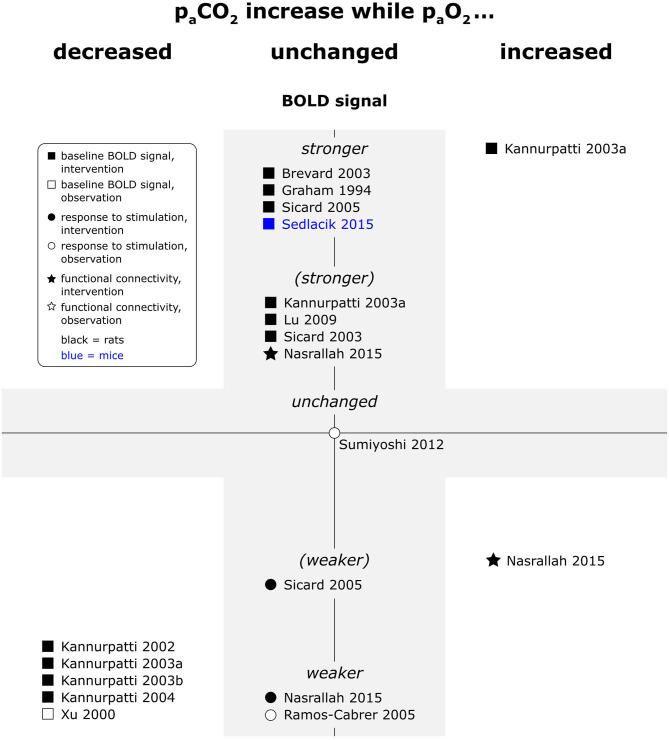
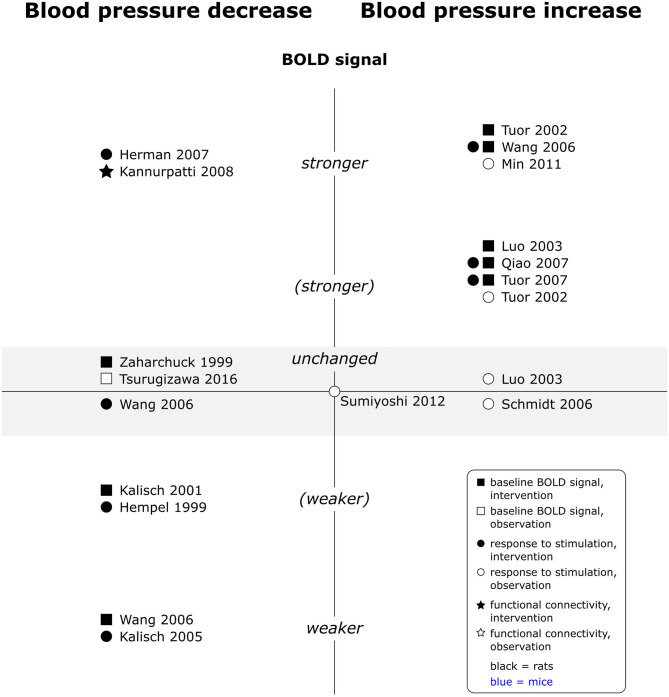
Background: To understand brain function in health and disease, functional magnetic resonance imaging (fMRI) is widely used in rodent models. Because animals need to be immobilised for image acquisition, fMRI is commonly performed under anaesthesia. The choice of anaesthetic protocols and may affect fMRI readouts, either directly or via changing physiological balance, and thereby threaten the scientific validity of fMRI in rodents. Methods: The present study systematically reviewed the literature investigating the influence of different anaesthesia regimes and changes in physiological parameters as confounders of blood oxygen level dependent (BOLD) fMRI in rats and mice. Four databases were searched, studies selected according to pre-defined criteria, and risk of bias assessed for each study. Results are reported in two separate articles; this part of the review focuses on effects of changes in physiological parameters. Results: A total of 121 publications was included, of which 49 addressed effects of changes in physiological parameters. Risk of bias was high in all included studies. Blood oxygenation [arterial partial pressure of oxygen (paO2)], ventilation [arterial partial pressure of carbon dioxide (paCO2)] and arterial blood pressure affected BOLD fMRI readouts across various experimental paradigms. Conclusions: Blood oxygenation, ventilation and arterial blood pressure should be monitored and maintained at stable physiological levels throughout experiments. Appropriate anaesthetic management and monitoring are crucial to obtain scientifically valid, reproducible results from fMRI studies in rodent models.
Keywords: BOLD fMRI; anaesthetic management; anaesthetic monitoring; mouse; rat; validity.
Copyright © 2020 Steiner, Rousseau-Blass, Schroeter, Hartnack and Bettschart-Wolfensberger.
Figures
Similar articles
-
Systematic Review: Anesthetic Protocols and Management as Confounders in Rodent Blood Oxygen Level Dependent Functional Magnetic Resonance Imaging (BOLD fMRI)-Part B: Effects of Anesthetic Agents, Doses and Timing.Animals (Basel). 2021 Jan 15;11(1):199. doi: 10.3390/ani11010199. Animals (Basel). 2021. PMID: 33467584 Free PMC article. Review.
-
Continuous noninvasive monitoring of transcutaneous blood gases for a stable and persistent BOLD contrast in fMRI studies in the rat.NMR Biomed. 2005 Nov;18(7):440-6. doi: 10.1002/nbm.978. NMR Biomed. 2005. PMID: 16158460
-
Specificity of stimulus-evoked fMRI responses in the mouse: the influence of systemic physiological changes associated with innocuous stimulation under four different anesthetics.Neuroimage. 2014 Jul 1;94:372-384. doi: 10.1016/j.neuroimage.2014.01.046. Epub 2014 Feb 2. Neuroimage. 2014. PMID: 24495809
-
Biophysical and physiological origins of blood oxygenation level-dependent fMRI signals.J Cereb Blood Flow Metab. 2012 Jul;32(7):1188-206. doi: 10.1038/jcbfm.2012.23. Epub 2012 Mar 7. J Cereb Blood Flow Metab. 2012. PMID: 22395207 Free PMC article. Review.
-
Gastric distention induced functional magnetic resonance signal changes in the rodent brain.Neuroscience. 2011 Apr 14;179:151-8. doi: 10.1016/j.neuroscience.2011.01.051. Epub 2011 Feb 1. Neuroscience. 2011. PMID: 21284950
Cited by
-
The effects of post-operative oxygen supply on blood oxygenation and acid-base status in rats anaesthetized with fentanyl/fluanisone and midazolam.PLoS One. 2021 Aug 9;16(8):e0255829. doi: 10.1371/journal.pone.0255829. eCollection 2021. PLoS One. 2021. PMID: 34370776 Free PMC article.
-
Where do we stand on fMRI in awake mice?Cereb Cortex. 2024 Jan 14;34(1):bhad478. doi: 10.1093/cercor/bhad478. Cereb Cortex. 2024. PMID: 38100331 Free PMC article.
-
Depression Classification Using Frequent Subgraph Mining Based on Pattern Growth of Frequent Edge in Functional Magnetic Resonance Imaging Uncertain Network.Front Neurosci. 2022 Apr 29;16:889105. doi: 10.3389/fnins.2022.889105. eCollection 2022. Front Neurosci. 2022. PMID: 35578623 Free PMC article.
-
Reference values of arterial blood gas index in adult respiratory failure in high altitude area.Sci Rep. 2025 May 10;15(1):16314. doi: 10.1038/s41598-025-01441-0. Sci Rep. 2025. PMID: 40348814 Free PMC article.
-
Systematic Review: Anesthetic Protocols and Management as Confounders in Rodent Blood Oxygen Level Dependent Functional Magnetic Resonance Imaging (BOLD fMRI)-Part B: Effects of Anesthetic Agents, Doses and Timing.Animals (Basel). 2021 Jan 15;11(1):199. doi: 10.3390/ani11010199. Animals (Basel). 2021. PMID: 33467584 Free PMC article. Review.
References
-
- Armstrong S. R., Roberts B. K., Aronsohn M. (2005). Perioperative hypothermia. J. Vet. Emerg. Crit. Care 15, 32–37. 10.1111/j.1476-4431.2005.04033.x - DOI
-
- Baskerville T. A., Deuchar G. A., McCabe C., Robertson C. A., Holmes W. M., Santosh C., et al. . (2011). Influence of 100% and 40% oxygen on penumbral blood flow, oxygen level, and T2 -weighted MRI in a rat stroke model. J. Cereb. Blood Flow Metab. 31, 1799–1806. 10.1038/jcbfm.2011.65 - DOI - PMC - PubMed
Publication types
LinkOut - more resources
Full Text Sources