. 2020 Oct 30:11:569802.
doi: 10.3389/fphar.2020.569802. eCollection 2020.

Sphingosine 1-Phosphate Induces Cyclooxygenase-2/Prostaglandin E2 Expression via PKCα-dependent Mitogen-Activated Protein Kinases and NF-κB Cascade in Human Cardiac Fibroblasts

Affiliations

Sphingosine 1-Phosphate Induces Cyclooxygenase-2/Prostaglandin E2 Expression via PKCα-dependent Mitogen-Activated Protein Kinases and NF-κB Cascade in Human Cardiac Fibroblasts

Chien-Chung Yang et al. Front Pharmacol. .

Abstract

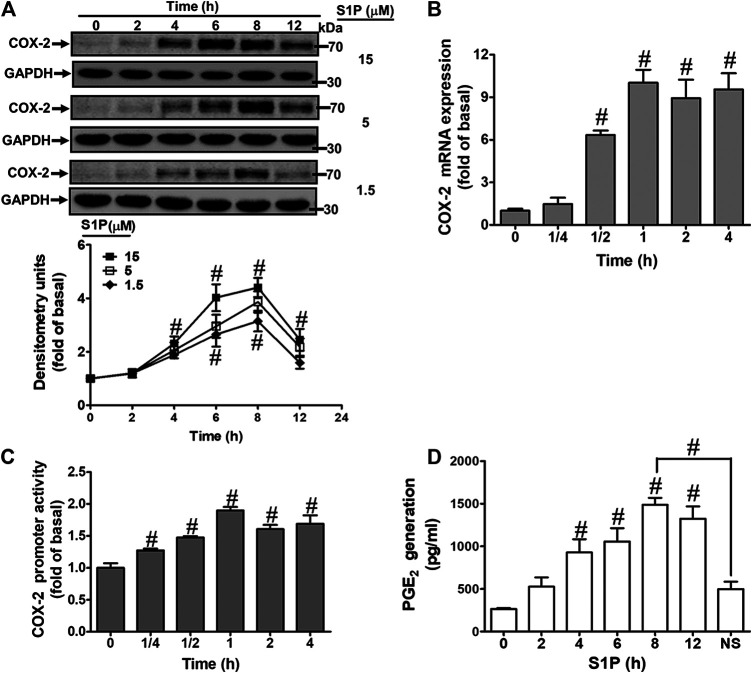
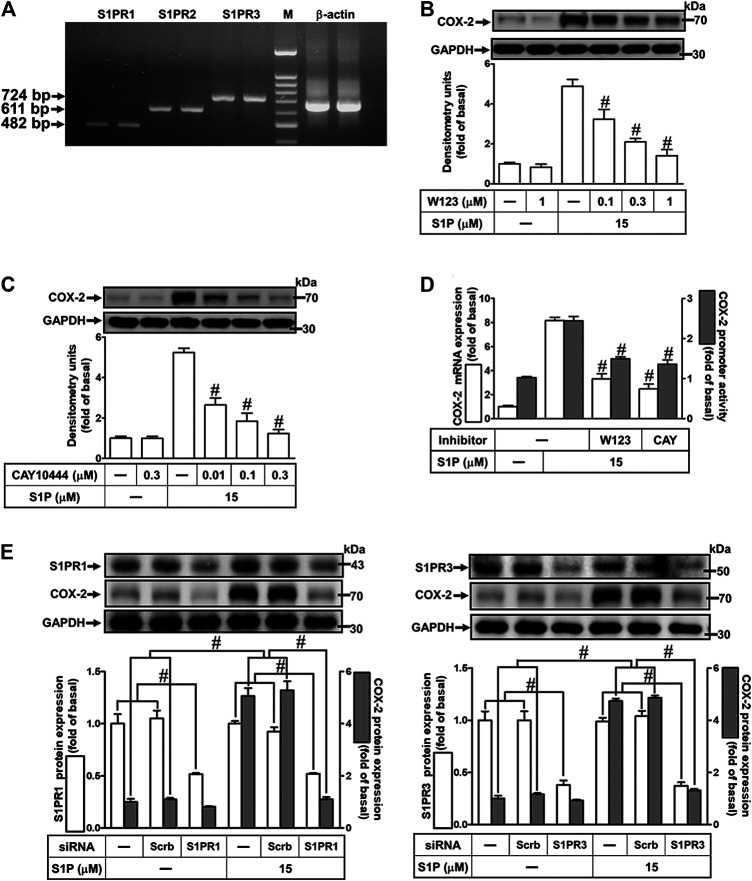
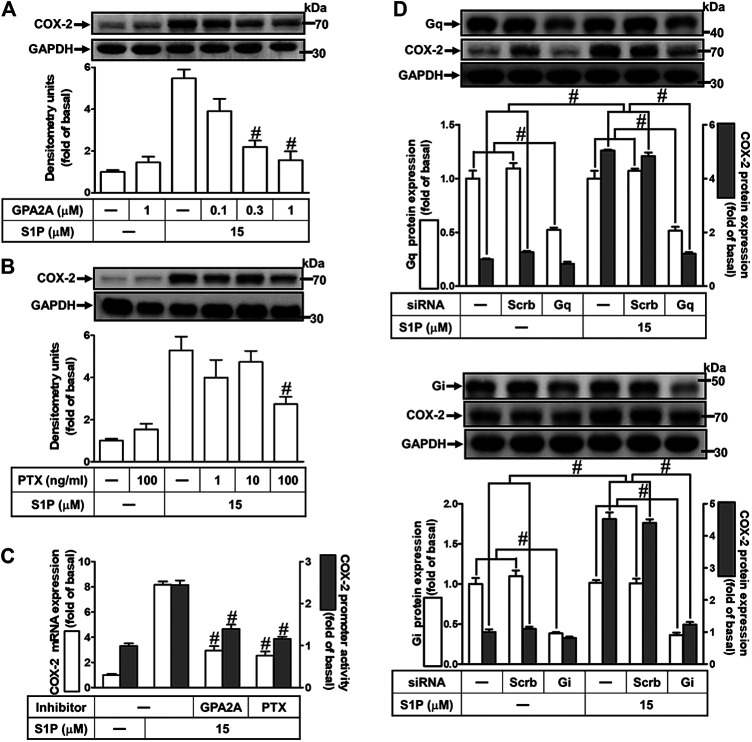
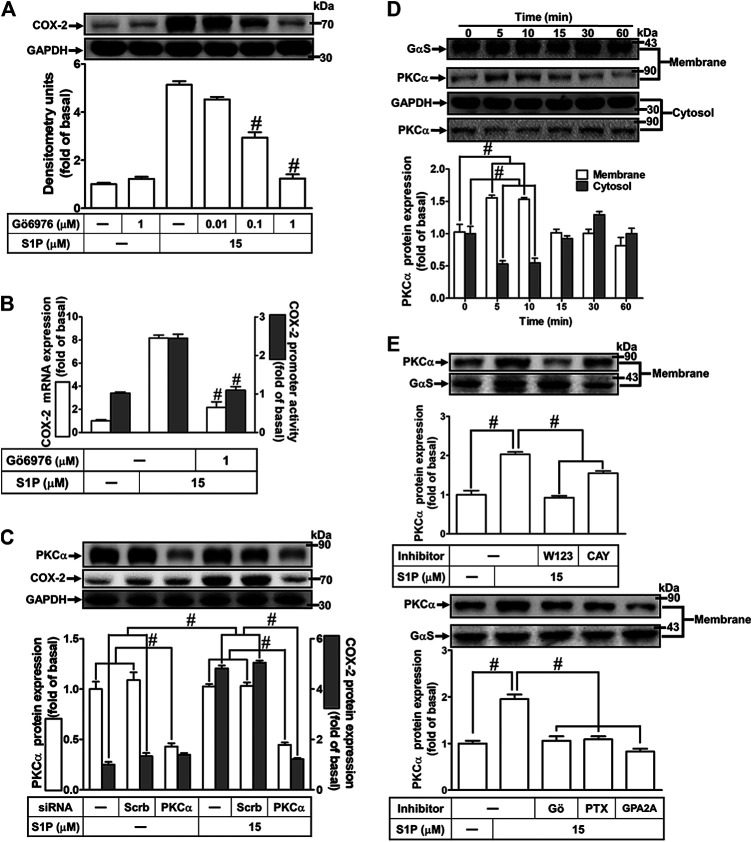
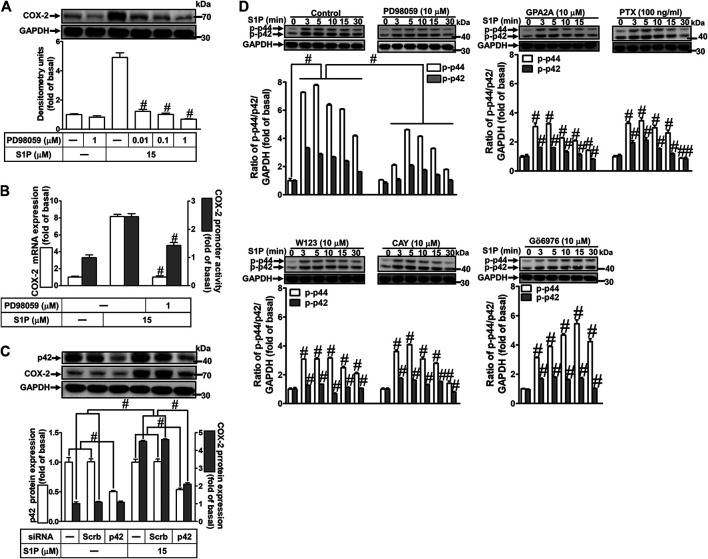
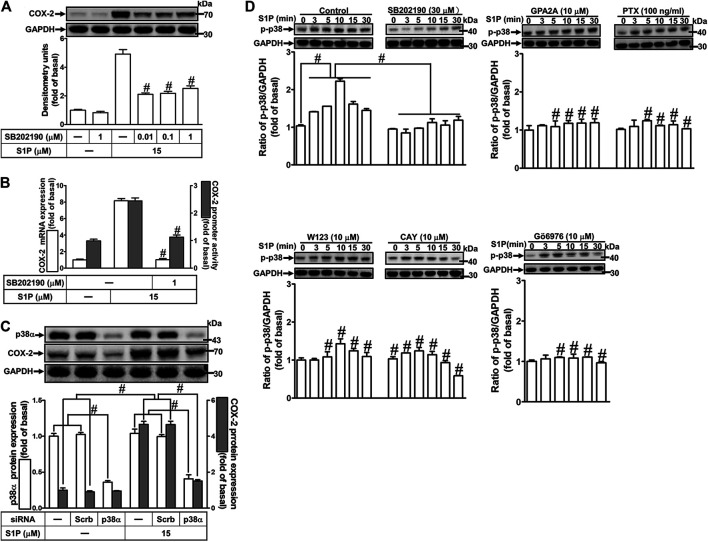
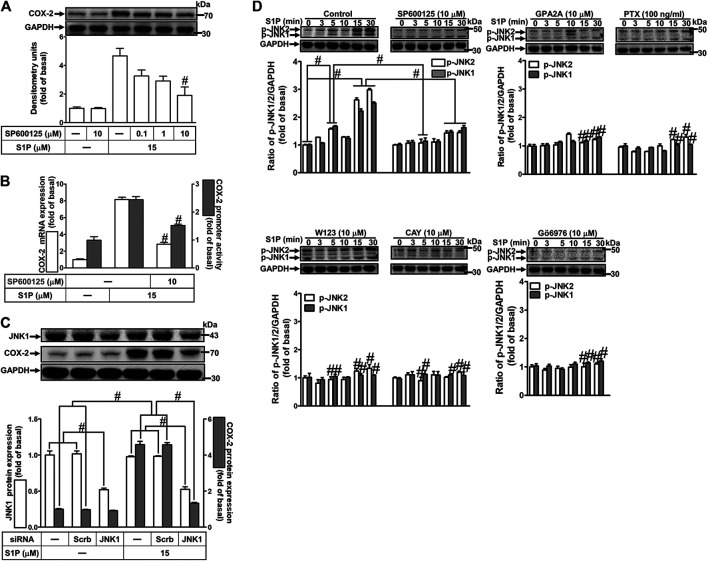
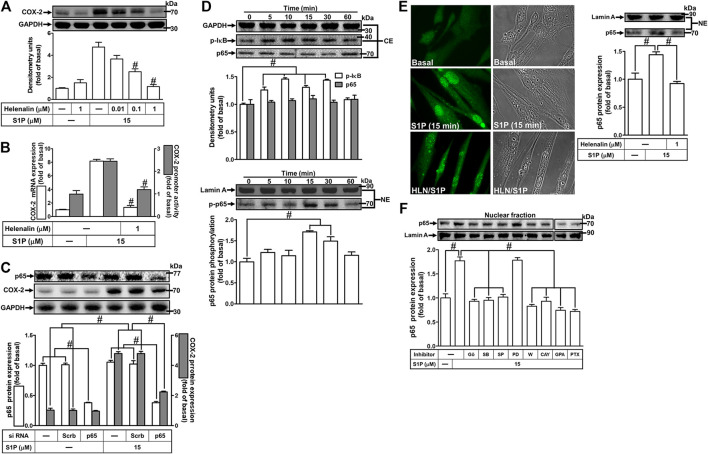
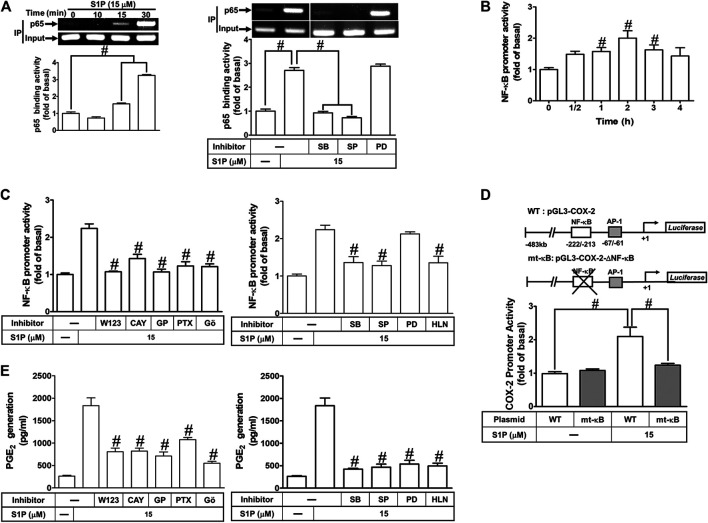
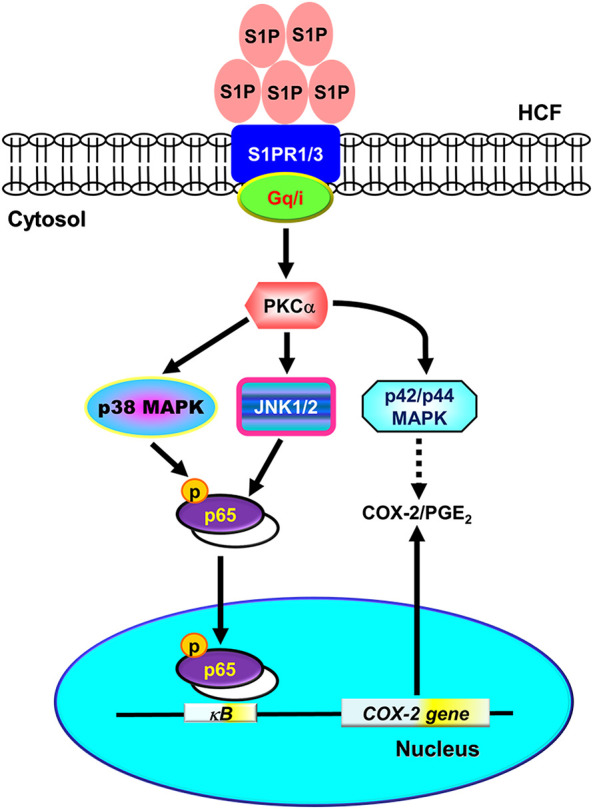
In the regions of tissue injuries and inflammatory diseases, sphingosine 1-phosphate (S1P), a proinflammatory mediator, is increased. S1P may induce the upregulation of cyclooxygenase-2 (COX-2)/prostaglandin E2 (PGE2) system in various types of cells to exacerbate heart inflammation. However, the detailed molecular mechanisms by which S1P induces COX-2 expression in human cardiac fibroblasts (HCFs) remain unknown. HCFs were incubated with S1P and analyzed by Western blotting, real time-Polymerase chain reaction (RT-PCR), and immunofluorescent staining. Our results indicated that S1P activated S1PR1/3-dependent transcriptional activity to induce COX-2 expression and PGE2 production. S1P recruited and activated PTX-sensitive Gi or -insensitive Gq protein-coupled S1PR and then stimulated PKCα-dependent phosphorylation of p42/p44 MAPK, p38 MAPK, and JNK1/2, leading to activating transcription factor NF-κB. Moreover, S1P-activated NF-κB was translocated into the nucleus and bound to its corresponding binding sites on COX-2 promoters determined by chromatin immunoprecipitation (ChIP) and promoter-reporter assays, thereby turning on COX-2 gene transcription associated with PGE2 production in HCFs. These results concluded that in HCFs, activation of NF-κB by PKCα-mediated MAPK cascades was essential for S1P-induced up-regulation of the COX-2/PGE2 system. Understanding the mechanisms of COX-2 expression and PGE2 production regulated by the S1P/S1PRs system on cardiac fibroblasts may provide rationally therapeutic interventions for heart injury or inflammatory diseases.

Keywords: NF-κB; PKCα; cyclooxygenase-2; human cardiac fibroblasts; mitogen-activated protein kinases; sphingosine 1-phosphate.


Figures

FIGURE 1
FIGURE 1
S1P induced COX-2 expression and PGE2 generation in HCFs. (A) Cells were incubated with various concentrations of S1P for the indicated time intervals. (B) Cells were incubated with 15 μM S1P for the indicated time intervals. COX-2 mRNA was analyzed by real time-PCR. (C) Cells were transfected with a COX-2 promoter-luciferase reporter gene and then incubated with 15 μM S1P for the indicated time intervals. The promoter reporter assay was determined. (D) Various concentrations of S1P were used to treat the cells for the indicated time intervals. In addition, cells were pretreated with NS398 (10 μM) for 1 h and then incubated with 15 μM S1P for 8 h. The media were collected to determine PGE2 levels by EIA. Data are expressed as mean ± SEM of three individual experiments (n = 3). # p < 0.05, as compared with the cells treated with vehicle (DMSO) alone.
FIGURE 2
FIGURE 2
Involvement of S1PR1 and S1PR3 in S1P-induced COX-2 expression. (A) RT-PCR analysis of S1PRs expression in HCFs. Lane 1–2: S1PR1; Lane 3–4: S1P2; Lane 5–6: S1P3; Lane 7: marker; Lane 8–9: β-actin. (B,C) Cells were pretreated with W123 or CAY10444 for 1 h and then incubated with 15 μM S1P for 8 h. (D) Cells were transfected without or with COX-2 promoter-luciferase reporter gene, pretreated without or with W123 (1 μM) or CAY10444 (0.3 μM) for 1 h and then incubated with 15 μM S1P for 4 h (mRNA) or 1 h (promoter). (E) Cells were transfected with siRNA for scrambled, S1PR1, or S1PR3 for 24 h and then exposed to 15 μM S1P for 8 h. (B,C,E) The levels of COX-2, S1PR1, S1PR3, and GAPDH protein were analyzed by Western blot. (D) The levels of COX-2 mRNA and promoter activity were analyzed by real time-PCR (open bar) and promoter assay (gray bar). Data are expressed as mean ± SEM of three individual experiments (n = 3). # p < 0.05, as compared with the cells treated with S1P alone.
FIGURE 3
FIGURE 3
S1P induces COX-2 expression via a Gq- or PTX-sensitive Gi protein-coupled S1PR1/3. (A,B) Cells were pretreated with GPA2A (Gq antagonist) for 1 h or pertussis toxin (PTX, Gi protein inactivator) for 24 h and then incubated with 15 μM S1P for 8 h. (C) Cells were transfected without or with COX-2 promoter-luciferase reporter gene, pretreated with GPA2A (1 μM) or PTX (100 ng/ml) for 1 h, and then incubated with 15 μM S1P for 4 h (mRNA) or 1 h (promoter). The COX-2 mRNA and promoter activity were analyzed by real time-PCR (open bar) and promoter assay (gray bar). (D) Cells were transfected with siRNA for scrambled, Gqα, or Giα for 24 h and then exposed to 15 μM S1P for 8 h (A,B,D) The levels of COX-2, GAPDH, Gqα, and Giα proteins were analyzed by Western blot. Data are expressed as mean ± SEM of three individual experiments (n = 3). # p < 0.05, as compared with the cells treated with S1P alone.
FIGURE 4
FIGURE 4
PKCα mediates S1P-induced COX-2 expression. (A) Cells were pretreated with Gö6976 for 1 h and then incubated with 15 μM S1P for 8 h. (B) Cells were transfected without or with COX-2 promoter-luciferase reporter gene, pretreated without or with Gö6976 (1 μM) for 1 h, and then incubated with 15 μM S1P for 4 h (mRNA) or 1 h (promoter). Western blot, real time-PCR, and promoter assay were performed to determine the levels of COX-2 protein, mRNA expression, and promoter activity, respectively. (C) Prior to exposure with S1P for 8 h, cells were transfected with siRNA of scrambled or PKCα. (D) Cells were incubated with S1P (15 μM) for the indicated time intervals. (E) Cells were incubated with S1P (15 μM) for 5 min in the absence or presence of Gö6976 (1 μM), W123 (10 μM), CAY (10 μM), GPA2A (10 μM), or PTX (100 ng/ml) for 1 h. The membrane and cytosol fractions were prepared and analyzed by Western blot. Data are expressed as mean ± SEM of three individual experiments (n = 3). # p < 0.05, as compared with the cells treated with S1P alone.
FIGURE 5
FIGURE 5
S1P-induced COX-2 expression is mediated through p42/p44 MAPK phosphorylation. (A) Cells were pretreated with PD98059 for 1 h and then incubated with 15 μM S1P for 8 h. (B) Cells were transfected without or with COX-2 promoter-luciferase reporter gene, pretreated without or with PD98059 (10 μM) for 1 h, and then incubated with 15 μM S1P for 4 h (mRNA) or 1 h (promoter). The levels of COX-2 protein, mRNA expression, and promoter activity were determined by Western blot, real time-PCR, and promoter assay, respectively. (C) Cells were transfected with siRNA of scrambled or p42 MAPK and then exposed to S1P for 8 h. (D) Cells were incubated with S1P (15 μM) for the indicated time intervals in the absence or presence of PD98059 (10 μM), W123 (10 μM), CAY (10 μM), GPA2A (10 μM), PTX (100 ng/ml), or Gö6976 (10 μM). The cell lysates were collected and analyzed by Western blot. The fold of basal was defined as normalization of the data to the respective “0,” and then compared the data of corresponding time points of control vs inhibitor with a statistic method, as described in the section of Methods. Data are expressed as mean ± SEM of three individual experiments (n = 3). # p < 0.05, as compared with the cells treated with S1P alone.
FIGURE 6
FIGURE 6
S1P-induced COX-2 expression is mediated through p38 MAPK phosphorylation. (A) Cells pretreated with SB202190 for 1 h were followed by incubation with 15 μM S1P for 8 h. (B) Cells were transfected without or with COX-2 promoter-luciferase reporter gene, pretreated without or with SB202190 (30 μM) for 1 h, and then incubated with 15 μM S1P for 4 h (mRNA) or 1 h (promoter). The levels of COX-2 protein, mRNA expression, and promoter activity were individually examined by Western blot, real time-PCR, and promoter assay. (C) Cells transfected with p38α MAPK siRNA were incubated with S1P for 8 h. (D) Cells were incubated with S1P (15 μM) for the indicated time intervals in the absence or presence of SB202190 (30 μM), W123 (10 μM), CAY (10 μM), GPA2A (10 μM), or Gö6976 (10 μM) for 1 h and PTX (100 ng/ml) for 24 h. The cell lysates were collected and analyzed by Western blot. The fold of basal was defined as normalization of the data to the respective “0,” and then compared the data of corresponding time points of control vs inhibitor with a statistic method, as described in the section of Methods. Data are expressed as mean ± SEM of three individual experiments (n = 3). # p < 0.05, as compared with the cells treated with S1P alone.
FIGURE 7
FIGURE 7
JNK1/2 phosphorylation is involved in S1P-induced COX-2 expression. (A) After pretreatment with SP600125 for 1 h, cells were challenged with 15 μM S1P for 8 h. (B) Cells were transfected without or with COX-2 promoter-luciferase reporter gene, pretreated without or with SP600125 (10 μM) for 1 h, and then incubated with 15 μM S1P for 4 h (mRNA) or 1 h (promoter). The levels of COX-2 protein, mRNA expression, and promoter activity were determined by Western blot, real time-PCR, and promoter assay, respectively. (C) Cells were transfected with siRNA of JNK1 and then exposed to S1P for 8 h. (D) Cells were incubated with S1P (15 μM) for the indicated time intervals in the absence or presence of SP600125 (10 μM), W123 (10 μM), CAY (10 μM), GPA2A (10 μM), PTX (100 ng/ml), or Gö6976 (10 μM) for 1 h. The cell lysates were collected and analyzed by Western blot. The fold of basal was defined as normalization of the data to the respective “0,” and then compared the data of corresponding time points of control vs inhibitor with a statistic method, as described in the section of Methods. Data are expressed as mean ± SEM of three individual experiments (n = 3). # p < 0.05, as compared with the cells treated with S1P alone.
FIGURE 8
FIGURE 8
NF-κB is essential for S1P-induced COX-2 expression. (A) Cells were pretreated with helenalin for 1 h and then incubated with 15 μM S1P for 8 h. (B) Cells were transfected without or with COX-2 promoter-luciferase reporter gene, pretreated without or with helenalin (1 μM) for 1 h, and then incubated with 15 μM S1P for 4 h (mRNA) or 1 h (promoter). The levels of COX-2 protein, mRNA expression, and promoter activity were determined by Western blot, real time-PCR, and promoter assay, respectively. (C) Cells were transfected with siRNA of p65 and then exposed to S1P for 8 h. (D) Cells were incubated with S1P (15 μM) for the indicated time intervals. (E) Cells were treated with S1P (15 μM) for 15 min in the absence or presence of helenalin (1 μM). (D,E) The nuclear and cytosol fractions were prepared and analyzed by Western blot. The p65 NF-κB translocation by S1P was also determined by immunofluorescent staining as described in Materials and Methods. (F) To determine which S1PR subtypes, Gi or Gq protein, and MAPKs involved in S1P-stimulated the nuclear localization of p65 NF-κB, cells were incubated with S1P (15 μM) for 15 min in the absence or presence of Gö6976 (Gö, 10 μM), SB202190 (SB, 30 μM), SP600125 (SP, 10 μM), PD98059 (PD, 10 μM), W123 (W, 10 μM), CAY (10 μM), GPA2A (GPA, 10 μM), or PTX (100 ng/ml), and the nuclear fraction was analyzed by Western blot. To fit the construct of data layout, the data were rearranged from the same gel with the exception of non-related inhibitors and disclosed by the insertion of white spaces rearranged from the original capture. Data are expressed as mean ± SEM of three individual experiments (n = 3). # p < 0.05, as compared with the cells treated with S1P alone.
FIGURE 9
FIGURE 9
COX-2 promoter activity is stimulated by S1P through an NF-κB-dependent pathway. (A) Cells were incubated with S1P for the indicated time intervals (upper panel). Cells were pretreated with PD98059 (10 μM), SB202190 (30 μM), SP600125 (10 μM) for 1 h and then incubated with S1P for 30 min. The binding activity of NF-κB p65 and promoter was analyzed by ChIP assay (n = 3), as described in Methods. Left panel, to fit the construct of data layout, the data were rearranged from the same gel with the exception of non-related inhibitors and disclosed by the insertion of white spaces rearranged from the original capture. (B,C) Cells were transfected with an NF-κB-luciferase reporter gene, pretreated with W123 (10 μM), CAY (10 μM), GPA2A (10 μM), PTX (100 ng/ml), Gö6976 (10 μM), PD98059 (10 μM), SB202190 (30 μM), SP600125 (10 μM), or helenalin (1 μM) for 1 h and then incubated with S1P for 2 h. (D) The schematic picture represented two different 5′-promoter regions of the mouse COX-2 promoter constructs, both wild-type (WT) and mt-κB modified by single-point mutation of the κB binding site fused to the pGL-luciferase reporter gene. “↲ ” indicated the translational start site (+1) of the luciferase reporter gene. WT COX-2 promoter reporter gene (WT-COX-2) or NF-κB mutated COX-2 promoter reporter gene (mt-κB-COX-2) were transfected into cells, which then were incubated with or without S1P for 1 h. The promoter reporter activity was determined. (E) Cells were pretreated with W123, CAY, GPA2A, PTX, Gö6976, PD98059, SB202190, SP600125, or helenalin for 1 h and then incubated with S1P for 8 h. The PGE2 levels were analyzed by EIA. Data are expressed as mean ± SEM of three individual experiments (n = 3). # p < 0.05, as compared with the cells treated with S1P alone.
FIGURE 10
FIGURE 10
Schematic representation of signaling pathways involved in S1P-induced COX-2/PGE2 expression in HCFs. Binding of S1P to Gq- or PTX-sensitive Gi protein-coupled S1PR1/3 results in PKCα-dependent phosphorylation of MAPKs (i.e., p42/p44 MAPK, p38 MAPK, and JNK1/2) leading to activation of NF-κB. The COX-2 transcription is dependently regulated by MAPK-mediated NF-κB cascades. These signaling pathways contribute to d activation of NF-κB required for COX-2 expression and PGE2 generation in HCFs.

Similar articles

Cited by

References

    1. Aarthi J. J., Darendeliler M. A., Pushparaj P. N. (2011). Dissecting the role of the S1P/S1PR axis in health and disease. J. Dent. Res. 90 (7), 841–854. 10.1177/0022034510389178 - DOI - PubMed
    1. Ahmed N., Linardi D., Decimo I., Mehboob R., Gebrie M. A., Innamorati G., et al. (2017). Characterization and expression of sphingosine 1-phosphate receptors in human and rat heart. Front. Pharmacol. 8, 312 10.3389/fphar.2017.00312 - DOI - PMC - PubMed
    1. Alvarez S. E., Milstien S., Spiegel S. (2007). Autocrine and paracrine roles of sphingosine-1-phosphate. Trends Endocrinol. Metabol. 18 (8), 300–307. 10.1016/j.tem.2007.07.005 - DOI - PubMed
    1. Ammit A. J., Hastie A. T., Edsall L. C., Hoffman R. K., Amrani Y., Krymskaya V. P., et al. (2001). Sphingosine 1‐phosphate modulates human airway smooth muscle cell functions that promote inflammation and airway remodeling in asthma. Faseb. J. 15 (7), 1212–1214. 10.1096/fj.00-0742fje - DOI - PubMed
    1. Barnes P. J., Karin M. (1997). Nuclear factor-κB - a pivotal transcription factor in chronic inflammatory diseases. N. Engl. J. Med. 336 (15), 1066–1071. 10.1056/NEJM199704103361506 - DOI - PubMed