. 2020 Oct 26:11:1092.
doi: 10.3389/fphys.2020.01092. eCollection 2020.

OGT-Mediated KEAP1 Glycosylation Accelerates NRF2 Degradation Leading to High Phosphate-Induced Vascular Calcification in Chronic Kidney Disease

Affiliations

OGT-Mediated KEAP1 Glycosylation Accelerates NRF2 Degradation Leading to High Phosphate-Induced Vascular Calcification in Chronic Kidney Disease

Tian-Hua Xu et al. Front Physiol. .

Retraction in

Abstract

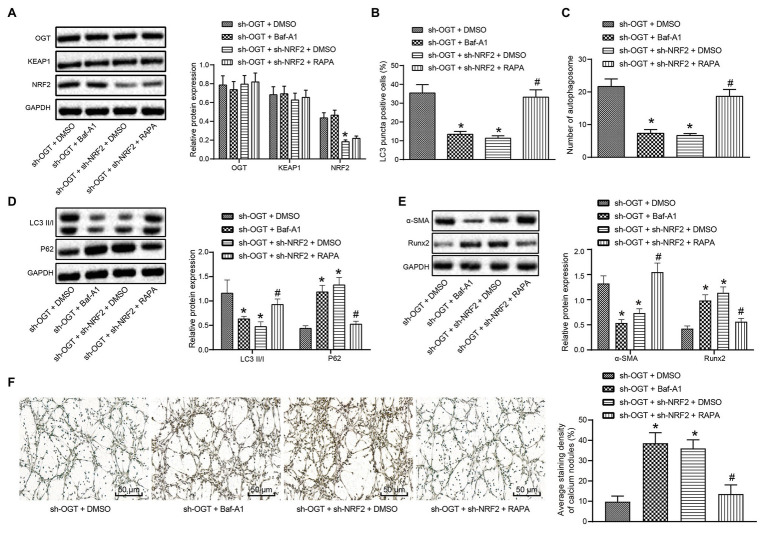
Unraveling the complex regulatory pathways that mediate the effects of phosphate on vascular smooth muscle cells (VSMCs) may provide novel targets and therapies to limit the destructive effects of vascular calcification (VC) in patients with chronic kidney disease (CKD). Our previous studies have highlighted several signaling networks associated with VSMC autophagy, but the underlying mechanisms remain poorly understood. Thereafter, the current study was performed to characterize the functional relevance of O-linked N-acetylglucosamine (GlcNAc) transferase (OGT) in high phosphate-induced VC in CKD settings. We generated VC models in 5/6 nephrectomized rats in vivo and VSMC calcification models in vitro. Artificial modulation of OGT (knockdown and overexpression) was performed to explore the role of OGT in VSMC autophagy and VC in thoracic aorta, and in vivo experiments were used to substantiate in vitro findings. Mechanistically, co-immunoprecipitation (Co-IP) assay was performed to examine interaction between OGT and kelch like ECH associated protein 1 (KEAP1), and in vivo ubiquitination assay was performed to examine ubiquitination extent of nuclear factor erythroid 2-related factor 2 (NRF2). OGT was highly expressed in high phosphate-induced 5/6 nephrectomized rats and VSMCs. OGT silencing was shown to suppress high phosphate-induced calcification of VSMCs. OGT enhances KEAP1 glycosylation and thereby results in degradation and ubiquitination of NRF2, concurrently inhibiting VSMC autophagy to promote VSMC calcification in 5/6 nephrectomized rats. OGT inhibits VSMC autophagy through the KEAP1/NRF2 axis and thus accelerates high phosphate-induced VC in CKD.

Keywords: O-linked N-acetylglucosamine transferase; autophagy; chronic kidney disease; high phosphorus; kelch like ECH associated protein 1; nuclear factor erythroid 2-related factor 2; vascular calcification; vascular smooth muscle cell.


Figures

Figure 1
Figure 1
O-linked N-acetylglucosamine (GlcNAc) transferase (OGT) is highly expressed in vascular calcification (VC) rat models with chronic kidney disease (CKD) and in cell models of vascular smooth muscle cell (VSMC) calcification. (A) Quantitative analysis for levels of blood urea nitrogen (BUN), creatinine (SCr), calcium (SCa), and phosphate (SPi) in rat models as detected by kits. (B) Alizarin red S (ARS) staining and quantitative analysis showing calcified nodules in thoracic aorta of rat models. Black arrows indicate calcified nodules. (C) Von Kossa staining and quantitative analysis showing calcium deposition in cell models. (D) Western blot analysis of protein levels of calcification indicators Runx2 and α-smooth muscle actin (α-SMA) normalized to glyceraldehyde-3-phosphate dehydrogenase (GAPDH) in cell models. (E) Immunohistochemical analysis of OGT expression patterns in thoracic aorta of rat models. (F) Quantitative analysis for OGT mRNA expression patterns in cell models as detected by reverse transcription quantitative polymerase chain reaction (RT-qPCR). (G) Western blot analysis of protein levels of OGT normalized to GAPDH in the cell models. *p < 0.05 vs. sham-operated rats or control cells (n = 8 rats in normal group, sham group, and model group, and in vitro experiments were repeated three times independently in the control and VC groups).
Figure 2
Figure 2
Silencing of OGT alleviates high phosphate-induced calcification in VSMCs. (A) Quantitative analysis for silencing efficiency of short hairpin RNAs (shRNAs) targeting OGT in VC cell models as detected by RT-qPCR. (B) Western blot analysis of OGT silencing efficiency of VC cell models normalized to GAPDH. (C) Western blot analysis of expression patterns of calcification-related proteins Runx2 and α-SMA normalized to GAPDH in response to OGT silencing. (D) Von Kossa staining and quantitative analysis showing calcium deposition in cell models. *p < 0.05 vs. cells transduced with shRNA negative control (sh-NC; in vitro experiments were repeated three times independently).
Figure 3
Figure 3
OGT overexpression accelerates kelch like ECH associated protein 1 (KEAP1) glycosylation leading to degradation of nuclear factor erythroid 2-related factor 2 (NRF2). (A) Immunohistochemical detection of KEAP1 and NRF2 expression patterns in rat models. (B) RT-qPCR detection of mRNA expression patterns of KEAP1 and NRF2 in cell models. (C) Western blot assay of protein levels of KEAP1 and NRF2 normalized to GAPDH in cell models. (D) Co-immunoprecipitation (Co-IP) assay showing the interaction between OGT and KEAP1. (E) IP and western blot assay of total protein and glycosylation of KEAP1 normalized to GAPDH in response to OGT overexpression. (F) IP and western blot assays of glycosylation of KEAP1 normalized to GAPDH in response to KEAP1 mutant (Mut). (G) IP and western blot assays of NRF2 ubiquitination extent normalized to GAPDH in response to KEAP1 Mut. (H) Western blot assay of protein levels of OGT, KEAP1, and NRF2 normalized to GAPDH in response to OGT overexpression and KEAP1 knockdown. *p < 0.05 vs. sham-operated rats, control cells, cells transduced with oe-NC, cells transduced with sh-NC, or cells transduced with oe-NC + sh-NC. #p < 0.05 vs. cells transduced with oe-OGT + sh-NC (n = 8 rats in normal group, sham group, and model group, and in vitro experiments were repeated three times independently in other groups).
Figure 4
Figure 4
OGT silencing restricts calcification of VSMCs through inhibiting KEAP1-induced NRF2 degradation. (A) RT-qPCR detection of silencing efficiency of shRNAs targeting NRF2 in VSMCs. (B) Western blot assay of silencing efficiency of shRNAs targeting NRF2 normalized to GAPDH in VSMCs. (C) Western blot assay of protein levels of OGT, KEAP1, and NRF2 normalized to GAPDH in response to OGT knockdown and NRF2 knockdown. (D) Western blot analysis of expression patterns of calcification-related proteins Runx2 and α-SMA normalized to GAPDH in response to OGT knockdown and NRF2 knockdown. (E) Von Kossa staining and quantitative analysis showing calcium deposition in VSMCs in response to OGT knockdown and NRF2 knockdown. *p < 0.05 vs. cells transduced with sh-NC. #p < 0.05 vs. cells transduced with sh-OGT (in vitro experiments were repeated three times independently).
Figure 5
Figure 5
OGT inhibits cell autophagy through the KEAP1/NRF2 axis. (A) Quantitative analysis of immunofluorescence assay for proportion of LC3-positive cells in response to OGT knockdown and NRF2 knockdown. (B) Quantitative analysis of autophagosomes formation in response to OGT knockdown and NRF2 knockdown. (C) Western blot analysis of autophagy-related proteins light chain 3II (LC3II)/I and P62 normalized to GAPDH in response to OGT knockdown and NRF2 knockdown. *p < 0.05 vs. cells transduced with sh-NC; #p < 0.05 vs. cells transduced with sh-OGT (in vitro experiments were repeated three times independently).
Figure 6
Figure 6
OGT accelerates VSMC calcification by curbing cell autophagy via the KEAP1/NRF2 axis. (A) Western blot analysis of protein levels of OGT, KEAP1, and NRF2 normalized to GAPDH in response to OGT knockdown, NRF2 knockdown, bafilomycin A1 (Baf-A1), and rapamycin (RAPA). (B) Quantitative analysis of immunofluorescence assay for proportion of LC3-positive cells in response to OGT knockdown, NRF2 knockdown, Baf-A1, and RAPA. (C) Quantitative analysis of autophagosomes formation in response to OGT knockdown, NRF2 knockdown, Baf-A1, and RAPA. (D) Western blot analysis of autophagy-related proteins LC3II/I, and P62 normalized to GAPDH in response to OGT knockdown, NRF2 knockdown, Baf-A1, and RAPA. (E) Western blot analysis of calcification-related proteins Runx2 and α-SMA normalized to GAPDH in response to OGT knockdown, NRF2 knockdown, Baf-A1, and RAPA. (F) Von Kossa staining and quantitative analysis showing calcium deposition of VSMCs in response to OGT knockdown, NRF2 knockdown, Baf-A1, and RAPA. *p < 0.05 vs. cells transduced with sh-OGT + DMSO. #p < 0.05 vs. cells transduced with sh-OGT + sh-NRF2 + DMSO (in vitro experiments were repeated three times independently).
Figure 7
Figure 7
OGT inhibits autophagy through the KEAP1/NRF2 axis and accelerates high phosphate-induced VC in 5/6 nephrectomy (5/6 Nx) rats. (A) Western blot analysis of protein levels of OGT, KEAP1, and NRF2 normalized to GAPDH in rats. (B) Western blot analysis of autophagy-related proteins LC3II/I, and P62 proteins normalized to GAPDH in rats. (C) Western blot analysis of calcification-related proteins Runx2 and α-SMA normalized to GAPDH in rats. (D) Quantitative analysis of ARS staining showing calcified nodules in thoracic aorta of rats. Black arrows indicate calcified nodules. *p < 0.05 vs. rats treated with sh-NC + DMSO. #p < 0.05 vs. rats treated with sh-OGT + DMSO. &p < 0.05 vs. rats treated with sh-OGT + sh-NRF2 + DMSO (n = 8 rats in each group).
Figure 8
Figure 8
OGT enhances KEAP1 glycosylation leading to NRF2 degradation and inhibits VSMC autophagy, thereby promoting high phosphate-induced VC in CKD. In high phosphate-induced VSMCs, the expression of OGT and KEAP1 is elevated. OGT elevates glycosylation at KEAP1 S104 and then accelerates the degradation and ubiquitination of NRF2 to reduce NRF2 expression and to prevent its translocation into nuclei. At this point, calcification is facilitated in VSMCs due to promoted the expression of Runx2 as well as inhibited α-SMA expression and autophagy of cells.

References

    1. Andres-Bergos J., Tardio L., Larranaga-Vera A., Gomez R., Herrero-Beaumont G., Largo R. (2012). The increase in O-linked N-acetylglucosamine protein modification stimulates chondrogenic differentiation both in vitro and in vivo. J. Biol. Chem. 287, 33615–33628. 10.1074/jbc.M112.354241, PMID: - DOI - PMC - PubMed
    1. Angelova M., Ortiz-Meoz R. F., Walker S., Knipe D. M. (2015). Inhibition of O-linked N-acetylglucosamine transferase reduces replication of herpes simplex virus and human cytomegalovirus. J. Virol. 89, 8474–8483. 10.1128/JVI.01002-15, PMID: - DOI - PMC - PubMed
    1. Best S. A., Ding S., Kersbergen A., Dong X., Song J. Y., Xie Y., et al. . (2019). Distinct initiating events underpin the immune and metabolic heterogeneity of KRAS-mutant lung adenocarcinoma. Nat. Commun. 10:4190. 10.1038/s41467-019-12164-y, PMID: - DOI - PMC - PubMed
    1. Cappato S., Tonachini L., Giacopelli F., Tirone M., Galietta L. J., Sormani M., et al. . (2016). High-throughput screening for modulators of ACVR1 transcription: discovery of potential therapeutics for fibrodysplasia ossificans progressiva. Dis. Model. Mech. 9, 685–696. 10.1242/dmm.023929, PMID: - DOI - PMC - PubMed
    1. Chen P. H., Smith T. J., Wu J., Boyce M., Chi J. T. A., Chen P. H., et al. (2017a). Abstract 5457: OGT restrains the NRF2 antioxidant pathway via O-GlcNAcylation of KEAP1. Mol. Cell Biol. Genet. 77:5457. 10.1158/1538-7445.AM2017-5457 - DOI

Publication types