

Brain Age Prediction of Children Using Routine Brain MR Images via Deep Learning
- PMID: 33193046
- PMCID: PMC7604456
- DOI: 10.3389/fneur.2020.584682
Brain Age Prediction of Children Using Routine Brain MR Images via Deep Learning
Abstract
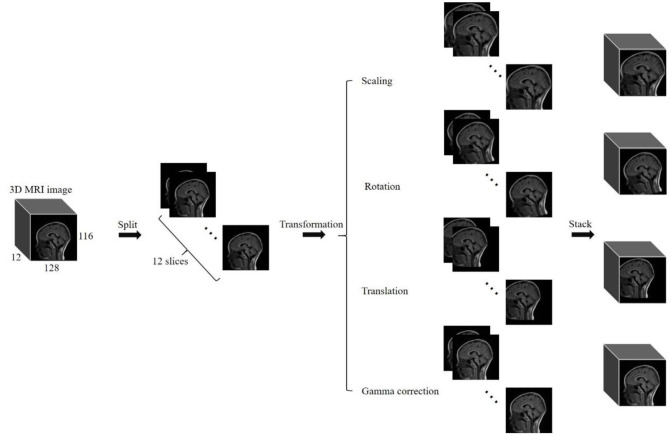
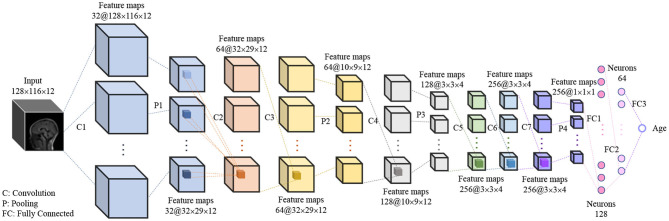
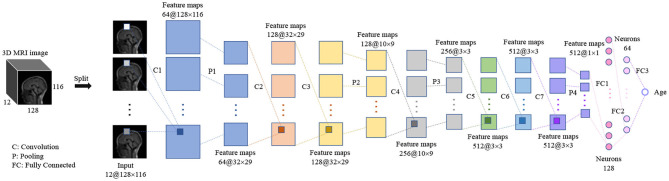
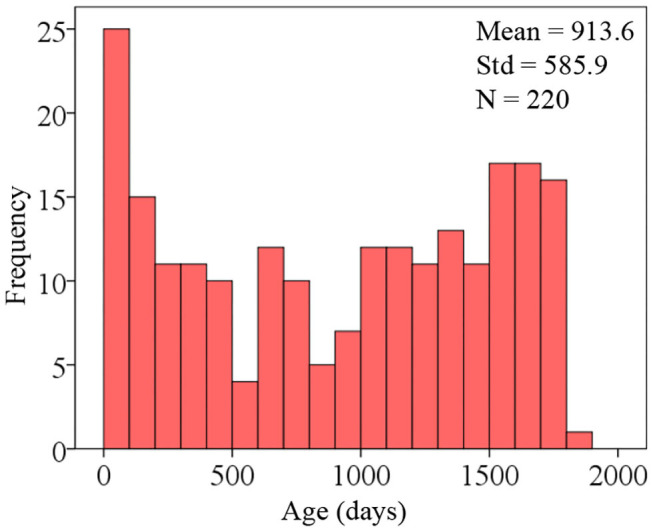
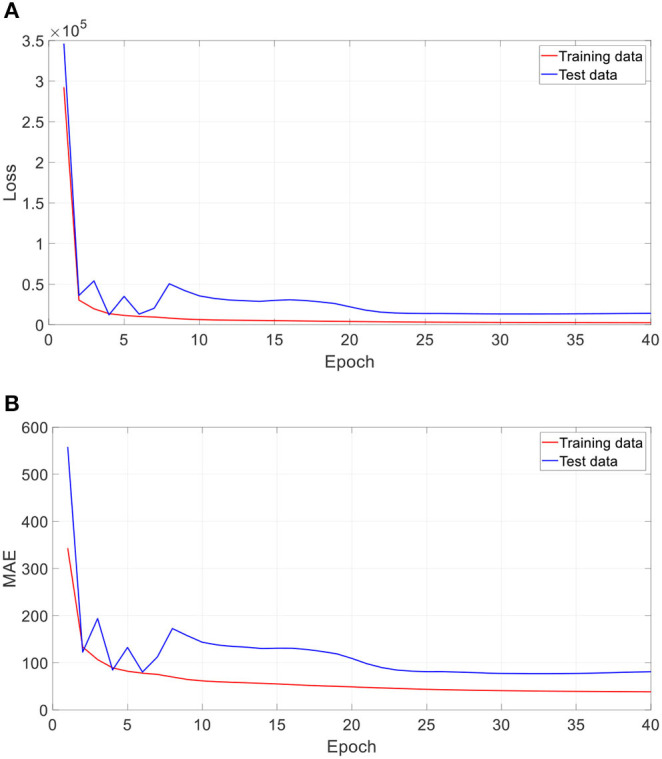
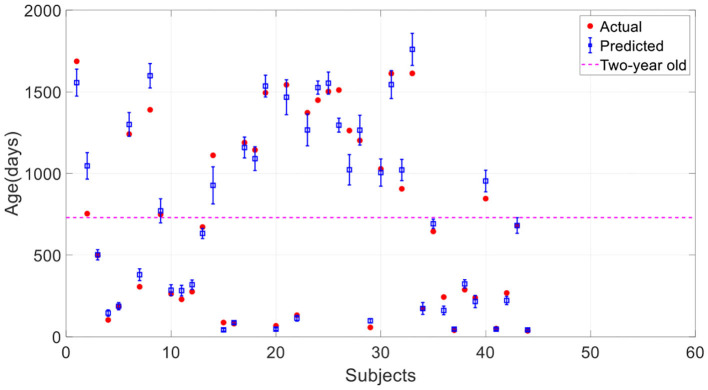
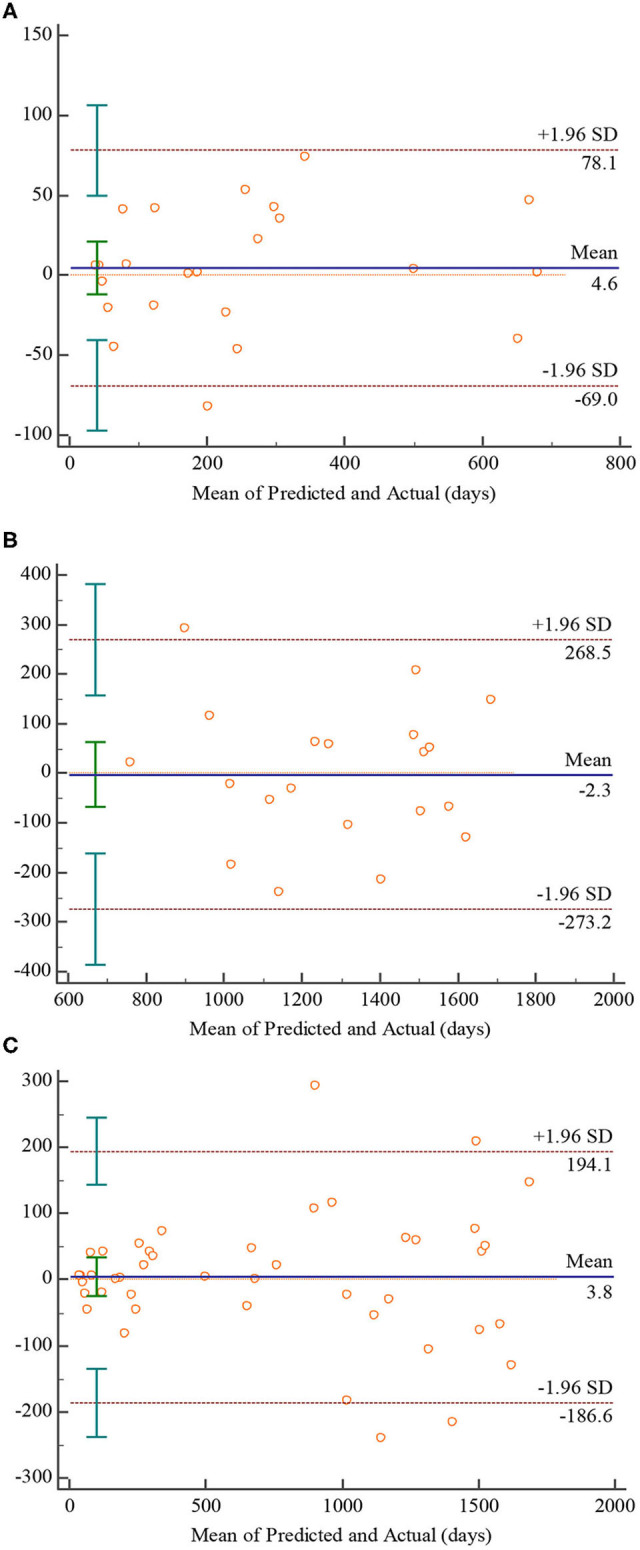
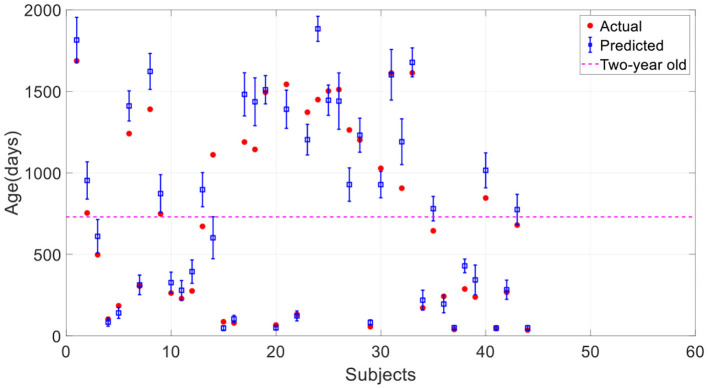
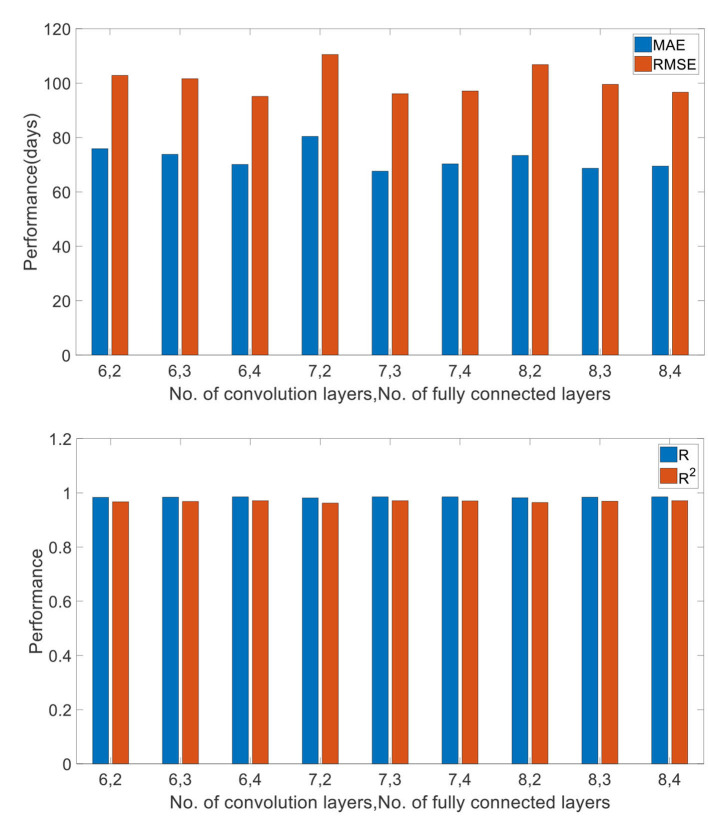
Predicting brain age of children accurately and quantitatively can give help in brain development analysis and brain disease diagnosis. Traditional methods to estimate brain age based on 3D magnetic resonance (MR), T1 weighted imaging (T1WI), and diffusion tensor imaging (DTI) need complex preprocessing and extra scanning time, decreasing clinical practice, especially in children. This research aims at proposing an end-to-end AI system based on deep learning to predict the brain age based on routine brain MR imaging. We spent over 5 years enrolling 220 stacked 2D routine clinical brain MR T1-weighted images of healthy children aged 0 to 5 years old and randomly divided those images into training data including 176 subjects and test data including 44 subjects. Data augmentation technology, which includes scaling, image rotation, translation, and gamma correction, was employed to extend the training data. A 10-layer 3D convolutional neural network (CNN) was designed for predicting the brain age of children and it achieved reliable and accurate results on test data with a mean absolute deviation (MAE) of 67.6 days, a root mean squared error (RMSE) of 96.1 days, a mean relative error (MRE) of 8.2%, a correlation coefficient (R) of 0.985, and a coefficient of determination (R 2) of 0.971. Specially, the performance on predicting the age of children under 2 years old with a MAE of 28.9 days, a RMSE of 37.0 days, a MRE of 7.8%, a R of 0.983, and a R 2 of 0.967 is much better than that over 2 with a MAE of 110.0 days, a RMSE of 133.5 days, a MRE of 8.2%, a R of 0.883, and a R 2 of 0.780.
Keywords: artificial intelligence; brain age; convolutional neural network; deep learning; magnetic resonance imaging.
Copyright © 2020 Hong, Feng, Wang, Peet, Zhang, Sun and Yang.
Figures
Similar articles
-
Deep learning approaches using 2D and 3D convolutional neural networks for generating male pelvic synthetic computed tomography from magnetic resonance imaging.Med Phys. 2019 Sep;46(9):3788-3798. doi: 10.1002/mp.13672. Epub 2019 Jul 26. Med Phys. 2019. PMID: 31220353
-
Automation of a Rule-based Workflow to Estimate Age from Brain MR Imaging of Infants and Children Up to 2 Years Old Using Stacked Deep Learning.Magn Reson Med Sci. 2023 Jan 1;22(1):57-66. doi: 10.2463/mrms.mp.2021-0068. Epub 2021 Dec 10. Magn Reson Med Sci. 2023. PMID: 34897147 Free PMC article.
-
Deep learning-based convolutional neural network for intramodality brain MRI synthesis.J Appl Clin Med Phys. 2022 Apr;23(4):e13530. doi: 10.1002/acm2.13530. Epub 2022 Jan 19. J Appl Clin Med Phys. 2022. PMID: 35044073 Free PMC article.
-
MR-based synthetic CT generation using a deep convolutional neural network method.Med Phys. 2017 Apr;44(4):1408-1419. doi: 10.1002/mp.12155. Epub 2017 Mar 21. Med Phys. 2017. PMID: 28192624
-
Quantitative assessment of neurodevelopmental maturation: a comprehensive systematic literature review of artificial intelligence-based brain age prediction in pediatric populations.Front Neuroinform. 2024 Nov 12;18:1496143. doi: 10.3389/fninf.2024.1496143. eCollection 2024. Front Neuroinform. 2024. PMID: 39601012 Free PMC article.
Cited by
-
A novel deep learning-based brain age prediction framework for routine clinical MRI scans.NPJ Aging. 2025 Jul 29;11(1):70. doi: 10.1038/s41514-025-00260-x. NPJ Aging. 2025. PMID: 40730571 Free PMC article.
-
Diffusion deep learning for brain age prediction and longitudinal tracking in children through adulthood.Imaging Neurosci (Camb). 2024 Mar 25;2:imag-2-00114. doi: 10.1162/imag_a_00114. eCollection 2024. Imaging Neurosci (Camb). 2024. PMID: 40800341 Free PMC article.
-
Linking Brain Age Gap to Mental and Physical Health in the Berlin Aging Study II.Front Aging Neurosci. 2022 Jul 22;14:791222. doi: 10.3389/fnagi.2022.791222. eCollection 2022. Front Aging Neurosci. 2022. PMID: 35936763 Free PMC article.
-
Constructing brain functional network by Adversarial Temporal-Spatial Aligned Transformer for early AD analysis.Front Neurosci. 2022 Nov 28;16:1087176. doi: 10.3389/fnins.2022.1087176. eCollection 2022. Front Neurosci. 2022. PMID: 36518529 Free PMC article.
-
Brain Functional Network Generation Using Distribution-Regularized Adversarial Graph Autoencoder with Transformer for Dementia Diagnosis.Comput Model Eng Sci. 2023 Aug 3;137(3):2129-2147. doi: 10.32604/cmes.2023.028732. Comput Model Eng Sci. 2023. PMID: 38566839 Free PMC article.
References
Grants and funding
LinkOut - more resources
Full Text Sources