. 2020 Oct 23:11:550674.
doi: 10.3389/fmicb.2020.550674. eCollection 2020.

Positive Selection of ORF1ab, ORF3a, and ORF8 Genes Drives the Early Evolutionary Trends of SARS-CoV-2 During the 2020 COVID-19 Pandemic

Affiliations

Positive Selection of ORF1ab, ORF3a, and ORF8 Genes Drives the Early Evolutionary Trends of SARS-CoV-2 During the 2020 COVID-19 Pandemic

Lauro Velazquez-Salinas et al. Front Microbiol. .

Abstract

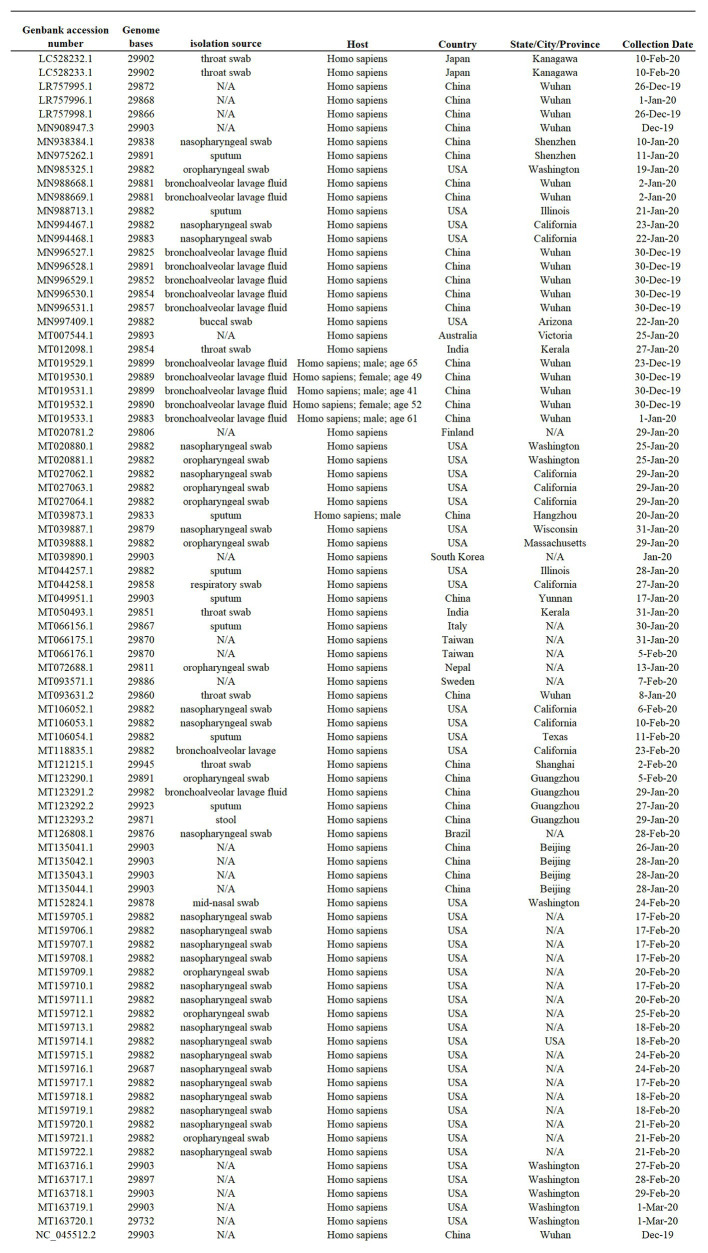
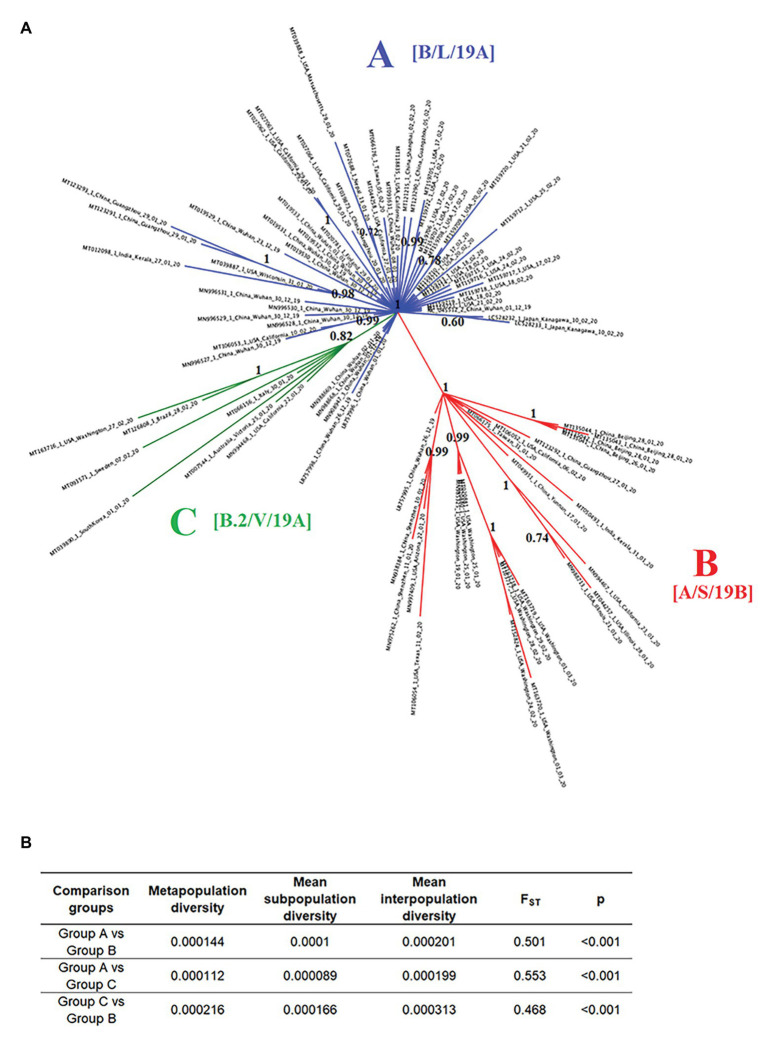
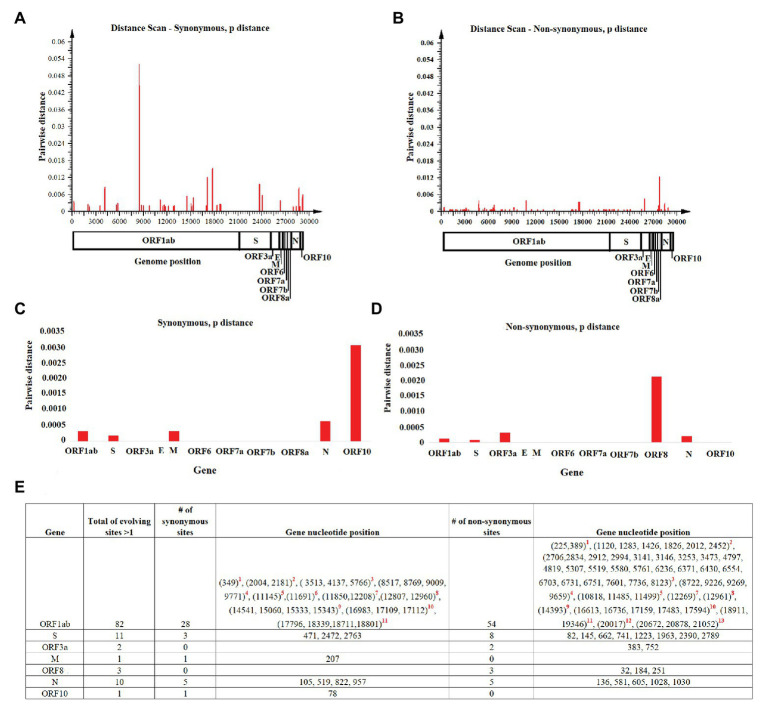
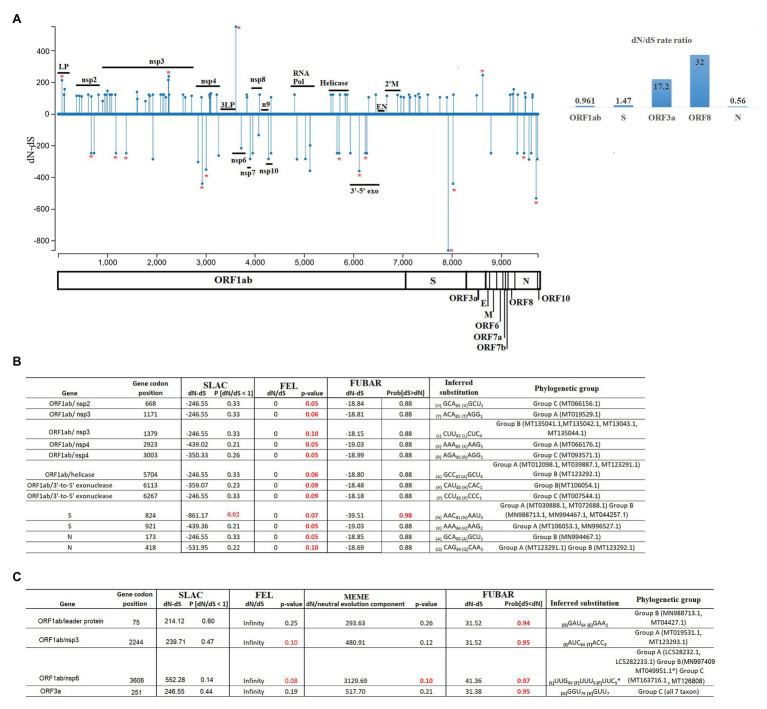
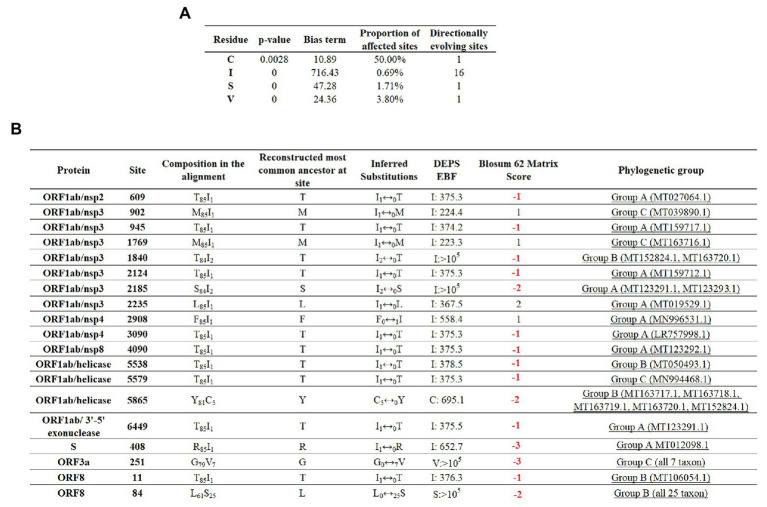
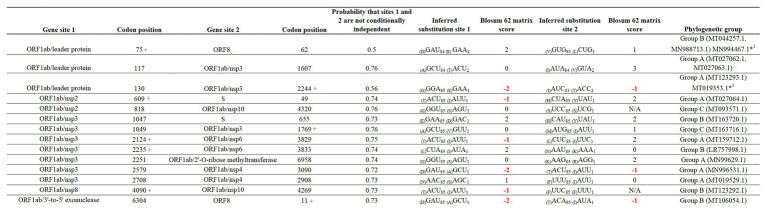
In this study, we analyzed full-length SARS-CoV-2 genomes from multiple countries to determine early trends in the evolutionary dynamics of the novel COVID-19 pandemic. Results indicated SARS-CoV-2 evolved early into at least three phylogenetic groups, characterized by positive selection at specific residues of the accessory proteins ORF3a and ORF8. Also, we are reporting potential relevant sites under positive selection at specific sites of non-structural proteins nsp6 and helicase. Our analysis of co-evolution showed evidence of epistatic interactions among sites in the genome that may be important in the generation of variants adapted to humans. These observations might impact not only public health but also suggest that more studies are needed to understand the genetic mechanisms that may affect the development of therapeutic and preventive tools, like antivirals and vaccines. Collectively, our results highlight the identification of ongoing selection even in a scenario of conserved sequences collected over the first 3 months of this pandemic.

Keywords: COVID-19; SARS-CoV2; epistasis; evolution; positive selection.


Figures

Figure 1
Figure 1
Sample summary. Description of the 86 SARS-Cov-2 full-length genome sequences included in this study. All sequences were obtained form I from the NCBI severe acute respiratory syndrome coronavirus 2 (SARS-Cov-2) data hub, accession number, genome length, isolate name, source, host, and country of origin are provided. N/A indicates information not available.
Figure 2
Figure 2
Phylogeny and population structure analysis of SARS-Cov-2. (A) Bayesian tree reconstructed using 86 SARS-Cov-2 full-length genomes collected from patients naturally infected at different countries, showing the existence of three phylogenetic groups: A (blue), B (red), and C (green). Numbers over the nodes represent their posterior probability. Information in the brackets corresponds with the current nomenclature proposed to describe different lineages reported in our study (https://www.gisaid.org/references/statements-clarifications/clade-and-lineage-nomenclature-aids-in-genomic-epidemiology-of-active-hcov-19-viruses/). (B) Intra- and inter-subpopulation diversity among phylogenetic groups was compared to determine the extent of population structure. FST values >0.33 (p < 0.001) were consider significant.
Figure 3
Figure 3
Pairwise distance analysis. Pairwise distance analysis at (A) synonymous and (B) non-synonymous nucleotide sites was conducted using the program Sequence Distances (software SSE). Red bars represent pairwise distance comparisons using a sliding window of 50 nucleotides. Average nucleotide pairwise distance for different genes is shown at (C) synonymous and (D) non-synonymous sites. (E) Fast-evolving synonymous and non-synonymous sites at each coding region are shown. For these sites, evolutionary rates oscillated between 4.97 and 4.95. Red numbers represent nucleotides at: (1) leader protein, (2) nsp2, (3) nsp3, (4) nsp4, (5) nsp6, (6) nsp7, (7) nsp8, (8) nsp10, (9) RNA independent polymerase, (10) helicase, (11) 3' to 5' exonuclease, (12) endoRNAse, and (13) 2'-O-ribose methyltransferase.
Figure 4
Figure 4
Diversifying and purifying selection on SARS-CoV-2. (A) General overview obtained by SLAC analysis, showing the evolutionary rate (dN-dS or dN/dS) along the genome and at individual genes of SARS-CoV-2. Statistically significant codons were inferred by multiple evolutionary tests used in this study. Red asterisks represent codons with significant evidence for selection. Codons evolving at (B) purifying (negative) or (C) diversifying (positive) selection are shown numbers in red represent evolutionary tests with significant values according to the analysis: SLAC, FEL, MEME (p = 0.1), and FUBAR (posterior probability = 0.9). The criteria for considering a site positively or negatively selected was based on their identification by at least one of the tests. The phylogenetic group column (assigned according with Figure 2A) shows also the isolates carrying the substitutions. LP, leader protein; 3LP, 3C-like proteinase; n9, nsp9; 3'-5' exo, 3' to 5' exonuclease; EN, endoRNAse; and 2'M, 2'-O-ribose methyltransferase.
Figure 5
Figure 5
Directional selection analysis on SARS-CoV-2. (A) An amino acid alignment was evaluated by DEPS and four different residues producing 19 directionally evolving sites in the proteome of SARS-CoV-2 are reported. Values of p show the statistical significance of each residue considering a model test of selection vs. not selection. Bias term: alignment-wide relative rate of substitution toward target residue. Proportion of affected sites: percentage of sites evolving under a directional model vs. a standard model with no directionality. Directionally evolving sites: number of sites that show evidence of directional selection for focal residue. (B) Description of 19 directionally evolving sites. Sites were detected by Empirical Bayesian Factor (EBF) considering a cut-off of 100 or more. Numbers in red represent replacements between amino acids with different properties. The phylogenetic group column (assigned according with Figure 2A) shows also the isolates carrying the substitutions.
Figure 6
Figure 6
Coevolution between codon pairs in the genome of SARS-CoV-2. BMG analysis was conducted to detect coevolving codon pairs. Evidence of 14 coevolving codon pairs was detected and the specific locations of those in the genome of SARS-CoV-2 are presented. Posterior probability of pair associations was supported by Markov Chain Monte Carlo Analysis at cut-off of 50 or more. Numbers in red represent replacements between amino acids with different properties. The phylogenetic group column (assigned according with Figure 2A) shows also the isolates carrying the substitutions. *1Represents viral isolated where the changes were not detected. Red + represents codons under positive selection, in which coevolution with other codon might represent and epistatic event.

References

    1. Alm E., Broberg E. K., Connor T., Hodcroft E. B., Komissarov A. B., Maurer-Stroh S., et al. . (2020). Geographical and temporal distribution of SARS-CoV-2 clades in the WHO European region, January to June 2020. Euro Surveill. 25:2001410. 10.2807/1560-7917.ES.2020.25.32.2001410, PMID: - DOI - PMC - PubMed
    1. Andersen K. G., Rambaut A., Lipkin W. I., Holmes E. C., Garry R. F. (2020). The proximal origin of SARS-CoV-2. Nat. Med. 26, 450–452. 10.1038/s41591-020-0820-9, PMID: - DOI - PMC - PubMed
    1. Bandelt H. J., Forster P., Rohl A. (1999). Median-joining networks for inferring intraspecific phylogenies. Mol. Biol. Evol. 16, 37–48. 10.1093/oxfordjournals.molbev.a026036, PMID: - DOI - PubMed
    1. Benvenuto D., Angeletti S., Giovanetti M., Bianchi M., Pascarella S., Cauda R., et al. . (2020). Evolutionary analysis of SARS-CoV-2: how mutation of non-structural protein 6 (NSP6) could affect viral autophagy. J. Infect. 81, e24–e27. 10.1016/j.jinf.2020.03.058, PMID: - DOI - PMC - PubMed
    1. Chookajorn T. (2020). Evolving COVID-19 conundrum and its impact. Proc. Natl. Acad. Sci. U. S. A. 117, 12520–12521. 10.1073/pnas.2007076117, PMID: - DOI - PMC - PubMed