. 2020 Oct 26:11:556813.
doi: 10.3389/fimmu.2020.556813. eCollection 2020.

Characterization of Polysaccharide A Response Reveals Interferon Responsive Gene Signature and Immunomodulatory Marker Expression

Affiliations

Characterization of Polysaccharide A Response Reveals Interferon Responsive Gene Signature and Immunomodulatory Marker Expression

Carlos A Alvarez et al. Front Immunol. .

Abstract

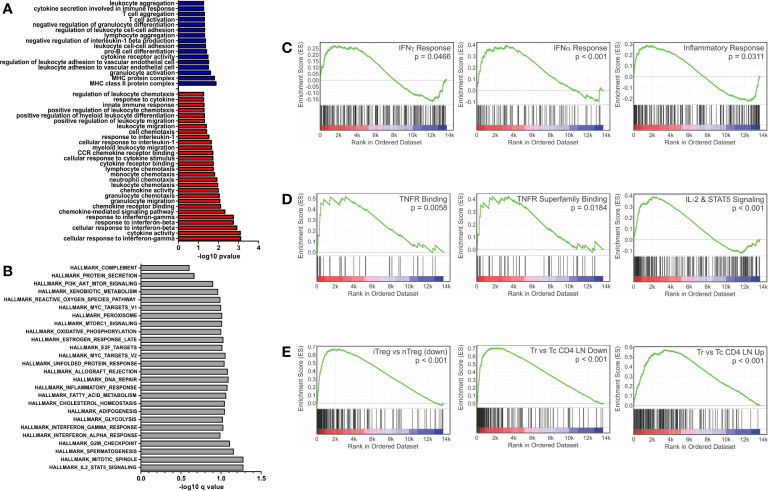
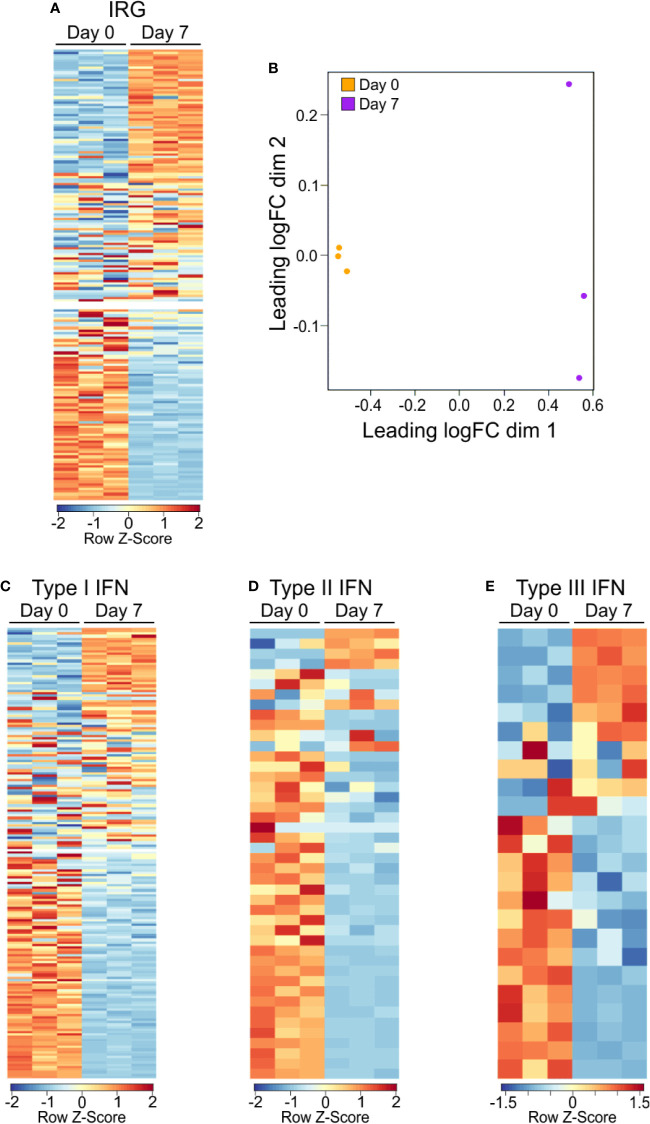
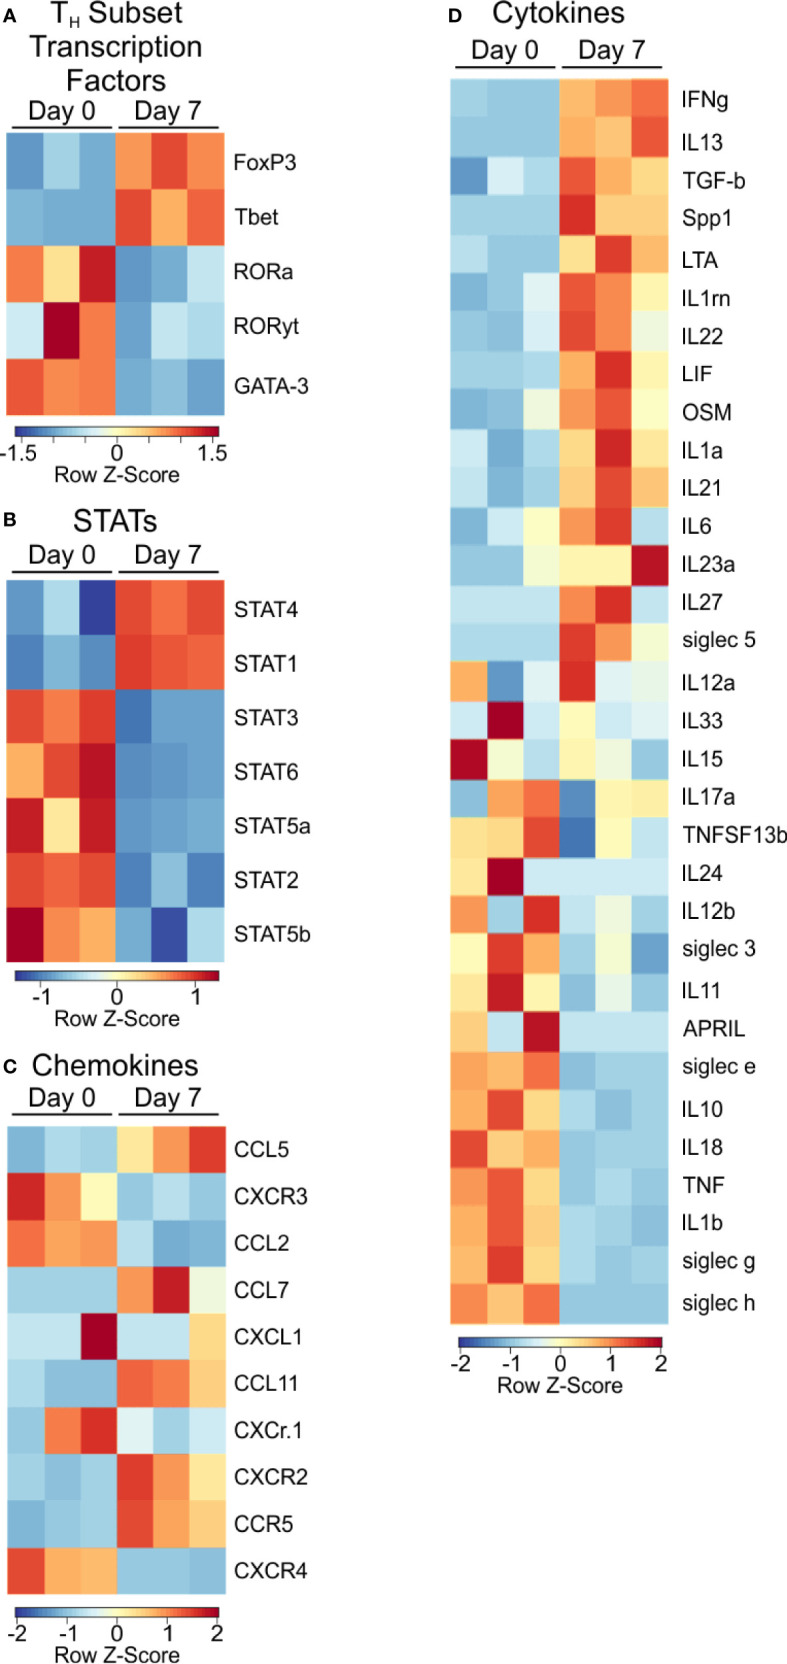
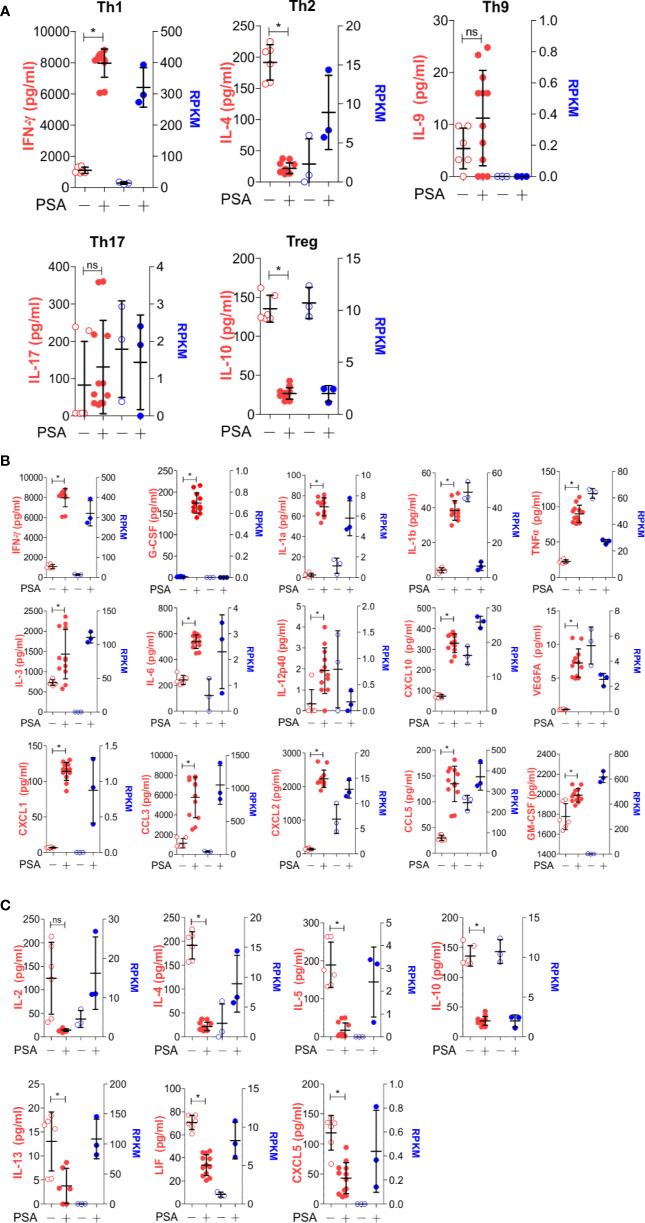
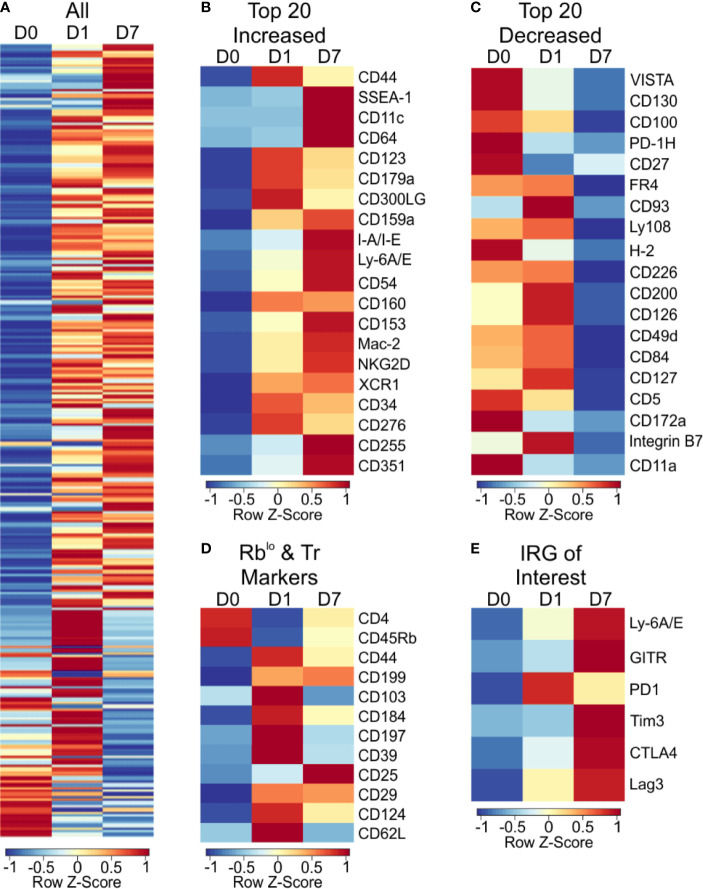
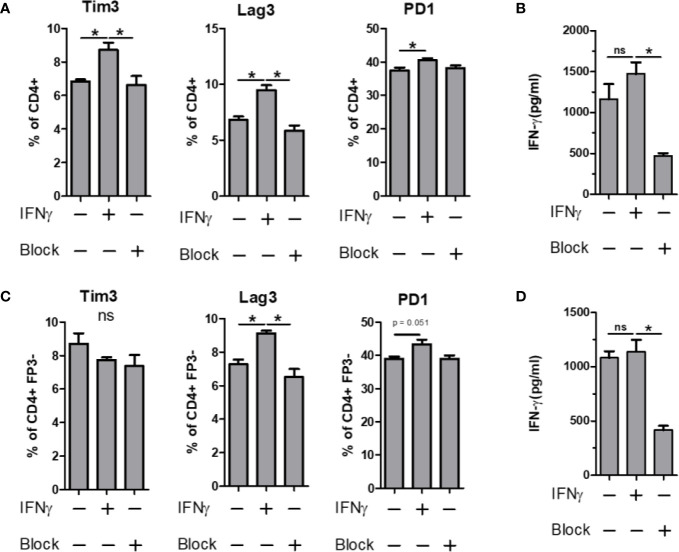
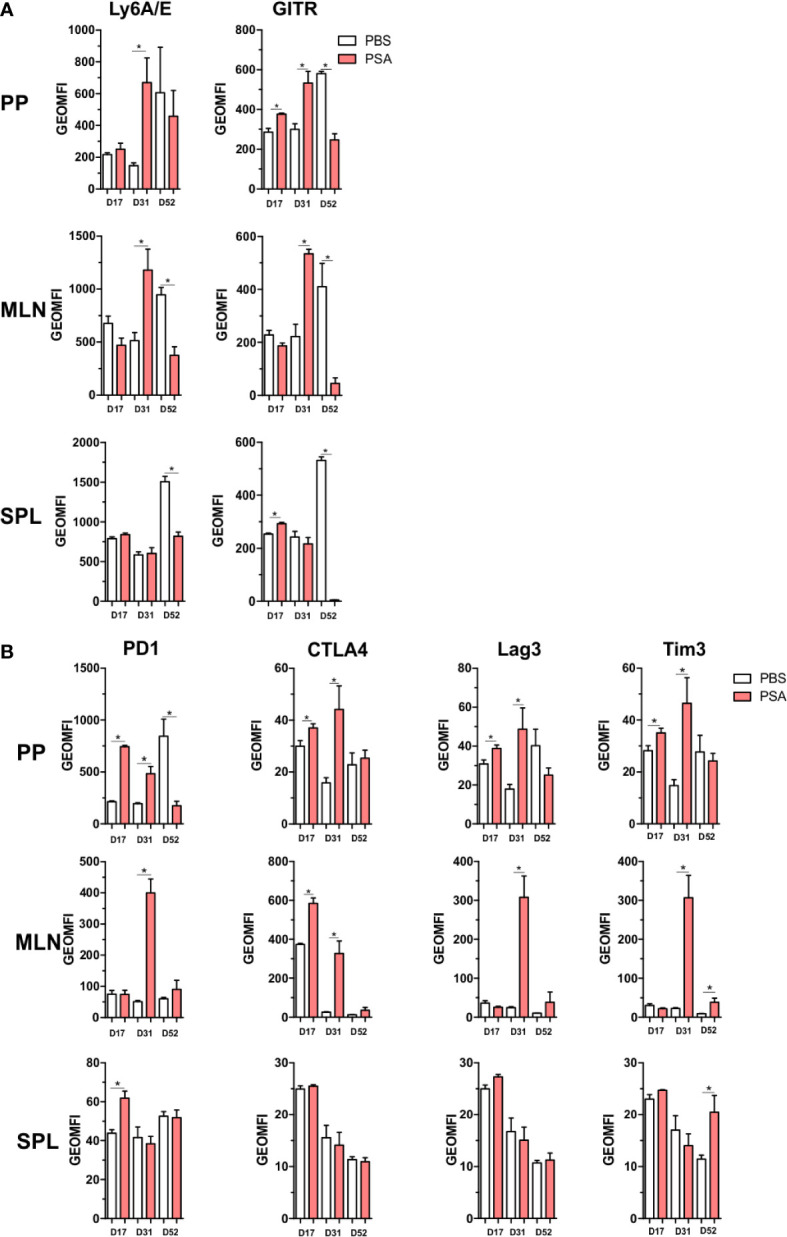
Polysaccharide A (PSA), a capsular carbohydrate from the commensal gut bacteria Bacteroides fragilis, has been shown to possess both potent T cell-dependent pro- and anti-inflammatory properties. PSA is able to induce abscess and adhesion formation in sepsis models, but can also inhibit asthma, inflammatory bowel disease (IBD) and experimental autoimmune encephalomyelitis (EAE) through MHCII-dependent activation of CD4+ T cells. Yet, despite decades of study, the ability of PSA to balance both these pro- and anti-inflammatory responses remains poorly understood. Here, we utilized an unbiased systems immunology approach consisting of RNAseq transcriptomics, high-throughput flow cytometry, and Luminex analysis to characterize the full impact of PSA-mediated stimulation of CD4+ T cells. We found that exposure to PSA resulted in the upregulation and secretion of IFNγ, TNFα, IL-6, and CXCL10, consistent with an interferon responsive gene (IRG) signature. Importantly, PSA stimulation also led to expression of immune checkpoint markers Lag3, Tim3, and, especially, PD1, which were also enriched and sustained in the gut associated lymphoid tissue of PSA-exposed mice. Taken together, PSA responding cells display an unusual mixture of pro-inflammatory cytokines and anti-inflammatory surface receptors, consistent with the ability to both cause and inhibit inflammatory disease.

Keywords: T cells; co-regulatory receptors; interferon; microbiota; polysaccharides.


Figures

Figure 1
Figure 1
Gene set enrichment analysis of inflammatory and interferon related genes. Gene ontology and gene set enrichment analysis were conducted on differentially expressed genes (FDR > 0.05 and log2CPM > 0). (A) Gene ontology analysis of differentially expressed genes increased (red) and decreased (blue) with PSA exposure in CD4+ T cells. GO terms with immunological relevance were extracted (44 terms). Gene ontology terms significantly associated (P ≤ 0.05) were plotted as −log10 version. (B) Hallmark gene set enrichment analysis of PSA stimulated cells. Gene sets significantly associated (P ≤ 0.05) were plotted as −log10 of q value. GSEA analysis showing enrichment in (C) IFN-γ, IFN-α and inflammatory response gene sets, (D) TNF superfamily members and receptors, (E) and gene sets associated with Treg functionality.
Figure 2
Figure 2
Gene expression IRG signature of PSA exposed cells. (A) Heat map of interferon responsive genes from PSA exposed (D7) or unexposed (D0) CD4+ T cells. Values are row z-score. (B) Multidimensional scatterplot of IRG data comparison of PSA exposed and non-exposed cells (D7 in orange, D0 in purple). (C) Breakdown of IRG list into Type I, Type II, or Type III IFN categories.
Figure 3
Figure 3
Transcription factor and signaling molecule profile of PSA exposed cells. Heat map of (A) T subtype associated transcription factors, (B) STAT transcription factors, (C) Chemokines, and (D) Cytokines of PSA exposed T cells compared to control.
Figure 4
Figure 4
Secreted molecule profile of PSA exposed cells. Luminex analysis (Mouse Cytokine/Chemokine Array 32-plex) was used to determine secreted molecule profile of PSA exposed APC and T cell co-cultures after 7 days. Data shown reflects secreted proteins (left, red) and matching RNA-seq data (right, blue). (A) T subtyped associated cytokines. (B) Molecules that significantly increased (P ≤ 0.05) with PSA exposure. (C) Molecules that significantly decreased (P ≤ 0.05) with PSA exposure.
Figure 5
Figure 5
Cell surface marker expression of PSA exposed CD4+ T cells identifies immunomodulatory markers. High throughput flow cytometry was used to obtain the cell surface marker expression of 255 markers using LegendScreen Mouse PE kit. APC and T cells were co-cultured with PSA and collected at D0, D1, and D7. Data shown is geometric MFI from CD4+ T cells. Data is row z-scores. (A) Summary heat map of all 255 markers on D0, D1 and D7. (B) Top 20 markers most increased and (C) decreased on D7 compared to D0. (D) Markers previously used to identify PSA responsive T cells in human and murine experiments. (E) Activation and immunomodulatory markers upregulated with PSA exposure.
Figure 6
Figure 6
IFN-γ influence on immunomodulatory marker expression. Bulk or FP3 CD4+ T cell were cultured in vitro for 3 days with α CD3 stimulation. Cells were supplemented with 10 ng/ml of recombinant mouse IFN-γ or with 10 µg/ml of α-IFN-γ blocking antibody. Marker expression assays with flow cytometry and culture supernatants were used for ELISA. Tim3, Lag3 and PD1 expression of (A) Bulk or (C) FP3 CD4+ T cells with or without IFN or antibody blockade. ELISA data of culture supernatants from (B) Bulk or (D) FP3 CD4+ T cell cultures. (significance of P ≤ 0.05 = *).
Figure 7
Figure 7
Gut associated lymphoid tissue enrichment of PSA induced markers. Mice were orally gavaged with 100 µg of PSA dissolved in PBS every 72 h, 5 gavages total. Peyer’s patches, mesenteric lymph nodes and spleens were collected on D17, D31 or D52 after initial gavage. Data is geometric MFI. (A) In vivo activation marker expression across organs and time points. (B) Expression profile of immunomodulatory markers across organs and time points. (n = 3 mice per group, significance of P ≤ 0.05 = *).

References

    1. Hevia A, Milani C, López P, Cuervo A, Arboleya S, Duranti S, et al. Intestinal Dysbiosis Associated with Systemic Lupus Erythematosus. mBio (2014) 5:e01548–01514. 10.1128/mBio.01548-14 - DOI - PMC - PubMed
    1. Shamriz O, Mizrahi H, Werbner M, Shoenfeld Y, Avni O, Koren O. Microbiota at the crossroads of autoimmunity. Autoimmun Rev (2016) 15:859–69. 10.1016/j.autrev.2016.07.012 - DOI - PubMed
    1. Bisgaard H, Li N, Bonnelykke K, Chawes BLK, Skov T, Paludan-Müller G, et al. Reduced diversity of the intestinal microbiota during infancy is associated with increased risk of allergic disease at school age. J Allergy Clin Immunol (2011) 128:646–52.e645. 10.1016/j.jaci.2011.04.060 - DOI - PubMed
    1. Roy S, Trinchieri G. Microbiota: a key orchestrator of cancer therapy. Nat Rev Cancer (2017) 17:271. 10.1038/nrc.2017.13 - DOI - PubMed
    1. Dzutsev A, Goldszmid RS, Viaud S, Zitvogel L, Trinchieri G. The role of the microbiota in inflammation, carcinogenesis, and cancer therapy. Eur J Immunol (2015) 45:17–31. 10.1002/eji.201444972 - DOI - PubMed

Publication types