Comparative Study
. 2020 Oct 19:11:575074.
doi: 10.3389/fimmu.2020.575074. eCollection 2020.

Measurement of Cellular Immune Response to Viral Infection and Vaccination

Affiliations
Comparative Study

Measurement of Cellular Immune Response to Viral Infection and Vaccination

Wilbert Bouwman et al. Front Immunol. .

Abstract

Combined cellular and humoral host immune response determine the clinical course of a viral infection and effectiveness of vaccination, but currently the cellular immune response cannot be measured on simple blood samples. As functional activity of immune cells is determined by coordinated activity of signaling pathways, we developed mRNA-based JAK-STAT signaling pathway activity assays to quantitatively measure the cellular immune response on Affymetrix expression microarray data of various types of blood samples from virally infected patients (influenza, RSV, dengue, yellow fever, rotavirus) or vaccinated individuals, and to determine vaccine immunogenicity. JAK-STAT1/2 pathway activity was increased in blood samples of patients with viral, but not bacterial, infection and was higher in influenza compared to RSV-infected patients, reflecting known differences in immunogenicity. High JAK-STAT3 pathway activity was associated with more severe RSV infection. In contrast to inactivated influenza virus vaccine, live yellow fever vaccine did induce JAK-STAT1/2 pathway activity in blood samples, indicating superior immunogenicity. Normal (healthy) JAK-STAT1/2 pathway activity was established, enabling assay interpretation without the need for a reference sample. The JAK-STAT pathway assays enable measurement of cellular immune response for prognosis, therapy stratification, vaccine development, and clinical testing.

Keywords: JAK-STAT pathway; cellular immune response; signal transduction pathways; vaccine immunogenicity; viral infection.


Figures

Figure 1
Figure 1
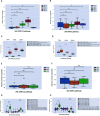
JAK-STAT1/2 (A) and STAT3 (B) pathway activity analysis of dataset GSE6269 (34) containing Peripheral Blood Mononuclear Cell (PBMC) samples of pediatric patients with acute infection with influenza virus (blue), S. Pneumoniae (orange), or S. Aureus (green). Pathway activity score on Y-axis in log2odds. Two sided independent t-tests were performed; p-values are indicated in the figures as *p < 0.05, **p < 0.01, or ns (not significant).
Figure 2
Figure 2
JAK-STAT1/2 (A) and JAK-STAT3 (B) pathway activity analysis of dataset GSE69606 (35) including patients with acute RSV infections, divided into mild, moderate and severe disease. From moderate and severe diseased patients, recovery samples (on average 4 weeks after discharge) were also available. Peripheral blood mononuclear cells (PBMCs) were used for analysis. Pathway activity score on Y-axis in log2odds. Two sided Mann–Whitney–Wilcoxon tests were performed; mild_acute vs servere_acute, moderate_acute vs moderate_revovery and severe_acute vs severe_recovery; p-values are indicated in the figures as *p < 0.05, **p < 0.01, or ns (not significant).
Figure 3
Figure 3
JAK-STAT1/2 and STAT3 pathway activity analysis of dataset GSE43777 (A for STAT1-2 and B for STAT3) and dataset GSE84331 (C for STAT1-2 and D for STAT3). (A, B). Dataset GSE43777 (36) including DF (dengue fever) and DHF (dengue hemorrhagic fever) patient samples during the course of dengue acute illness. Analysis was performed on PBMCs. Each stage represents a group of patients after x days from fever onset, Stages (days after onset fever): G1: 0 days, G2: 2 days, G3: 3 days, G4: 4 days, G5: 5 days, G6: 6-10 days, G7: >20 days. Two sided independent t-tests were performed on groups DF (dengue fever)_G1 vs all other groups (DF (dengue fever)_G2-G7), DHF (dengue hemorrhagic fever)_G2 with all other groups (DHF (dengue hemorrhagic fever)_G3-G7). (C, D). Dataset GSE84331 (37) includes CD8+ T cells (HLA-DR+CD38+) from Dengue/DHF patients which were compared to naive (CCR7+CD45RA+) CD8+ T cells from healthy donors (Control). Pathway activity score on Y-axis in log2odds. Two sided independent t-tests were performed; p-values are indicated in the figuresas *p < 0.05, **p < 0.01, ***p < 0.001, ****p < 0.0001 or ns (not significant).
Figure 4
Figure 4
JAK-STAT1/2 (A) and STAT3 (B) pathway activity analysis of dataset GSE34205 (38), including children (M=male; F=female) of median age of 2.4 months (range 1.5-8.6) hospitalized with acute RSV and influenza virus infection. Blood samples were collected within 42–72 h of hospitalization and PBMCs were isolated for analysis and compared with healthy controls. Pathway activity score on Y-axis in log2odds. Two sided Mann–Whitney–Wilcoxon statistical tests were performed; p-values are indicated in the figures as *p < 0.05, **p < 0.01, or ns (not significant).
Figure 5
Figure 5
JAK-STAT1/2 (A) and STAT3 (B) pathway activity analysis of dataset GSE119322 (39) including HBV patients with normal liver function, untreated chronic hepatitis patients and healthy controls. Mononuclear cells were isolated and the plasmacytoid DCs (pDCs) were used for analysis. Pathway activity score on Y-axis in log2odds.
Figure 6
Figure 6
JAK-STAT pathway activity induced by vaccination in healthy individuals with Yellow Fever vaccine (YFV-17, live attenuated yellow fever virus strain without adjuvant; A–D) or influenza vaccine (TIV, Trivalent Influenza Vaccine without adjuvant; E, F). (A, B): JAK-STAT1/2 (A) and JAK-STAT3 (B) pathway activity analysis of dataset GSE13486 (40): Yellow Fever vaccinated (YF-17D) healthy individuals at days 0, 1, 3, 7 and 21 after vaccination. PBMCs were isolated from blood and were used for analysis. Pathway activity score on Y-axis in log2odds. Two sided independent t-tests were performed; p-values are indicated in the figures as ***p < 0.001, ****p < 0.0001 or ns (not significant). (C, D): JAK-STAT1/2 (C) and JAK-STAT3 (D) pathway activity analysis of dataset GSE51997 (21): Yellow fever vaccinated female volunteers. Peripheral blood was taken before and 7 days after immunization, and CD4 positive T-cells, CD16 negative and positive monocytes were isolated and used for analysis. Pathway activity score on Y-axis in log2odds. Two sided independent t-tests were performed; p-values are indicated in the figures as ***p < 0.001, or ns (not significant). (E, F): JAK-STAT1/2 (E) and JAK-STAT3 (F) pathway activity analysis of dataset GSE29614 (41): Young adults vaccinated with Influenza TIV vaccine (Trivalent Inactivated Influenza Vaccine, GSK) during 2007/08 flu season. PBMC samples were isolated at days 0, 3, 7 post-vaccination. Two sided Mann–Whitney–Wilcoxon tests were performed; p-values are indicated in the figures as ns (not significant). (G, H): JAK-STAT1/2 (G) and JAK-STAT3 (H) pathway activity analysis of dataset GSE102459 (42): Human subjects were injected with M72/AS01E tuberculosis vaccine candidate at D0 and D30, whole blood samples are collected at D0, D30, D31, D37, D40, D44, and D47 and PBMC samples are collected at D0, D31, D44. Pathway activity score on Y-axis in log2odds. Two sided Mann-Whitney-Wilcoxon tests were performed; p-values are indicated in the figures. P-values indicate: ***p < 0.001, ****p < 0.0001 or ns (not significant).
Figure 7
Figure 7
JAK-STAT1/2 (A) and NFκB (B) pathway activity analysis of dataset GSE22589 (46) (n=2): Monocyte-derived dendritic cells (MDDCs) infected with an envelope-defective GFP-encoding VSV-G-pseudotyped HIV-1 vector (HIVGFP(G)) and with VSV-G pseudotyped virus-like particles derived from SIVmac to deliver Vpx (SIVVLP(G)), alone or in combination. Cells were infected with none, one or both vectors at day 4 of differentiation and were harvested 48 h later. Pathway activity score on Y-axis in log2odds.
Figure 8
Figure 8
JAK-STAT1/2 (A) and JAK-STAT3 (B) pathway activity analysis of dataset GSE50628 (48): Influenza A(H1N1)pdm09 or rotavirus (gastroenteritis) infected patients. Whole blood samples were collected from patients on the day of admission in the acute phase (influenza, 1–3 days from disease onset; rotavirus, 2–4 days from disease onset and recovery phase (influenza, 4–9 days from disease onset; rotavirus, 7–11 days from disease onset), and were used for analysis. Pathway activity score on Y-axis in log2odds. Two sided independent t-tests were performed; p-values are indicated in the figuresas *p < 0.05; ****p < 0.0001 or ns (not significant).

References

    1. Davis DM. The Beautiful Cure. Australia: Penguin Books; Available at: https://www.penguin.com.au/books/the-beautiful-cure-9781784702212 (Accessed 24-Aug-2020).
    1. coronavirus – Institute for the Future Available at: https://rega.kuleuven.be/if/corona_covid-19 (Accessed 24-Aug-2020).
    1. Zhou F, Yu T, Du R, Fan G, Liu Y, Liu Z, et al. Clinical course and risk factors for mortality of adult inpatients with COVID-19 in Wuhan, China: a retrospective cohort study. Lancet (2020) 395(10229):1054–62. 10.1016/S0140-6736(20)30566-3 - DOI - PMC - PubMed
    1. Wu C, Chen X, Cai Y, Xia J, Zhou X, Xu S, et al. Risk Factors Associated With Acute Respiratory Distress Syndrome and Death in Patients With Coronavirus Disease 2019 Pneumonia in Wuhan, China. JAMA Intern Med (2020) 180(7):934. 10.1001/jamainternmed.2020.0994 - DOI - PMC - PubMed
    1. Tay MZ, Poh CM, Rénia L, MacAry PA, Ng LFP. The trinity of COVID-19: immunity, inflammation and intervention. Nat Rev Immunol (2020) 20(6):363–74. 10.1038/s41577-020-0311-8 - DOI - PMC - PubMed

Publication types

MeSH terms