. 2020 Oct 28:11:591563.
doi: 10.3389/fimmu.2020.591563. eCollection 2020.

The Crotoxin:SBA-15 Complex Down-Regulates the Incidence and Intensity of Experimental Autoimmune Encephalomyelitis Through Peripheral and Central Actions

Affiliations

The Crotoxin:SBA-15 Complex Down-Regulates the Incidence and Intensity of Experimental Autoimmune Encephalomyelitis Through Peripheral and Central Actions

Morena Brazil Sant'Anna et al. Front Immunol. .

Abstract

Crotoxin (CTX), the main neurotoxin from Crotalus durissus terrificus snake venom, has anti-inflammatory, immunomodulatory and antinociceptive activities. However, the CTX-induced toxicity may compromise its use. Under this scenario, the use of nanoparticle such as nanostructured mesoporous silica (SBA-15) as a carrier might become a feasible approach to improve CTX safety. Here, we determined the benefits of SBA-15 on CTX-related neuroinflammatory and immunomodulatory properties during experimental autoimmune encephalomyelitis (EAE), an animal model of multiple sclerosis that replicates several histopathological and immunological features observed in humans. We showed that a single administration of CTX:SBA-15 (54 μg/kg) was more effective in reducing pain and ameliorated the clinical score (motor impairment) in EAE animals compared to the CTX-treated EAE group; therefore, improving the disease outcome. Of interest, CTX:SBA-15, but not unconjugated CTX, prevented EAE-induced atrophy and loss of muscle function. Further supporting an immune mechanism, CTX:SBA-15 treatment reduced both recruitment and proliferation of peripheral Th17 cells as well as diminished IL-17 expression and glial cells activation in the spinal cord in EAE animals when compared with CTX-treated EAE group. Finally, CTX:SBA-15, but not unconjugated CTX, prevented the EAE-induced cell infiltration in the CNS. These results provide evidence that SBA-15 maximizes the immunomodulatory and anti-inflammatory effects of CTX in an EAE model; therefore, suggesting that SBA-15 has the potential to improve CTX effectiveness in the treatment of MS.

Keywords: IL-17; SBA-15; crotoxin; experimental autoimmune encephalomyelitis (EAE); mesoporous silica; motor impairment; neuroinflammation.


Figures

Figure 1
Figure 1
Effect of CTX:SBA-15 treatment on EAE in rodents. Nociceptive threshold was daily assessed throughout the experimental protocol (day 0) (A, F). Animals were daily evaluated for the onset of clinical signs according to the scale parameters graded from 0 to 5 (B, G). Statistical analysis of clinical signs was made by area under the curve analysis (C, H), the incidence of the disease was shown in percentage (%) of animals showing clinical score equal to or greater than 1 in the group (D, I) and the maximum score reached for each animal on the evaluated period was shown in percentage (%) (E, J). Results are expressed as mean (± SEM) n = 8 animal per group. Data are representative of two independent experiments. ***p < 0.001 indicates significant difference when compared to the EAE group. #p < 0.05, ##p < 0.01 and ###p < 0.01 indicates a statistically significant difference when compared to CFA group. ∞p < 0.01 indicates a statistically significant difference when compared with EAE + CTX group. Two-way ANOVA test was used for behavior analysis, and a One-way ANOVA test was used for AUC, both followed by Tukey’s test.
Figure 2
Figure 2
Effect of CTX: SBA-15 treatment on EAE-induced changes in muscle morphology and function. On the peak of the disease, the tibialis anterior muscle was collected for morphological analysis of the cross-sectional area (A, B) and the long digital extensor muscle (LDE) for muscle function (C). Results are expressed as mean (± SEM) n = 4–5 animal per group. *p < 0.05 and **p < 0.01 indicates a statistically significant difference when compared to the naive and CFA groups. # p < 0.05 indicates a statistically significant difference when compared to EAE group. ∞p < 0.05 and ∞∞p < 0.01 indicate statistically significant differences when compared to EAE + CTX group. One-way ANOVA test was used, followed by Tukey’s test.
Figure 3
Figure 3
The treatment with CTX:SBA-15 decreases the expression of Th17 cells and IL-17 cytokine induced by EAE. The lymph node (A) and spinal cord (C) samples were collected at indicated times for mRNA for IL-17. At 7th day after immunization, the cells from lymph nodes were extracted and stained for extracellular marker, for CD4+, and intracellular cytokine IL-17 (B). The results were evaluated by flow cytometry and analyzed in FlowJo software. At the peak of disease the samples from the spinal cord were processed to the protein assay for IL-17 (D) assessed by MULTIPLEX. All data are expressed as mean (± SEM) n = 5–6 animal per group. *p < 0.05 indicates a statistically significant difference when compared to the Naive and CFA group. #p < 0.05 indicates a statistically significant difference when compared to the EAE. One-way ANOVA test was used, followed by Tukey’s test.
Figure 4
Figure 4
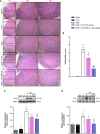
Effect of the treatment with CTX:SBA-15 on neuroinflammation. Animals were treated with CTX (40 µg/kg, s.c.) or CTX:SBA-15 (54 µg/kg, s.c.) in a single administration on the 5th day after immunization with MOG35-55 in CFA. The spinal cord of the animals was collected at the peak (A–C) or at 26° after immunization (D). The cell infiltration analysis was performed by hematoxylin and eosin (HE) staining. Representative sections of cell infiltration are shown (A) as well histological scores (B) of whole spinal cord. Upper (U) and down (D) indicate the magnified corresponding figures. Scale bar 100 μm (n = 4-5) animals per group). The expression of microglia, CD11b (C), or astrocytes, GFAP (D), markers, were analyzed by Western Blotting assay (n = 6 animals per group). All data are expressed as the mean (± SEM). ***p<0.001, **p<0.01 and *p<0.05 indicates a statistically significant difference when compared to the Naive and CFA group. #p<0.05, ##p<0.01 and ### p<0.001 indicates a statistically significant difference when compared to the EAE. ∞∞p<0.01 indicates a statistically significant difference when compared to EAE + CTX group. One-way ANOVA test was used, followed by Tukey’s test.

References

    1. MS Symptoms | Multiple Sclerosis Internation Federation Available at: https://www.msif.org/about-ms/symptoms-of-ms/ (Accessed March 25, 2020).
    1. Filippi M, Bar-Or A, Piehl F, Preziosa P, Solari A, Vukusic S, et al. Multiple sclerosis. Nat Rev Dis Prim (2018) 4:43. 10.1038/s41572-018-0041-4 - DOI - PubMed
    1. Dendrou CA, Fugger L, Friese MA. Immunopathology of multiple sclerosis. Nat Rev Immunol (2015) 15:545–58. 10.1038/nri3871 - DOI - PubMed
    1. Petzold A, Eikelenboom MJ, Gveric D, Keir G, Chapman M, Lazeron RHC, et al. Markers for different glial cell responses in multiple sclerosis: clinical and pathological correlations. Brain (2002) 125:1462–73. 10.1093/brain/awf165 - DOI - PubMed
    1. Friese MA, Fugger L. T cells and microglia as drivers of multiple sclerosis pathology. Brain (2007) 130:2755–7. 10.1093/brain/awm246 - DOI - PubMed

Publication types

MeSH terms

LinkOut - more resources