. 2020 Oct 9:11:511286.
doi: 10.3389/fgene.2020.511286. eCollection 2020.

Patterns, Profiles, and Parsimony: Dissecting Transcriptional Signatures From Minimal Single-Cell RNA-Seq Output With SALSA

Affiliations

Patterns, Profiles, and Parsimony: Dissecting Transcriptional Signatures From Minimal Single-Cell RNA-Seq Output With SALSA

Oswaldo A Lozoya et al. Front Genet. .

Abstract

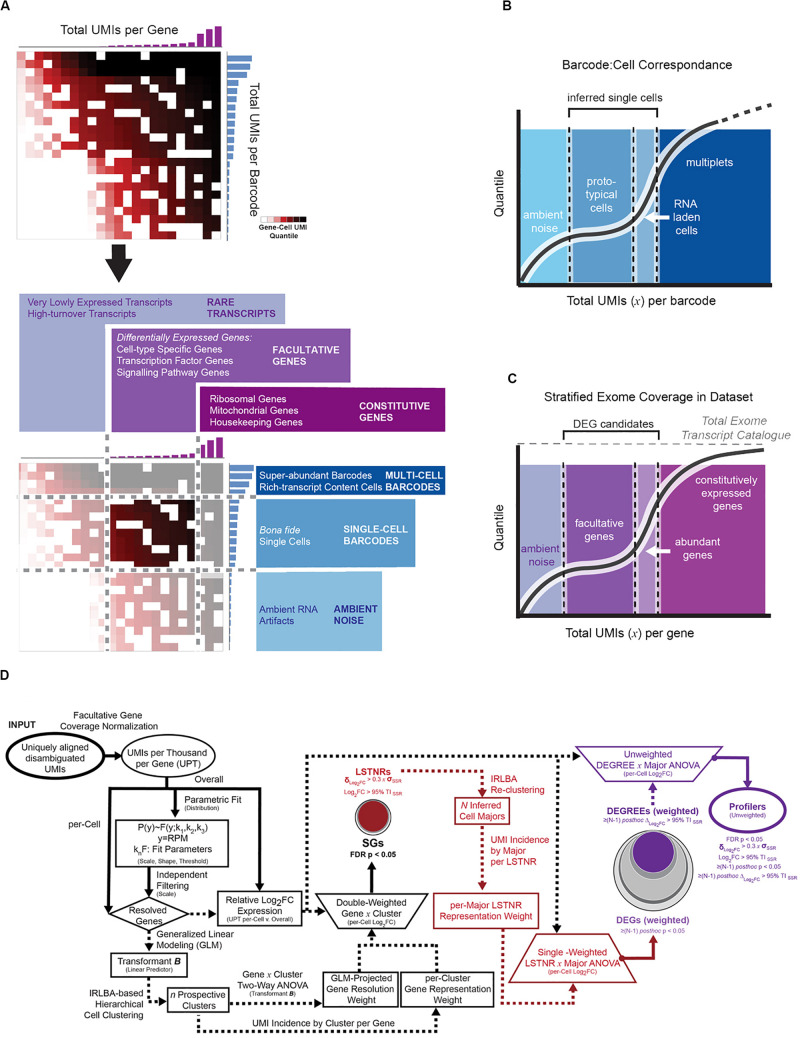
Single-cell RNA sequencing (scRNA-seq) technologies have precipitated the development of bioinformatic tools to reconstruct cell lineage specification and differentiation processes with single-cell precision. However, current start-up costs and recommended data volumes for statistical analysis remain prohibitively expensive, preventing scRNA-seq technologies from becoming mainstream. Here, we introduce single-cell amalgamation by latent semantic analysis (SALSA), a versatile workflow that combines measurement reliability metrics with latent variable extraction to infer robust expression profiles from ultra-sparse sc-RNAseq data. SALSA uses a matrix focusing approach that starts by identifying facultative genes with expression levels greater than experimental measurement precision and ends with cell clustering based on a minimal set of Profiler genes, each one a putative biomarker of cluster-specific expression profiles. To benchmark how SALSA performs in experimental settings, we used the publicly available 10X Genomics PBMC 3K dataset, a pre-curated silver standard from human frozen peripheral blood comprising 2,700 single-cell barcodes, and identified 7 major cell groups matching transcriptional profiles of peripheral blood cell types and driven agnostically by < 500 Profiler genes. Finally, we demonstrate successful implementation of SALSA in a replicative scRNA-seq scenario by using previously published DropSeq data from a multi-batch mouse retina experimental design, thereby identifying 10 transcriptionally distinct cell types from > 64,000 single cells across 7 independent biological replicates based on < 630 Profiler genes. With these results, SALSA demonstrates that robust pattern detection from scRNA-seq expression matrices only requires a fraction of the accrued data, suggesting that single-cell sequencing technologies can become affordable and widespread if meant as hypothesis-generation tools to extract large-scale differential expression effects.

Keywords: NGS; RNA; biomarker discovery and validation; heterogeneity; hypothesis generation; reproducibility; scRNA-seq; single cells; sparsity; transcriptomics analysis.


Figures

FIGURE 1
FIGURE 1
Basic steps of tissue-to-data process for massively paralleled single-cell RNA-seq technologies. To assemble an expression matrix for thousands of cells in a single run, biological specimens are dissociated into single cell suspensions, partitioned for barcoding and adapterization by droplet encapsulation (e.g., DropSeq) or split-pooling approaches (e.g., sci-RNA-seq), and sequenced with short-read high-throughput SBS instrumentation.
FIGURE 2
FIGURE 2
Depiction of expression matrix focusing by total per-gene and per-barcode coverage with the parametric PC-PD mixture model. (A) Sorted count data from scRNA-seq experiments exhibits transitions in total UMI counts per barcode, reminiscent of distinct regimes of UMI density between background (ambient noise), single-cell, and multi-cell barcodes; total UMI counts per gene exhibit an analogous profile, with distinct regimes between rare, facultative, and constitutively expressed genes. Latent patterns of expression within gene-cell matrices are most discriminative at the intersection of facultative genes and single-cell barcodes regimes, referred to as the focused expression matrix. To infer coverage regimes per barcode (B) and per gene aligned (C) from the raw gene-cell expression matrix, total UMI count data are fit to a 2-component mixture probabilistic parametric model; regime thresholds are defined systematically from estimated scale and shape parameters. (D) Stratified differential expression analysis starting from a focused expression matrix in SALSA. The flow chart depicts transformations used in SALSA toward generalized linear modeling (GLM) of expression data, and statistical criteria to extract significant gene subsets with rising statistical stringency.
FIGURE 3
FIGURE 3
Facultative gene stratification with the SALSA workflow. (A) Progressive facultative gene strata with increasing levels of prospective experimental reproducibility. (B) Frosty plot of gene stratification across rising levels of statistical significance. Head (black circle, top), body (largest encasing circle, middle), and base (dim gray rectangle, bottom) depict the make-up of detected genes from a single-cell library based on their constitutive, facultative, or rarely expressed status; number of facultative genes admitted past significance criteria in each stratum are also shown as encasing circles with varying sizes and grayscale intensities. Stick arms flag the gene stratum chosen as the agnostic expression marker gene set for final inferential clustering of single-cell barcodes into cell majors. Retention rates of input and output single-cell barcodes following gene stratification are represented by the relative heights of stick arms going from 100% of inferred cells with facultative gene data (left arm) to a subset of inferred cells expressing agnostic markers.
FIGURE 4
FIGURE 4
Graphical representation of data sparsity in the PBMC 3K expression matrix. Dots in the large rectangular frame (top) represent individual count values throughout the gene-cell expression matrix based on accrued sequencing data; missing data fields are blank. Vertical dotted gray lines demarcate the estimated boundaries between rare, facultative, and constitutively expressed genes. Make-up of count data values among data-positive fields (top left), with blow-up windows of ∼300 genes × 230 cells each (bottom) in the PBMC 3K expression matrix for rare, facultative, and constitutive gene regimes at high, middle, and low per-cell total UMI coverages, respectively.
FIGURE 5
FIGURE 5
Parametric sweeping implementation for facultative gene extraction from the PBMC 3K silver standard dataset. (A) Example quantile plots for PC-PD mixture model fitting at varying minimum coverage admission thresholds over all 16,634 aligned genes: no threshold (left, black label lettering), 5,749 aligned genes with > 81 total UMI counts (middle, green label lettering), and 2,494 with > 256 total UMI counts (right, red label lettering). (B) Parametric sweep with rising minimum coverage admission thresholds per gene of PC-PD and heavy-tailed projection models. Green and red vertical dotted lines demarcate the span of best-fit parameters for the inferred facultative gene regime, flanked by numerical solver instabilities, that correspond to quantile plots in (B) with matching label colors. (C) Traditional gene knee plot displays of the PBMC 3K data set with an additional z-axis showing numbers of genes sharing ranking positions (log-scale), showing all detected genes (bottom left) and highlighting inferred facultative genes (bottom right) through matrix focusing. Inferred facultative genes are shown in a low-to-high total UMI coverage color gradient (green-to-black-to-red; bottom right).
FIGURE 6
FIGURE 6
Differential expression analysis and cell type inferences in the PBMC 3K dataset using SALSA. (A) Frosty plot of gene stratification across rising levels of statistical significance in PBMC 3K. (B) Putative cell types matched to cell majors and their inferred transcriptional proximities displayed in latent 2D space by unsupervised clustering of mean linear predictor estimates «B(θ)» for expression rates of agnostic markers. (C) Heatmap overlay onto two-way clustering dendrograms from (B) showing increasing quantile scores of Log2FC values relative to library-wise UPT grand mean (tan-to-cyan-to-blue); missing data fields are shown in black. (D) Violin plots for total UMI coverage per barcode (x-axis) within cell majors; inset legends report total number of barcodes per cell major. (E) Violin plots of Log2FC values relative to library-wise UPT grand means (x-axis) for 15 landmark expression genes of blood cell types across cell majors in PBMC 3K; inset legends report total number of barcodes with UMIs for each landmark gene. Relative “yes/no” representation rates of landmark genes, i.e., the ratio of expressing vs. total cells within cell majors, are illustrated by coloring of violin plot backgrounds: in light gray, majors with high expression levels for a given landmark gene; in dark gray, majors with high expression levels and representation rates combined. (F) Topographs showing the patterns of expressed landmark gene enrichment across the latent 2D space map from (B), overlayed with a non-parametric quantile heatmap highlighting “weighed gene expression” scores, i.e., the composite score of single-cell Log2FC values and within-major representation rates per gene; individual expressing cells are shown as black dots in 2D clustering maps.
FIGURE 7
FIGURE 7
Differential expression analysis and cell type inferences in Macosko’s mouse retina DropSeq dataset using SALSA. Knee plots for (A) detected barcodes and (B) aligned genes from Macosko et al. (2015) dataset, highlighting inferred singlets and facultative genes by separate parametric sweepings within each specimen using the PC-PD mixture model. Rankings corresponding to the highest- and lowest-count inferred singlets in barcode knee plots, as well as positions of Gnat1, Gnat2, and Gnat3 in gene knee plots, are shown for each specimen separately. Plot colors depict specimens collected and processed in each of 4 separate experimental rounds; total barcodes and genes detected per specimen are shown within each knee plot (top right). (C) Stepwise selection of consensus facultative gene set used to implement cross-specimen integrative analysis of Macosko’s retina dataset by SALSA. (D) Frosty plot of gene stratification across rising levels of statistical significance of the integrated Macosko’s retina dataset. (E) Distribution of total UMI per cell rates in dropped vs. retained single cell barcodes per specimen after integrative gene stratification analysis using SALSA. (F) A set of 10 inferred retinal cell phenotypes across 64,891 retained single cell barcodes in latent 2D space (main plot; Rod, rod photoreceptors; Cone, cone photoreceptors; R-BP, rod bipolar cells; C-BP, cone bipolar cells; Hz, horizontal cells; Am, amacrine cells; RG, retinal ganglion cells; Mic/Ast, microglia and astrocytes; Fib/MG, fibroblasts and Müller glia; End, endothelial cells) in relation to 18 agnostically determined cell majors (inset, grayscale). (G) Violin plots for 64,618 single cell barcodes expressing retinal cell markers. Left-most column: total UMI coverage per barcode; inset legends report total number of barcodes per phenotype. Rest: weighed expression levels across 13 landmark genes relative to library-wise grand means (x-axis, dashed line); inset legends report total number of barcodes with UMIs per phenotype for each landmark gene. (H) Contingency plots for contribution per specimen to each inferred cell phenotype; far right: overall fractions among 64,618 landmark-expressing cells of rod, cone, and all other retinal cells combined.

References

    1. Ahlers J. D., Belyakov I. M. (2010). Memories that last forever: strategies for optimizing vaccine T-cell memory. Blood 115 1678–1689. 10.1182/blood-2009-06-227546 - DOI - PMC - PubMed
    1. Aitkin M., Clayton D. (1980). The fitting of exponential, weibull and extreme value distributions to complex censored survival data using GLIM. J. R. Statist. Soc. Ser. C 29 156–163. 10.2307/2986301 - DOI
    1. Andrews T. S., Hemberg M. (2018). False signals induced by single-cell imputation. F1000Research 7:1740. 10.12688/f1000research.16613.2 - DOI - PMC - PubMed
    1. Arisdakessian C., Poirion O., Yunits B., Zhu X., Garmire L. X. (2019). DeepImpute: an accurate, fast, and scalable deep neural network method to impute single-cell RNA-seq data. Genome Biol. 20:211. - PMC - PubMed
    1. Baglama J., Reichel L. (2005). Augmented implicitly restarted Lanczos bidiagonalization methods. SIAM J. Sci. Comput. 27 19–42. 10.1137/04060593x - DOI

LinkOut - more resources