. 2020 Oct 15;12(10):6043-6059.
eCollection 2020.

Neuroglial activation in the auditory cortex and medial geniculate body of salicylate-induced tinnitus rats

Affiliations

Neuroglial activation in the auditory cortex and medial geniculate body of salicylate-induced tinnitus rats

Chenchen Xia et al. Am J Transl Res. .

Abstract

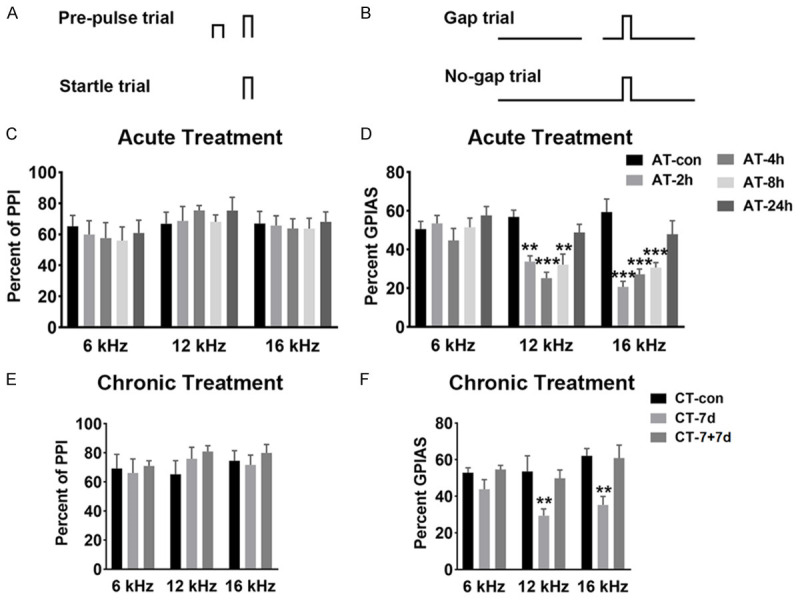
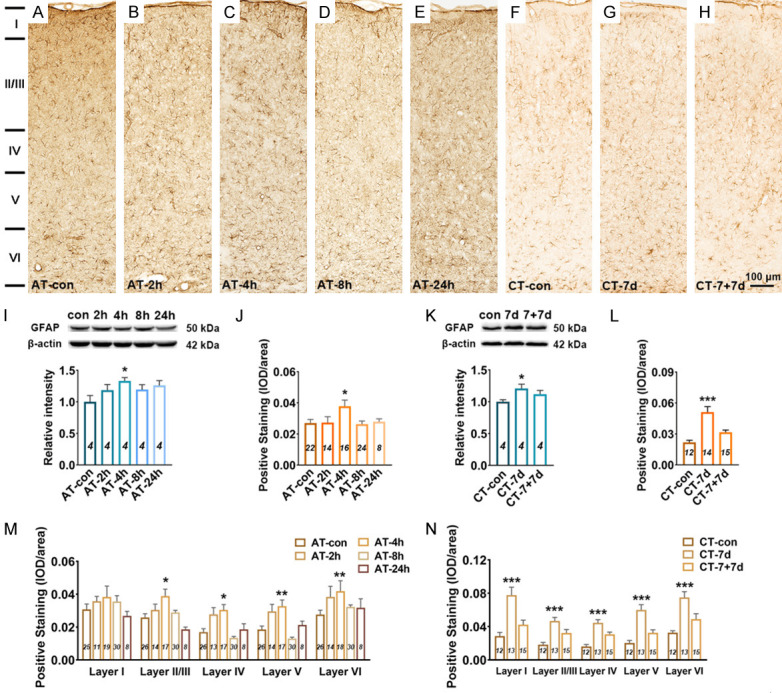
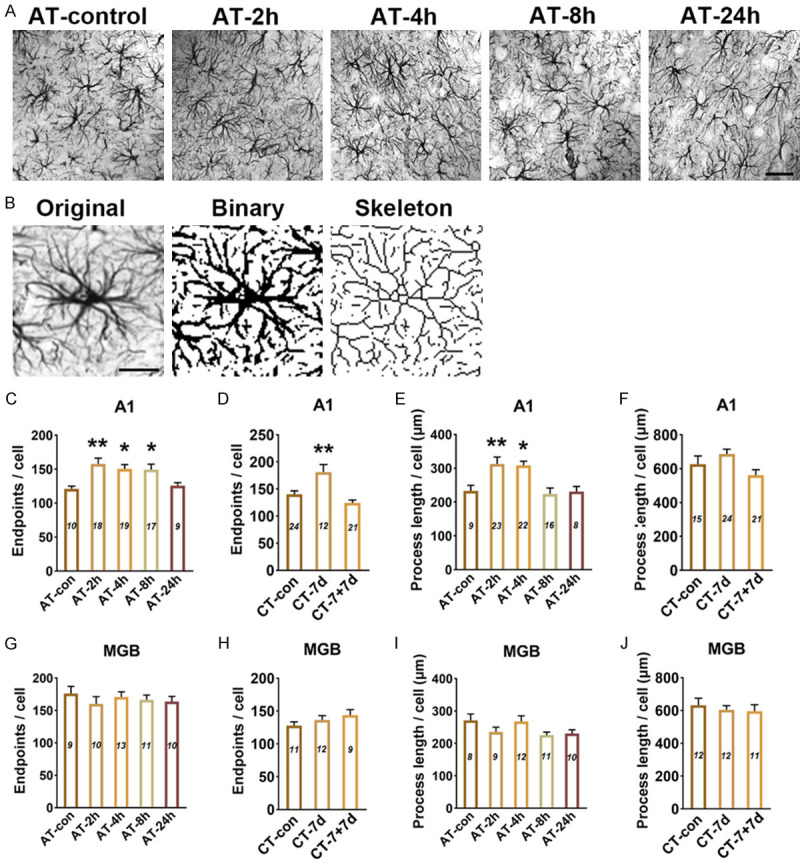
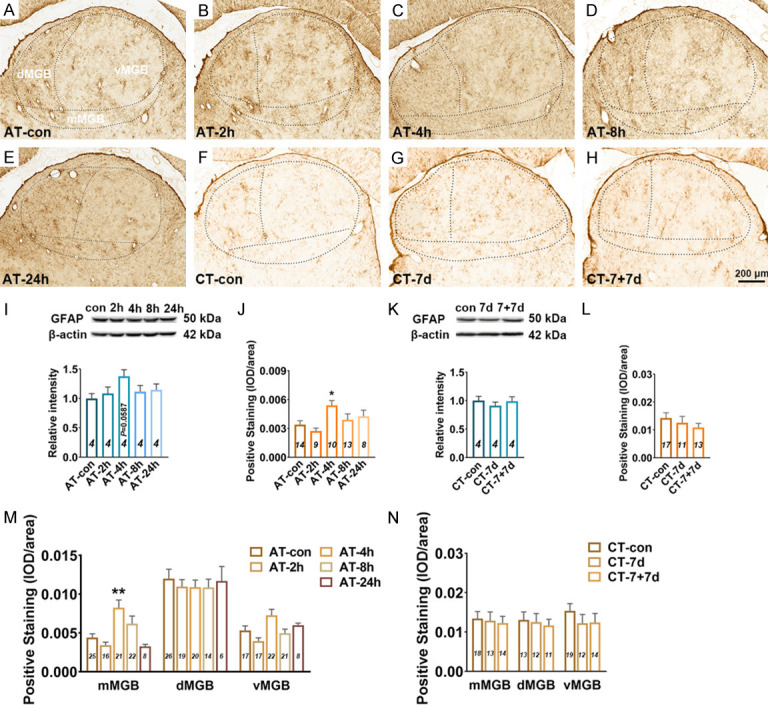
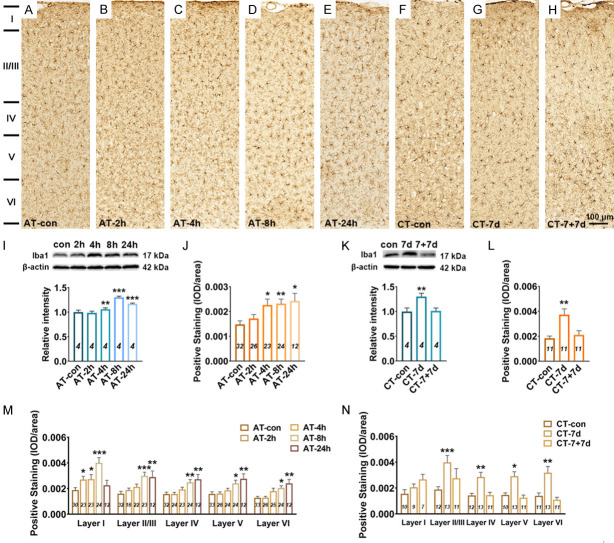
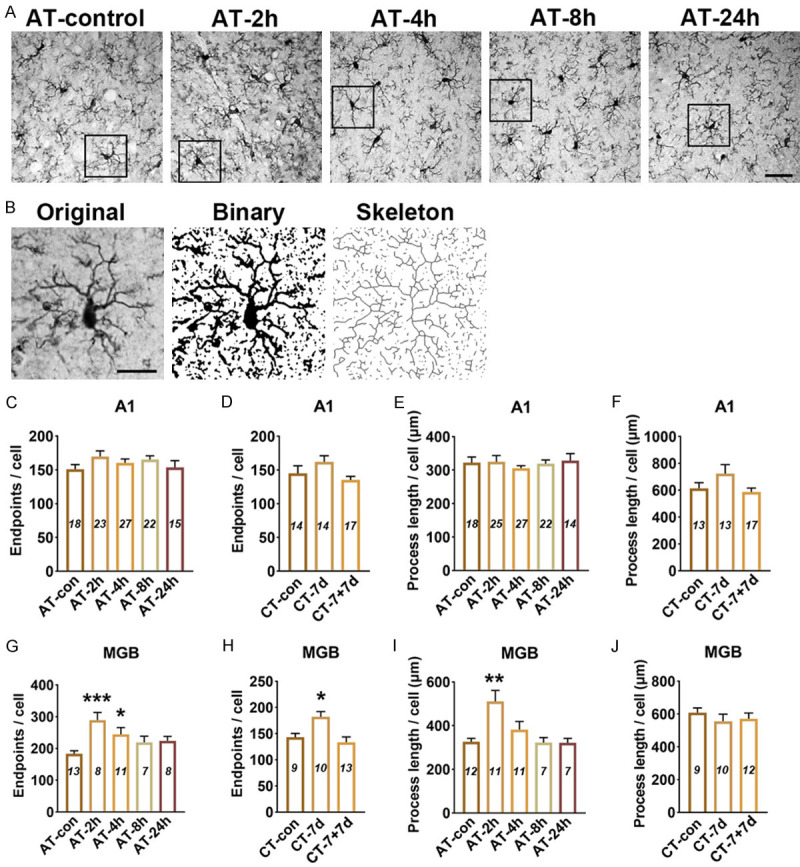
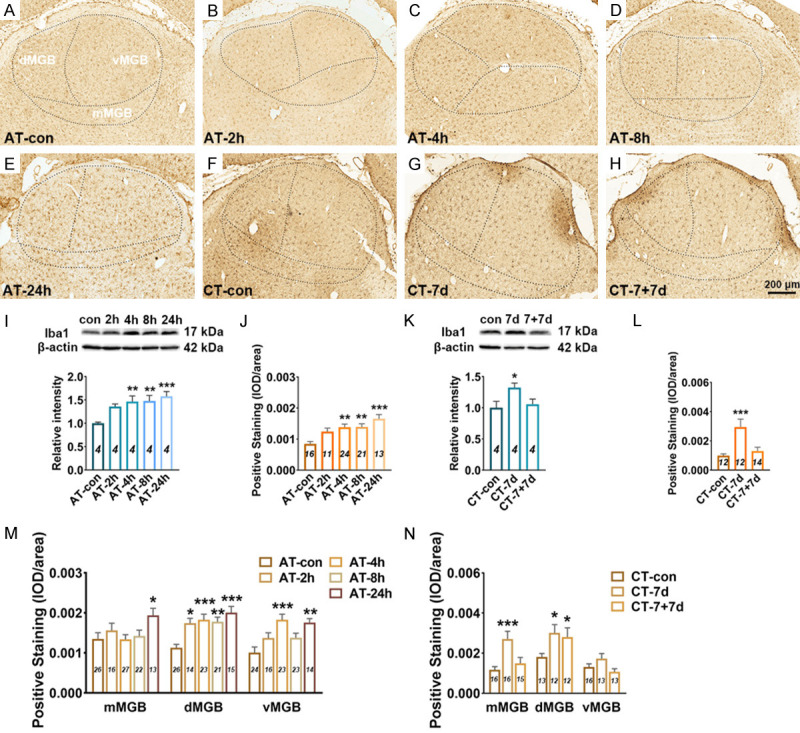
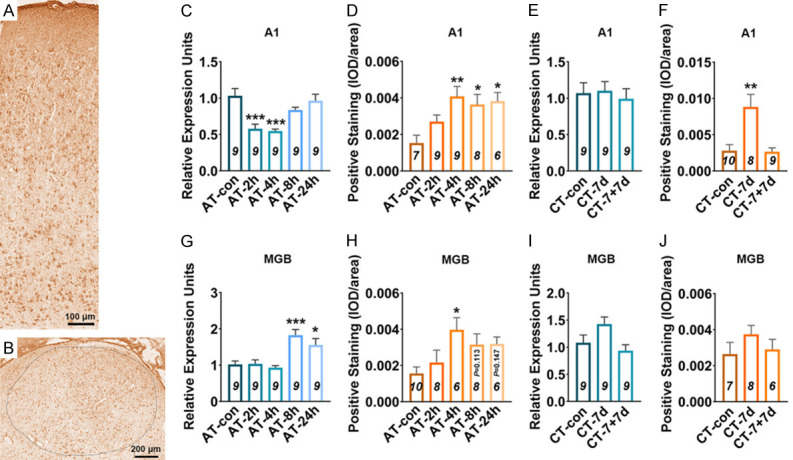
Neuroglial activation has been recognized as a pathological hallmark of a variety of neurological diseases, yet the role of neuroglia in tinnitus hasn't been well established so far. To explore the potential roles of two types of glia cells (astrocyte and microglia) in the development of tinnitus, we examined markers associated with them in the primary auditory (A1) cortex and medial geniculate body (MGB) of rats with salicylate-induced tinnitus. The results demonstrated that acute and chronic administrations of salicylate could cause reversible tinnitus-like behavior in rats. The expression level of GFAP markedly increased in the A1 cortex of rats following acute and chronic treatments of salicylate, accompanied by increased endpoint and process length of astrocyte. The expression level of GFAP and the morphology of astrocyte in the rat MGB remained almost constant following salicylate treatment. On the other hand, the expression level of Iba1 markedly increased in the rat A1 cortex and MGB following acute and chronic treatments of salicylate, together with increased endpoint and process length of microglia in the MGB. Additionally, interleukin 1β (IL-1β), a pro-inflammatory cytokine released by activated glia was significantly up-regulated in the A1 cortex and MGB of rats after salicylate treatments. These findings highlight astrocyte activation and microglia proliferation in the central auditory system of rats experiencing tinnitus, which potently implicate an indispensable glial regulation in tinnitus development.

Keywords: Tinnitus; astrocyte; microglia; neuroglial activation; neuroinflammation; salicylate.


Conflict of interest statement

None.

Figures

Figure 1
Figure 1
Pre-pulse inhibition (PPI) and gap pre-pulse inhibition of acoustic startle (GPIAS) paradigm. A. Diagram illustrate for PPI assay. B. Diagram illustrate for GPIAS assay. C. Percent of PPI at 6, 12 and 16 kHz after acute treatment of salicylate. No significant differences were detected among these five groups. D. Percent of GPIAS at 6, 12 and 16 kHz after acute treatment of salicylate. Three groups (AT-2 h, AT-4 h and AT-8 h) showed a significant decrease in percent of GPIAS compared with the AT-control group at 12 kHz (P < 0.01, P < 0.001, P < 0.01) and 16 kHz (P < 0.001, P < 0.001, P < 0.001) (n=4 rats in each group). E. Percent of PPI at 6, 12 and 16 kHz for rats after chronic treatment of salicylate. No significant differences were demonstrated among the three groups. F. Percent of GPIAS at 6, 12 and 16 kHz after chronic treatment of salicylate. The CT-7 d group showed a significant decrease in percent of GPIAS compared with the CT-control group at 12 kHz (P < 0.01) and 16 kHz (P < 0.01), but not at 6 kHz (n=6 rats in each group). Two-way analysis of variance (ANOVA) followed by post hoc Scheffé test was used for multiple comparisons of the five or three groups, *P < 0.05, **P < 0.01, ***P < 0.001, compared with control group. Data are presented as the mean ± SEM.
Figure 2
Figure 2
Changes in GFAP expression in the A1 cortex following salicylate treatment. A-H. Example coronal sections of A1 cortex stained with GFAP. I. Quantitative analysis of GFAP in the A1 cortex from AT group using western blot. Bar graph shows the protein level of GFAP against β-actin in the A1 cortex, data are normalized to control. J. Quantitative analysis of GFAP in the A1 cortex from AT group using immunohistochemical staining. Bar graph shows the total IOD/area quantification of GFAP in the A1 cortex. M. The expression levels of GFAP in five layers (I, II/III, IV, V, and VI) of the A1 cortex. K. Quantitative analysis of GFAP in the A1 cortex from CT group using western blot. Bar graph shows the protein level of GFAP in the A1 cortex by normalizing against the mean of β-actin, data are normalized to control. L. Quantitative analysis of GFAP in the A1 cortex from CT group using immunohistochemical staining. Bar graph shows the total IOD/area quantification of GFAP in the A1 cortex. N. The expression levels of GFAP in five layers (I, II/III, IV, V, and VI) of the A1 cortex. One-way analysis of variance (ANOVA) followed by post hoc Scheffé test was used for multiple comparisons of total expression level in the five or three groups. Two-way analysis of variance (ANOVA) followed by post hoc Scheffé test was used for multiple comparisons of different A1 cortical layers across the five or three groups. Data are presented as mean ± SEM, n value are shown in each bar. *P < 0.05, **P < 0.01, ***P < 0.001, compared with control group.
Figure 4
Figure 4
Skeleton analysis of astrocyte morphology in the A1 cortex and MGB following salicylate treatment. A. Example images of GFAP stained in A1 cortex from AT group. Scale bars: 30 μm. B. GFAP stained images were converted to binary images and skeletonized by image J for analysis. Scale bars: 15 μm. C-F. Quantitative analysis of endpoints and length of processes of astrocyte in the A1 cortex after salicylate treatment. G-J. Quantitative analysis of endpoints and length of processes of astrocyte in the MGB after salicylate treatment. The number of astrocyte in each field was quantified in order to normalize skeleton data, the number of (EP/C) and the process length/cell (LE/C) were analyzed. One-way analysis of variance (ANOVA) followed by post hoc Scheffé test was used for multiple comparisons of total expression level in the five or three groups. Data were presented as mean ± SEM, n value are shown in each bar. *P < 0.05, **P < 0.01, compared with control group.
Figure 3
Figure 3
Changes in GFAP expression in the MGB following salicylate treatment. A-H. Example coronal sections including MGB stained with GFAP. I. Quantitative analysis of GFAP in the MGB from AT group using western blot. Bar graph shows the protein level of GFAP against β-actin in the MGB, data are normalized to control. J. Quantitative analysis of GFAP in the MGB from AT group using immunohistochemical staining. Bar graph shows the total IOD/area quantification of GFAP in the MGB. M. The expression levels of GFAP in the subdivisions (mMGB, vMGB and dMGB) of the MGB. K. Quantitative analysis of GFAP in the MGB from CT group using western blot. Bar graph shows the protein level of GFAP in the MGB by normalizing against the mean of β-actin, data are normalized to control. L. Quantitative analysis of GFAP in the MGB from CT group using immunohistochemical staining. Bar graph shows the total IOD/area quantification of GFAP in the MGB. N. The expression levels of GFAP in three subdivisions of the MGB. One-way analysis of variance (ANOVA) followed by post hoc Scheffé test was used for multiple comparisons of total expression level in the five or three groups. Two-way analysis of variance (ANOVA) followed by post hoc Scheffé test was used for multiple comparisons of different MGB subdivisions across the five or three groups. Data are presented as mean ± SEM, n value are shown in each bar. *P < 0.05, **P < 0.01, ***P < 0.001, compared with control group.
Figure 5
Figure 5
Changes in Iba1 expression in the A1 cortex following salicylate treatment. A-H. Example coronal sections of A1 cortex stained with Iba1. I. Quantitative analysis of Iba1 in the A1 cortex from AT group using western blot. Bar graph shows the protein level of Iba1 against β-actin in the A1 cortex, data are normalized to control. J. Quantitative analysis of Iba1 in the A1 cortex from AT group using immunohistochemical staining. Bar graph shows the total IOD/area quantification of Iba1 in the A1 cortex. M. The expression levels of Iba1 in five layers (I, II/III, IV, V, and VI) of the A1 cortex. K. Quantitative analysis of Iba1 in the A1 cortex from CT group using western blot. Bar graph shows the protein level of Iba1 in the A1 cortex by normalizing against the mean of β-actin, data are normalized to control. L. Quantitative analysis of Iba1 in the A1 cortex from CT group using immunohistochemical staining. Bar graph shows the total IOD/area quantification of Iba1 in the A1 cortex. N. The expression levels of Iba1 in five layers of the A1 cortex. The n value (italics) of each group is presented in the bar graph. One-way analysis of variance (ANOVA) followed by post hoc Scheffé test was used for multiple comparisons of total expression level in the five or three groups. Two-way analysis of variance (ANOVA) followed by post hoc Scheffé test was used for multiple comparisons of different A1 cortical layers across the five or three groups. Data are presented as mean ± SEM, n value are shown in each bar. *P < 0.05, **P < 0.01, ***P < 0.001, compared with control group.
Figure 7
Figure 7
Skeleton analysis of microglia morphology in the A1 cortex and MGB following salicylate treatment. A. Example images of Iba1 stained in A1 cortex from AT group. Scale bars: 30 μm. B. Iba1 stained images were converted to binary images and skeletonized by image J for analysis. Scale bars: 15 μm. C-F. Quantitative analysis of endpoints and length of processes of microglia in the A1 cortex after salicylate treatment. G-J. Quantitative analysis of endpoints and length of processes of microglia in the MGB after salicylate treatment. The number of astrocyte in each field was quantified in order to normalize skeleton data, the number of (EP/C) and the process length/cell (LE/C) were analyzed. One-way analysis of variance (ANOVA) followed by post hoc Scheffé test was used for multiple comparisons. Data were presented as mean ± SEM, n value are shown in each bar. *P < 0.05, **P < 0.01, ***P < 0.001, compared with control group.
Figure 6
Figure 6
Changes in Iba1 expression in the MGB following salicylate treatment. A-H. Example coronal sections including MGB stained with Iba1. I. Quantitative analysis of Iba1 in the MGB from AT group using western blot. Bar graph shows the protein level of Iba1 against β-actin in the MGB, data are normalized to control. J. Quantitative analysis of Iba1 in the MGB from AT group using immunohistochemical staining. Bar graph shows the total IOD/area quantification of Iba1 in the MGB. M. The expression levels of Iba1 in the subdivisions (mMGB, vMGB and dMGB) of the MGB. K. Quantitative analysis of Iba1 in the MGB cortex from CT group using western blot. Bar graph shows the protein level of Iba1 in the MGB by normalizing against the mean of β-actin, data are normalized to control. L. Quantitative analysis of Iba1 in the MGB from CT group using immunohistochemical staining. Bar graph shows the total IOD/area quantification of Iba1 in the A1 cortex. N. The expression levels of Iba1 in three subdivisions of the MGB. One-way analysis of variance (ANOVA) followed by post hoc Scheffé test was used for multiple comparisons of total expression level in the five or three groups. Two-way analysis of variance (ANOVA) followed by post hoc Scheffé test was used for multiple comparisons of different MGB subdivisions across the five or three groups. Data are presented as mean ± SEM, n value are shown in each bar. *P < 0.05, **P < 0.01, ***P < 0.001, compared with control group.
Figure 8
Figure 8
Changes in IL-1β expression in the A1 cortex and MGB following salicylate treatment. A, B. Example coronal sections of A1 cortex and MGB stained with IL-1β. C, D. Quantitative analysis of mRNA and protein of IL-1β in the A1 cortex from AT group. E, F. Quantitative analysis of mRNA and protein of IL-1β in the A1 cortex from CT group. G, H. Quantitative analysis of mRNA and protein of IL-1β in the MGB from AT group. I, J. Quantitative analysis of mRNA and protein of IL-1β in the MGB from CT group. One-way analysis of variance (ANOVA) followed by post hoc Scheffé test was used for multiple comparisons. Data are presented as mean ± SEM, n value of each group is presented in each bar graph. *P < 0.05, **P < 0.01 and ***P < 0.001, compared with control group.

Similar articles

Cited by

References

    1. Baizer JS, Lobarinas E, Salvi R, Allman BL. Brain research special issue: advances in the neuroscience of tinnitus. Brain Res. 2012;1485:1–2. - PubMed
    1. Eggermont JJ, Roberts LE. The neuroscience of tinnitus. Trends Neurosci. 2004;27:676–682. - PubMed
    1. McCormack A, Edmondson-Jones M, Somerset S, Hall D. A systematic review of the reporting of tinnitus prevalence and severity. Hear Res. 2016;337:70–79. - PubMed
    1. Ryan D, Bauer CA. Neuroscience of tinnitus. Neuroimaging Clin N Am. 2016;26:187–196. - PubMed
    1. Adjamian P, Sereda M, Hall DA. The mechanisms of tinnitus: perspectives from human functional neuroimaging. Hear Res. 2009;253:15–31. - PubMed

LinkOut - more resources