. 2020 Oct 19:8:584060.
doi: 10.3389/fchem.2020.584060. eCollection 2020.

A Time-Resolved Spectroscopic Investigation of a Novel BODIPY Copolymer and Its Potential Use as a Photosensitiser for Hydrogen Evolution

Affiliations

A Time-Resolved Spectroscopic Investigation of a Novel BODIPY Copolymer and Its Potential Use as a Photosensitiser for Hydrogen Evolution

Aoibhín A Cullen et al. Front Chem. .

Abstract

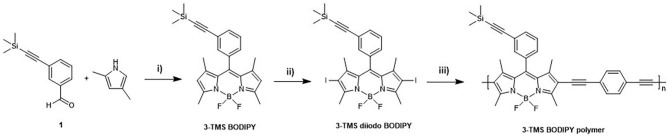
A novel 4,4-difuoro-4-bora-3a,4a-diaza-s-indacene (BODIPY) copolymer with diethynylbenzene has been synthesised, and its ability to act as a photosensitiser for the photocatalytic generation of hydrogen was investigated by time-resolved spectroscopic techniques spanning the ps- to ns-timescales. Both transient absorption and time-resolved infrared spectroscopy were used to probe the excited state dynamics of this photosensitising unit in a variety of solvents. These studies indicated how environmental factors can influence the photophysics of the BODIPY polymer. A homogeneous photocatalytic hydrogen evolution system has been developed using the BODIPY copolymer and cobaloxime which provides hydrogen evolution rates of 319 μmol h-1 g-1 after 24 h of visible irradiation.

Keywords: BODIPY polymer; TAS; TRIR; hydrogen; photocatalytic; time-resolved spectroscopy.


Figures

Figure 1
Figure 1
BODIPY core scaffold (4,4-difuoro-4-bora-3a,4a-diaza-s-indacene) showing IUPAC numbering system (A). 3-TMS polymer reported in this study (red bonds showing the BODIPY unit in the polymeric backbone) (B).
Figure 2
Figure 2
Synthesis of 3-TMS polymer. Reagents and conditions: i) TFA, DDQ, BF3OEt2, TEA, dry CH2Cl2, N2, RT, 3 days; ii) I2, HIO3, EtOH, r.t. overnight; iii) Pd(PPh3)2Cl2, PPh3, CuI, THF/Diisopropylamine, reflux, 3 days.
Figure 3
Figure 3
Normalised absorption spectra for monomer (solid red), polymer (solid blue) and normalised emission spectra for monomer (dashed red) and polymer (dashed blue). CH2Cl2, 298 K.
Figure 4
Figure 4
Emission spectra of the polymer in acetonitrile (red), chloroform (blue), dichloromethane (green), dimethylformamide (black), dimethyl sulfoxide (orange) and tetrahydrofuran (purple) following excitation at 530 nm (A). 3-D Emission map of polymer in dichloromethane, recorded at room temperature. Fixed wavelength axis indicates the various excitation wavelengths used (B). All spectra recorded in at room temperature.
Figure 5
Figure 5
Emission decay of polymer in CH2Cl2 (A) and DMF (B) obtained using FLS1000 Photoluminescence spectrometer λexc = 510 nm. All solutions purged with N2 for 20 minutes prior to sample measurement.
Figure 6
Figure 6
Transient absorption spectra of polymer in CD3CN following excitation using 525 nm (A). Transient absorption spectra of polymer corresponding to indicated time delays, grey lines indicate kinetic traces analysed (B). Temporal evolution of the spectra at wavelengths indicated by grey broken lines in (B) together with the exponential best fit line (C). Normalised Decay Associated Spectra (DAS) corresponding to the lifetimes extracted from modeling of the TA spectra in CD3CN (D).
Figure 7
Figure 7
Transient absorption spectroscopy of polymer in CH3CN, shown at different time delays, (λexc = 355 nm) and corresponding decay at ESA and GSB shown in inset at stated wavelength: 445 nm (black squares) and 525 nm (red circles) with red line showing monoexponential fitting to obtain triplet lifetime. Grey shaded curve represents the ground state absorption spectra of polymer in same solvent. All samples were prepared using freeze-pump thawed to degas.
Figure 8
Figure 8
TRIR spectra following excitation at 525 nm of the polymer in CD3CN (left) in the fingerprint region (A). TRIR spectra following excitation at 525 nm of the polymer dissolved in chloroform the triple bond region (B). Blue spectra indicating initial time delays (ps), red spectra indicated final time delays (ps).
Figure 9
Figure 9
Photocatalytic results following irradiation at λ > 420 nm, cobaloxime as the catalyst (2.5 mM), ascorbic acid as the SA (0.1 M, which was adjusted to pH 5 prior to sample preparation using the appropriate amount of 2 M NaOH), polymer as PS (0.06 mg/mL). Hydrogen evolution curve displayed for different solvent ratios: THF/H2O, 1:1 (v/v) (blue squares, solid line) or CH3CN/H2O, 1:1 (v/v) (red squares, solid line). Hydrogen turnover frequency displayed for each solvent system in μmol h−1 g−1: THF/H2O, 1:1 (v/v) (blue triangles, dashed line) and CH3CN/H2O, 1:1 (v/v) (red triangles, dashed line). All samples where degassed using three freeze-pump thaw cycles prior to irradiation.
Figure 10
Figure 10
Photocatalytic results following irradiation at λ > 420 nm, cobaloxime as the catalyst (2.5 mM), ascorbic acid as the SA (0.1 M, which was adjusted to pH 5 prior to sample preparation using the appropriate amount of 2 M NaOH), solvent ratio THF/H2O, 1:1 (v/v) and polymer as PS (0.25 mg/mL; blue squares, solid line) or (0.06 mg/mL; red squares, solid line). Hydrogen turnover frequency displayed for each polymer concentration analysed in μmol h−1 g−1: 0.25 mg/mL (blue triangles, dashed line) and 0.06 mg/mL (red triangles, dashed line). All samples where degassed using three freeze-pump thaw cycles prior to irradiation.

References

    1. Alemdaroglu F. E., Alexander S. C., Ji D., Prusty D. K., Borsch M., Herrmann A. (2009). Poly(BODIPY)S: a new class of tunable polymeric dyes. Macromolecules 42, 6529–6536. 10.1021/ma900727k - DOI
    1. Artero V., Chavarot-Kerlidou M., Fontecave M. (2011). Splitting water with cobalt. Angew. Chem. Int. Ed. 50, 7238–7266. 10.1002/anie.201007987 - DOI - PubMed
    1. Azov V. A., Schlegel A., Diederich F. (2005). Geometrically precisely defined multinanometer expansion/contraction motions in a resorcin[4]arene cavitand based molecular switch. Angew. Chem. Int. Ed. 44, 4635–4638. 10.1002/anie.200500970 - DOI - PubMed
    1. Bandyopadhyay S., Anil A. G., James A., Patra A. (2016). Multifunctional porous organic polymers: tuning of porosity, CO2, and H2 storage and visible-light-driven photocatalysis. ACS Appl. Mater. Interfaces 8, 27669–27678. 10.1021/acsami.6b08331 - DOI - PubMed
    1. Banerjee T., Haase F., Savasci G., Gottschling K., Ochsenfeld C., Lotsch B. V. (2017). Single-site photocatalytic H2 evolution from covalent organic frameworks with molecular cobaloxime co-catalysts. J. Am. Chem. Soc. 139, 16228–16234. 10.1021/jacs.7b07489 - DOI - PMC - PubMed