. 2020 Oct 23:8:579511.
doi: 10.3389/fbioe.2020.579511. eCollection 2020.

Quantifying Asymmetry in Gait: The Weighted Universal Symmetry Index to Evaluate 3D Ground Reaction Forces

Affiliations

Quantifying Asymmetry in Gait: The Weighted Universal Symmetry Index to Evaluate 3D Ground Reaction Forces

Sónia A Alves et al. Front Bioeng Biotechnol. .

Abstract

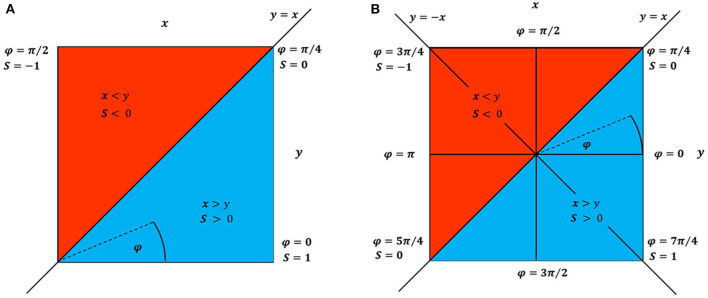
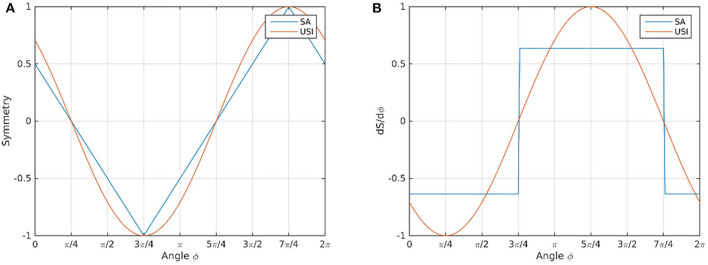
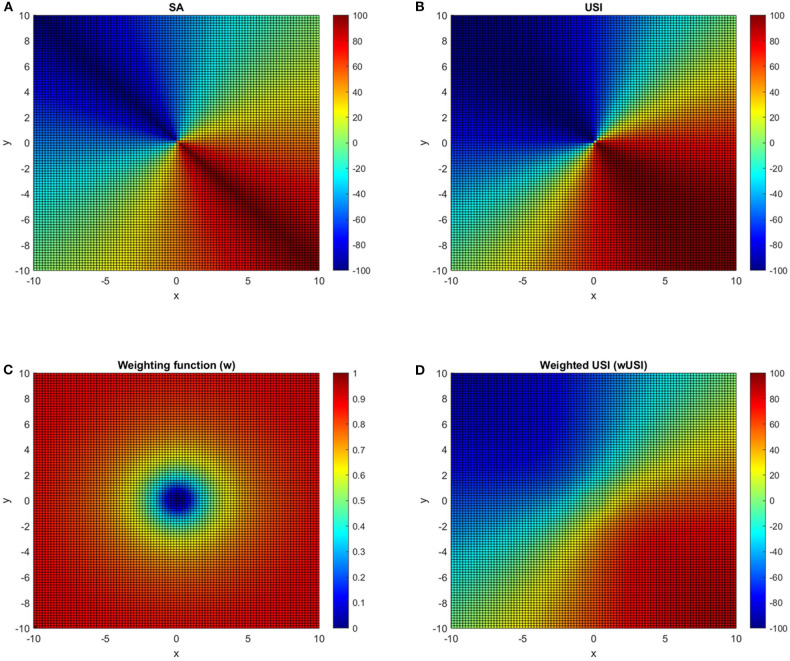
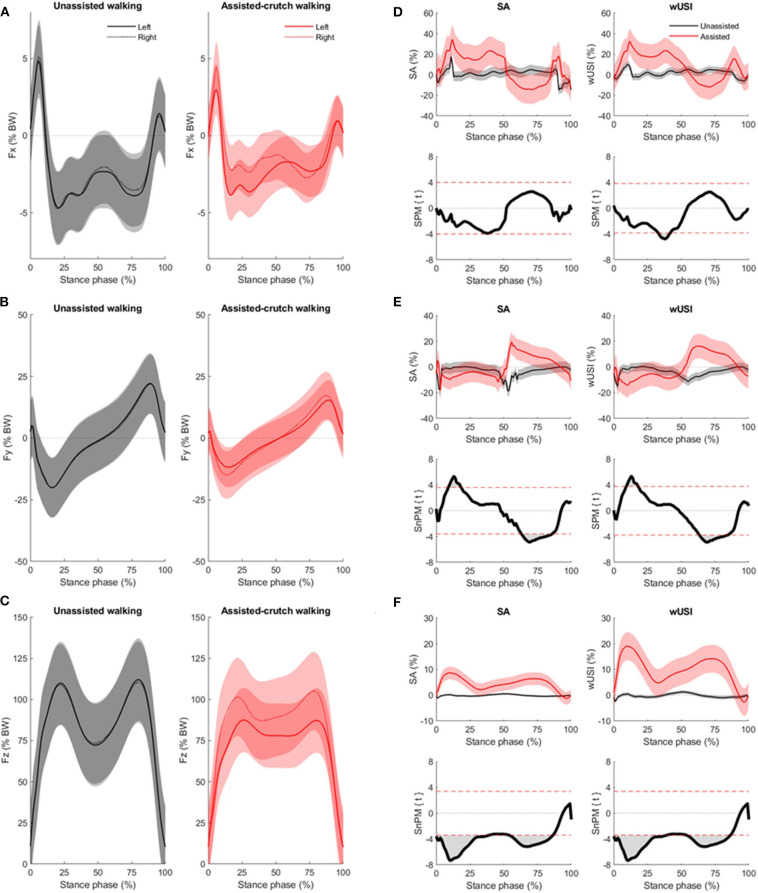
Though gait asymmetry is used as a metric of functional recovery in clinical rehabilitation, there is no consensus on an ideal method for its evaluation. Various methods have been proposed to analyze single bilateral signals but are limited in scope, as they can often use only positive signals or discrete values extracted from time-scale data as input. By defining five symmetry axioms, a framework for benchmarking existing methods was established and a new method was described here for the first time: the weighted universal symmetry index (wUSI), which overcomes limitations of other methods. Both existing methods and the wUSI were mathematically compared to each other and in respect to their ability to fulfill the proposed symmetry axioms. Eligible methods that fulfilled these axioms were then applied using both discrete and continuous approaches to ground reaction force (GRF) data collected from healthy gait, both with and without artificially induced asymmetry using a single instrumented elbow crutch. The wUSI with a continuous approach was the only symmetry method capable of identifying GRF asymmetry differences in different walking conditions in all three planes of motion. When used with a continuous approach, the wUSI method was able to detect asymmetries while avoiding artificial inflation, a common problem reported in other methods. In conclusion, the wUSI is proposed as a universal method to quantify three-dimensional GRF asymmetries, which may also be expanded to other biomechanical signals.

Keywords: bilateral signals; crutch gait; gait asymmetry; ground reaction forces; symmetry.


Figures

Figure 1
Figure 1
Schematic visualization for any symmetry measure (S) outcome according to the combination of only positive input values for x and y (A) and to combination of positive and negative x and y values (B). The φ variable represents φ = arctan2(y/x). The blue shaded color represents the area of positive asymmetry values, i.e., x > yS > 0 and the red shaded color represents the area of negative asymmetry values, i.e., x < yS < 0. The diagonal common to both (A) and (B) (top-right toward bottom-left) and anti-diagonal in (B) (top-left toward bottom-right) represent the cases for y = x and y = −x, respectively.
Figure 2
Figure 2
Methods SA (blue line) and USI methods (orange line) plotted as function of ϕ (A); first derivatives (dS/dϕ) of the SA (blue line) and USI methods (orange line) (B). The discontinuities can be observed in the derivatives panel for the SA method, occuring at ϕ = 3π/4 and ϕ = 7π/4.
Figure 3
Figure 3
Heat maps for the SA (A), USI (B) methods, for the weighting function based on a profile similar as a Cauchy distribution (C) and for the wUSI method with the weighting factor applied (D). The three methods output (A,B,D) are on a common scale of [−100, 100] and the input signals x, y have a range of [−10, 10], being σ set to 1. A symmetry value of zero (green color) represents a perfect symmetry scenario and a symmetry value of 100 or −100 (dark red and dark blue color, respectively) represents a scenario of complete asymmetry. A detailed description of the weighting function application can be found in the Supplementary Material.
Figure 4
Figure 4
Mean curves (bold) with standard deviation (shaded) for the Fx (A), Fy (B) and Fz (C) components of the GRF for the unassisted walking (black) and crutch-assisted (red) walking condition for the left (solid line) and right (dotted line) side. Mean curves (bold) with standard deviation (shaded) of asymmetry results using the SA and wUSI methods with the continuous approach application for the unassisted (black line) and crutch-assisted (red line) walking condition are presented in the top row of panels (D–F), for the Fx, Fy, and Fz components of the GRF, respectively. Positive values of both SA and wUSI indicate higher GRF values yielded on the right side, whereas negative values indicate higher GRF values yielded on the left side, for each component. The bottom rows of panels (D–F), represent the two-sample t-test statistical parametric or non-parametric mapping trajectories, SPM{t} and SnPM{t}, for the respective symmetry method and GRF component. Horizontal dashed red lines on the SPM panels indicate the critical thresholds (z-star values) for significance. As a two-tailed t-test was applied, positive and negative z-star values were yielded.

References

    1. Åberg A. C., Frykberg G. E., Halvorsen K. (2010). Medio-lateral stability of sit-to-walk performance in older individuals with and without fear of falling. Gait Posture 31, 438–443. 10.1016/j.gaitpost.2010.01.018 - DOI - PubMed
    1. Abe M. O., Masani K., Nozaki D., Akai M., Nakazawa K. (2010). Temporal correlations in center of body mass fluctuations during standing and walking. Hum. Mov. Sci. 29, 556–566. 10.1016/j.humov.2010.03.002 - DOI - PubMed
    1. Albiol L., Buttner A., Pflanz D., Mikolajewicz N., Birkhold A. I., Kramer I., et al. . (2020). Effects of long-term sclerostin deficiency on trabecular bone mass and adaption to limb loading differ in male and female mice. Calcif. Tissue Int. 106, 415–430. 10.1007/s00223-019-00648-4 - DOI - PubMed
    1. Aqil A., Wiik A., Zanotto M., Manning V., Masjedi M., Cobb J. P. (2016). The effect of hip arthroplasty on osteoarthritic gait: a blinded, prospective and controlled gait study at fast walking speeds. J. Arthroplasty 31, 2337–2341. 10.1016/j.arth.2016.03.002 - DOI - PubMed
    1. Bender A., Bergmann G. (2012). Determination of typical patterns from strongly varying signals. Comput. Methods Biomech. Biomed. Engin. 15, 761–769. 10.1080/10255842.2011.560841 - DOI - PubMed

LinkOut - more resources