. 2020 Oct 22:8:592893.
doi: 10.3389/fcell.2020.592893. eCollection 2020.

Disease Phenotypes and Mechanisms of iPSC-Derived Cardiomyocytes From Brugada Syndrome Patients With a Loss-of-Function SCN5A Mutation

Affiliations

Disease Phenotypes and Mechanisms of iPSC-Derived Cardiomyocytes From Brugada Syndrome Patients With a Loss-of-Function SCN5A Mutation

Wener Li et al. Front Cell Dev Biol. .

Abstract

Brugada syndrome (BrS) is one of the major causes of sudden cardiac death in young people, while the underlying mechanisms are not completely understood. Here, we investigated the pathophysiological phenotypes and mechanisms using induced pluripotent stem cell (iPSC)-derived cardiomyocytes (CMs) from two BrS patients (BrS-CMs) carrying a heterozygous SCN5A mutation p.S1812X. Compared to CMs derived from healthy controls (Ctrl-CMs), BrS-CMs displayed a 50% reduction of I Na density, a 69.5% reduction of NaV1.5 expression, and the impaired localization of NaV1.5 and connexin 43 (Cx43) at the cell surface. BrS-CMs exhibited reduced action potential (AP) upstroke velocity and conduction slowing. The I to in BrS-CMs was significantly augmented, and the I CaL window current probability was increased. Our data indicate that the electrophysiological mechanisms underlying arrhythmia in BrS-CMs may involve both depolarization and repolarization disorders. Cilostazol and milrinone showed dramatic inhibitions of I to in BrS-CMs and alleviated the arrhythmic activity, suggesting their therapeutic potential for BrS patients.

Keywords: Brugada syndrome; SCN5A mutation; depolarization; disease modeling; induced pluripotent stem cells; repolarization.


Figures

FIGURE 1
FIGURE 1
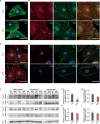
The expression of cardiac-specific proteins in Ctrl- and BrS-CMs. (A) Immunostaining of Ctrl- and BrS-CMs for cardiac markers cTnT. Scale bar, 20 μm. (B) Double-immunostaining of α-actinin and NaV1.5. Scale bar, 20 μm. (C) Double-immunostaining of Cx43 and α-actinin. Scale bar, 20 μm. (D) Double-immunostaining of Ctrl- and BrS-CMs with antibodies against Cx43 and NaV1.5. Scale bar, 20 μm. (E) Shown are original western blots for the decoration of NaV1.5 α subunit, Cx43, CaV1.2, KV4.3, and cTnT. The arrows represent the target bands used for quantification. Quantitative analysis of NaV1.5 α subunit (F), Cx43 (G), CaV1.2 (H), and KV4.3 (I) expression (normalized to cTnT). Data are presented as mean ± SEM. Two-tailed unpaired Student’s t-test was used for statistical analysis: #P < 0.01.
FIGURE 2
FIGURE 2
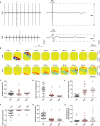
Field potential and conduction velocity of Ctrl- and BrS-CMs. (A) Represented original field potential traces of Ctrl2- and BrS1-CMs were enlarged to show PPA, PPD, and PPS. (B) Represented beats of Ctrl2- and BrS1-CMs were dissected to 10 frames (0, 5, 10, 15, 20, 25, 30, 35, 40, 45 ms), respectively. The width and length of the electrodes distributed area were 1.43 mm. The metrics of MEA measurements including beating frequency (C), PPA (D), PPD (E), PPS (F), CV (G), and normalized SD of inter-beat interval (H) in Ctrl-CMs, BrS1-CMs, and BrS2-CMs. Gray triangle represents Ctrl1 and gray rectangle represents Ctrl2. Data are mean ± SEM. One-way ANOVA followed by Tukey’s post hoc test was used for statistical analysis: P < 0.05, §P < 0.001. PPA, peak-to-peak amplitude; PPD, peak-to-peak duration; PPS, peak-to-peak slope; CV, conduction velocity; SD, standard deviation.
FIGURE 3
FIGURE 3
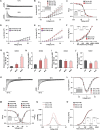
INa characterization in Ctrl- and BrS-CMs. (A) Examples of original INa traces elicited by 5 mV-step depolarization from −95 to 5 mV at a holding potential of −100 mV. Left, Na+ current in one Ctrl1-CM. Right, Na+ current in one BrS1-CM. (B) Average IV relationships of the INa in Ctrl- and BrS-CMs. The protocol is shown as inset. (C) Current–voltage relationships normalized to the maximum peak INa show a positive shift of the peak INa in BrS1- and BrS2-CMs compared to Ctrl1- and Ctrl2-CMs. No differences were observed between two controls or two BrS. (D) Average of the steady-state voltage dependence of activation of the INa in Ctrl- and BrS-CMs. The protocol is shown as inset. (E) Average of the steady-state voltage dependence of inactivation of INa in Ctrl- and BrS-CMs. The protocol is shown as inset. (F) Average of the recovery from inactivation of INa in Ctrl- and BrS-CMs. The protocol is shown as inset. (G) Average current–voltage relationships of the INa in Ctrl-CMs with and without 2.5 or 5 μM TTX treatment. Protocol is shown as inset. (H) Average steady-state voltage dependence of activation in Ctrl-CMs treated with and without 2.5 μM TTX. Protocol is shown as inset. (I) Vmax in Ctrl-CMs with and without 2.5 or 5 μM TTX treatment. Data are presented as mean ± SEM. Two-way repeated measures ANOVA (B–H) and one-way ANOVA followed by Tukey’s post hoc test were used for statistical analysis: P < 0.05, #P < 0.01, §P < 0.001.
FIGURE 4
FIGURE 4
ICaL and Ito characterization of Ctrl- and BrS-CMs. (A) Examples of original Ito traces elicited by 10 mV-step depolarization from −40 to 60 mV at a holding potential of −90 mV. Top, Ito in one Ctrl1-CM. Bottom, Ito in one BrS1-CM. (B) Average IV relationships of the Ito current in Ctrl- and BrS-CMs. Protocol is shown as inset. (C) Average of the steady-state voltage dependence of inactivation Ito current in Ctrl- and BrS-CMs. The pulse protocol is shown as inset. No significant differences were observed. The Ito current density in Ctrl-CMs (D) and BrS-CMs (E) with and without 4-AP (1 mM) treatment for 1 min. (F) Average of recovery from inactivation of Ito current in Ctrl- and BrS-CMs. The pulse protocol is shown as inset. No significant differences were observed. Expression profile of Ito-related genes: KCND3 (G), KCND2 (H), KCNA4 (I), and TNNT2 (J). Data were presented relative to RPL32 expression (Ctrl: n = 6, BrS1: n = 6, BrS2: n = 6 independent differentiation experiments). (K) Examples of original ICaL traces of a Ctrl2-CM and a BrS1-CM. (L) Average IV relationships of the ICaL in Ctrl-, BrS1-, and BrS2-CMs. The protocol is shown as inset. (M) The steady-state of activation (G/Gmax) and steady-state of inactivation (I/Imax) are overlaid to show the window current of ICaL. Window currents are the areas under the intersecting current–voltage curves. The impulse for inactivation is shown as inset. (N) The probability being within ICaL window current is plotted. (O) Average of recovery from inactivation of ICaL in Ctrl-, BrS1-, and BrS2-CMs. The pulse protocol is shown as inset. Data are presented as mean ± SEM. Two-way repeated measures ANOVA was used for Ito and ICaL statistical analysis. One-way ANOVA was used for gene expression analyses. P < 0.05, #P < 0.01, §P < 0.001.
FIGURE 5
FIGURE 5
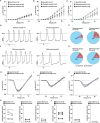
Action potential characterization of Ctrl- and BrS-CMs. (A) Representative traces of spontaneous action potentials (APs) measured in ventricular-, atrial-, and nodal-like CMs. (B) Vmax in ventricular- and atrial-like BrS- and Ctrl-CMs. Data are presented as mean ± SEM. One-way ANOVA followed by Tukey’s post hoc test was used for statistical analysis: #P < 0.01, §P < 0.001. (C) Representative traces of spontaneous AP recordings from Ctrl- and BrS-CMs. (D) Percentage of Ctrl- and BrS-CMs with spontaneously (ar)rhythmic beating. Two-tailed Fisher’s exact test was used for statistical analysis.
FIGURE 6
FIGURE 6
Effects of PDE inhibitor cilostazol or milrinone on electrophysiological properties of Ctrl- and BrS-CMs. Average current–voltage relationships of Ito in Ctrl-CMs (A), BrS1-CMs (B), and BrS2-CMs (C) with and without cilostazol (10 μM) or milrinone (2.5 μM) treatment for half an hour. Data are presented mean ± SEM. (D) Representative original action potential (AP) traces of Ctrl- and BrS-CMs after 10 μM cilostazol treatment. (E) Percentages of Ctrl- and BrS-CMs with rhythmic and arrhythmic APs after 10 μM cilostazol treatment. (F) Representative original AP traces of Ctrl- and BrS-CMs after 2.5 μM milrinone treatment. (G) Percentages of Ctrl- and BrS-CMs with rhythmic and arrhythmic APs after 2.5 μM milrinone treatment. Average IV curves of INa (automated patch-clamp) in Ctrl-CMs (H), BrS1-CMs (I), and BrS2-CMs (J) with and without 2.5 μM milrinone treatment for half an hour. No statistically significant differences were observed. (K) Quantitative analysis of the conduction velocity in Ctrl-, BrS1-, and BrS2-CMs with and without cilostazol (10 μM) treatment. No statistically significant differences were observed. (L) Quantitative analysis of the conduction velocity in Ctrl-, BrS1, and BrS2-CMs with and without 2.5 μM milrinone treatment. No statistically significant differences were observed. Two-way repeated measures ANOVA (A–C,H–J) and two-tailed paired Student’s t-test (K,L) were used for statistical analysis: P < 0.05, #P < 0.01, §P < 0.001.

References

    1. Antzelevitch C., Fish J. M. (2006). Therapy for the Brugada syndrome. Handb. Exp. Pharmacol. 171 305–330. - PMC - PubMed
    1. Calloe K., Cordeiro J. M., Di Diego J. M., Hansen R. S., Grunnet M., Olesen S. P., et al. (2009). A transient outward potassium current activator recapitulates the electrocardiographic manifestations of Brugada syndrome. Cardiovasc. Res. 81 686–694. 10.1093/cvr/cvn339 - DOI - PMC - PubMed
    1. Cerrone M., Delmar M. (2014). Desmosomes and the sodium channel complex: implications for arrhythmogenic cardiomyopathy and Brugada syndrome. Trends Cardiovasc. Med. 24 184–190. 10.1016/j.tcm.2014.02.001 - DOI - PMC - PubMed
    1. Costantini D. L., Arruda E. P., Agarwal P., Kim K. H., Zhu Y., Zhu W., et al. (2005). The homeodomain transcription factor Irx5 establishes the mouse cardiac ventricular repolarization gradient. Cell 123 347–358. 10.1016/j.cell.2005.08.004 - DOI - PMC - PubMed
    1. Cyganek L., Tiburcy M., Sekeres K., Gerstenberg K., Bohnenberger H., Lenz C., et al. (2018). Deep phenotyping of human induced pluripotent stem cell-derived atrial and ventricular cardiomyocytes. JCI Insight 3:e99941. - PMC - PubMed