Review
. 2020 Oct 19:7:583826.
doi: 10.3389/fmolb.2020.583826. eCollection 2020.

Enzyme Kinetics by Isothermal Titration Calorimetry: Allostery, Inhibition, and Dynamics

Affiliations
Review

Enzyme Kinetics by Isothermal Titration Calorimetry: Allostery, Inhibition, and Dynamics

Yun Wang et al. Front Mol Biosci. .

Abstract

Isothermal titration calorimetry (ITC) involves accurately measuring the heat that is released or absorbed in real time when one solution is titrated into another. This technique is usually used to measure the thermodynamics of binding reactions. However, there is mounting interest in using it to measure reaction kinetics, particularly enzymatic catalysis. This application of ITC has been steadily growing for the past two decades, and the method is proving to be sensitive, generally applicable, and capable of providing information on enzyme activity that is difficult to obtain using traditional biochemical assays. This review aims to give a broad overview of the use of ITC to measure enzyme kinetics. It describes several different classes of ITC experiment, their strengths and weaknesses, and recent methodological advancements. A summary of applications in the literature is given and several examples where ITC has been used to investigate challenging aspects of enzyme behavior are presented in more detail. These include examples of allostery, where small-molecule binding outside the active site modulates activity. We describe the use of ITC to measure the strength, mode (i.e., competitive, uncompetitive, or mixed), and association and dissociation kinetics of enzyme inhibitors. Further, we provide examples of ITC applied to complex, heterogeneous mixtures, such as insoluble substrates and live cells. These studies exemplify the wide range of problems where ITC can provide answers, and illustrate the versatility of the technique and potential for future development and applications.

Keywords: ITC; activation; allostery; enzyme catalysis; inhibition; kinetics.


Figures

FIGURE 1
FIGURE 1
Michaelis-Menten kinetics. (A) Velocity (ν0) of a typical enzyme-catalyzed reaction versus substrate concentration ([S]). (B) Double-Reciprocal (Lineweaver–Burk) linearized plot (1/ν0 vs. 1/[S]) of the rates in (A).
FIGURE 2
FIGURE 2
A typical ITC enzyme kinetics experiment. The reaction is initiated when substrate in the syringe is injected into the sample cell containing enzyme. If the reaction is exothermic (endothermic), less (more) feedback power must be supplied to the sample cell to keep it at the same temperature as the reference cell. The instantaneous value of the feedback power is the ITC output.
FIGURE 3
FIGURE 3
Multiple injection and single injection ITC enzyme kinetic data. (A) Multiple injection assay of prolyl oligopeptidase in the sample cell and one of its substrates, thyrotropin releasing hormone, in the syringe (Di Trani et al., 2017). The downward spikes correspond to dilution artifacts from each injection (3, 3, 6, 6, 6, 10, 30, 30, 30, 60, and 60 μL). Larger injections produce larger spikes. The displacement, following each injection, of the horizontal baseline relative to the initial baseline (red dotted line) is proportional to the enzyme velocity. (B) MM/BH plot calculated from the data in (A). Error bars correspond to the standard deviations of three repeat experiments. (C) Single injection assay with trypsin in the sample cell and one of its substrates, benzoyl-L-arginine ethyl ester, in the syringe (Di Trani et al., 2018b). Data collected during (after) the 30 s injection are plotted in orange (blue). (D) Deconvolution of the data in (C) to remove the effect of the delayed instrument response according to Equation 10 and an empirical response function. Note that during the first 30 s, the substrate is injected into the sample cell faster than it is consumed and its concentration gradually increases, while the reaction velocity asymptotically approaches the maximum Vmax value, in accordance with the MM/BH Equation (orange circles). After the injection ends, the substrate continues to be consumed and its concentration gradually drops, while the reaction velocity decreases to zero once more (blue circles). (E) MM/BH plot generated from the data in (D) using Equation 8. The rate versus [S] values are superimposable for the injection (orange, increasing [S]) and post-injection (blue, decreasing [S]) halves of the experiment, providing cross-validation for the data.
FIGURE 4
FIGURE 4
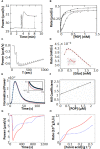
Non-MM/BH enzyme kinetics observed by ITC. (A) Single injection experiments with pyruvate kinase in the syringe and phosphoenolpyruvate and ADP in the sample cell (Lonhienne and Winzor, 2002). The displacement of the horizontal baseline is proportional to the velocity of the enzyme. (B) Baseline displacements (ΔP) obtained at different [PEP] (O), in the presence of phenylalanine as an allosteric effector (□), and in the presence of phenylalanine and proline as a molecular crowding agent (■). (C) Multiple injection assay with gluconokinase and ATP in the sample cell and gluconate in the syringe (Rohatgi et al., 2015). (D) Enzyme velocities from (C), fitted to a variant of Equation 12 that accounts for formation of the non-productive E⋅ADP⋅gluconate ternary complex. (E) Single injection assay with substrate (thyrotropin releasing hormone) in the syringe and prolyl oligopeptidase (POP) in the sample cell (Di Trani et al., 2017). Points are experimental data, red and blue curves are the best fits with classical MM/BH model, and cooperative model (Equation 11) with n = 2.4, respectively. (F) Dependence of the extracted Hill coefficient on POP concentration (0.125, 1.2, and 2 μM). (G) Single injection assay with versatile peroxidase in the sample cell and fulvic acid in the syringe, exhibiting biphasic cooperative kinetics (Siddiqui et al., 2014). (H) Reaction rates as s function of substrate concentration calculated from (G). In (G,H), data were extracted from the original reference using Graph Grabber v2.0.2 (Quintessa) and plotted using MATLAB (MathWorks); red solid curves indicate the first injection and blue dashed curves indicate the second injection.
FIGURE 5
FIGURE 5
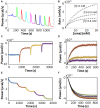
Enzyme inhibition characterized by ITC single injection-type assays. (A) Inverse injection assay with α-amylase in the syringe and the substrate 2-chloro-4-nitrophenyl-maltoside (GalG2CNP) in the syringe together with a variety of inhibitors: ACA (acarbose), CA (chlorogenic acid), EC (epicatechin), ECox (oxidized epicatechin), EGCG (epigallocatechin gallate), Mlv-3-glc (malvidin-3-glucoside) (Hanhineva et al., 2010). (B) MM/BH curves calculated from the curves in (A). (C) Single injection assay with substrate (benzoyl-L-arginine ethyl ester) and inhibitor (benzamidine) in the syringe and trypsin in the sample cell (Di Trani et al., 2018b). (D) Kmapp values extracted from direct fits to each of the injections (different colors) in (C). (E) Data from (C), deconvoluted using the empirical response model (Equation 10), converted to ν0 and [S] and presented as a double-reciprocal plot. (F) Single injection assay with substrate (ATP) in the syringe and aminoglycoside-3′-phosphotransferase IIIa (APH) and kanamycin A in the sample cell (Wang et al., 2019). Under these dilute conditions [ATP] << Km, ITC peaks decay exponentially with rate constant keff = kcat/Km. keff decreases with each injection due to product inhibition by ADP. (G) Plot of [APH]/keff as a function of total accumulated ADP concentration.
FIGURE 6
FIGURE 6
Enzyme inhibition characterized by ITC Pseudo-First-Order-type assays. (A) Multiple injection-type ITC assays with urea in the syringe and urease in the sample cell (Benini et al., 2014). (B) MM/BH plots from data similar to (A) with fluoride ion concentrations of 0, 0.4, and 0.8 mM, fitted to a mixed inhibition model (Equation 16). In (A,B), data were extracted from the original reference using Graph Grabber v2.0.2 (Quintessa) and plotted using MATLAB (MathWorks). (C) Inhibitor association kinetics experiment with prolyl oligopeptidase (POP) and substrate (thyrotropin releasing hormone, TRH) in the sample cell and reversible covalent inhibitor in the syringe (Di Trani et al., 2018a). (D) Overlay of injections 1–3 from (C) (colored points) with best global fits to a kinetic model of association (black curves). (E) Inhibitor dissociation kinetics experiment with TRH in the sample cell and POP and a reversible covalent inhibitor in the syringe (Di Trani et al., 2018a). (F) Overlay of injections 2–5 from (E) (colored points) with fit best global fits to a kinetic model of dissociation (black curves).
FIGURE 7
FIGURE 7
Isothermal titration calorimetry characterization of heterogeneous mixtures. (A) Single injection assays with substrate (cefazolin) in the syringe and purified NDM-1 in the sample cell (Zhang et al., 2018). (B) Single injection assays with cefazolin in the syringe and a suspension of live E. coli bacteria expressing NDM-1 in the sample cell. (C) Experiments in (B) repeated with various concentrations of an inhibitor (D-captopril) added to the E. coli suspension. (D) IC50 calculation, taking the magnitude of each peak in (C) as proportional to enzyme activity. Single injection assays with chitinase in the injection syringe and (E) soluble chitin fragments or (F) insoluble chitin in the sample cell (Lonhienne et al., 2001). Vertical arrows indicate timings of injections.

Similar articles

Cited by

References

    1. Abdel-Hamid A. M., Solbiati J. O., Cann I. K. O. (2013). “Insights into lignin degradation and its potential industrial applications,” in Advances in Applied Microbiology, Vol. 82 eds Sariaslani S., Gadd G. M. (Cambridge, MA: Academic Press; ), 1–28. 10.1016/b978-0-12-407679-2.00001-6 - DOI - PubMed
    1. Abis G., Pacheco-Gómez R., Bui T. T. T., Conte M. R. (2019). Isothermal titration calorimetry enables rapid characterization of enzyme kinetics and inhibition for the human soluble epoxide hydrolase. Anal. Chem. 91 14865–14872. 10.1021/acs.analchem.9b01847 - DOI - PMC - PubMed
    1. Ali G., Dulong V., Gasmi S. N., Rihouey C., Picton L., Le Cerf D. (2015). Covalent immobilization of pullulanase on alginate and study of its hydrolysis of pullulan. Biotechnol. Progr. 31 883–889. 10.1002/btpr.2093 - DOI - PubMed
    1. Ali G., Rihouey C., Larreta-Garde V., Le Cerf D., Picton L. (2013a). Molecular size characterization and kinetics studies on hydrolysis of pullulan by pullulanase in an entangled alginate medium. Biomacromolecules 14 2234–2241. 10.1021/bm400371r - DOI - PubMed
    1. Ali G., Rihouey C., Le Cerf D., Picton L. (2013b). Effect of carboxymethyl groups on degradation of modified pullulan by pullulanase from Klebsiella pneumoniae. Carbohydr. Polym. 93 109–115. 10.1016/j.carbpol.2012.07.039 - DOI - PubMed