. 2020 Oct 23:7:586871.
doi: 10.3389/fcvm.2020.586871. eCollection 2020.

Predicting Diagnostic Gene Biomarkers Associated With Immune Infiltration in Patients With Acute Myocardial Infarction

Affiliations

Predicting Diagnostic Gene Biomarkers Associated With Immune Infiltration in Patients With Acute Myocardial Infarction

Enfa Zhao et al. Front Cardiovasc Med. .

Abstract

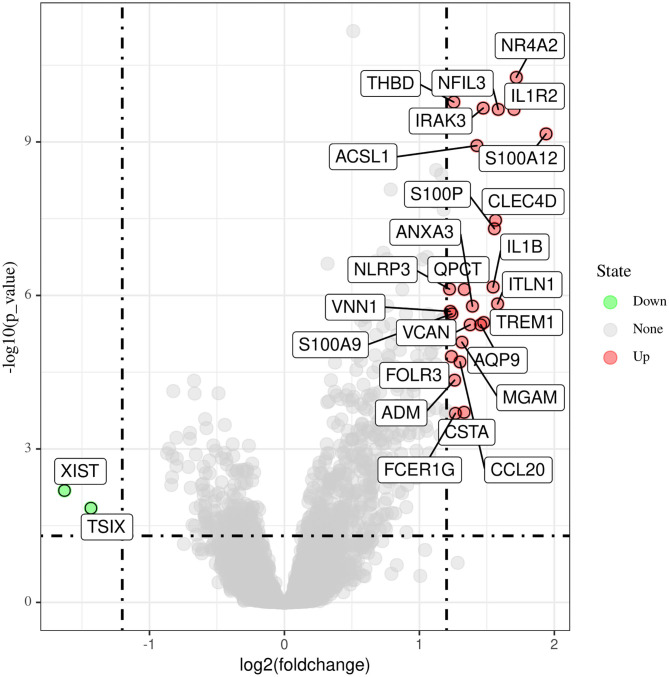
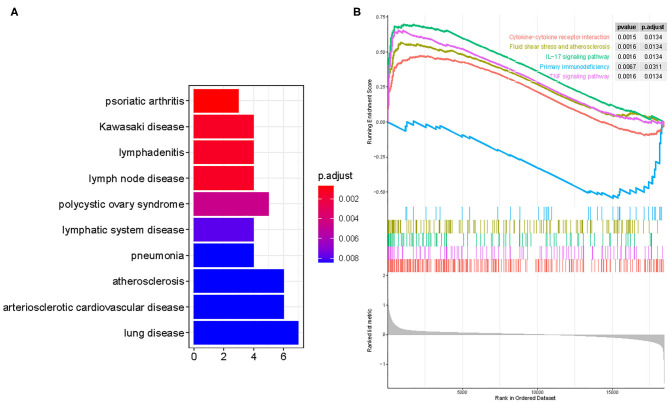
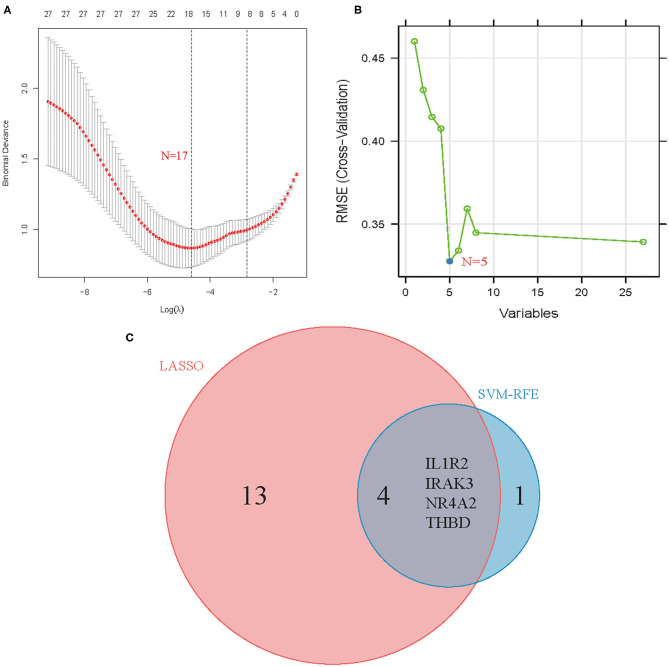
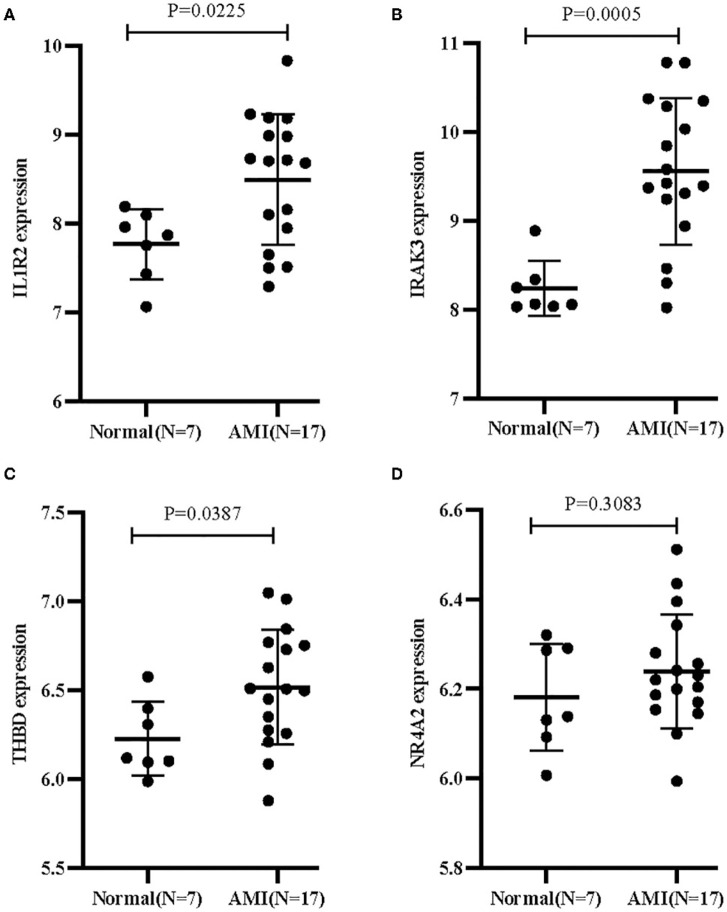
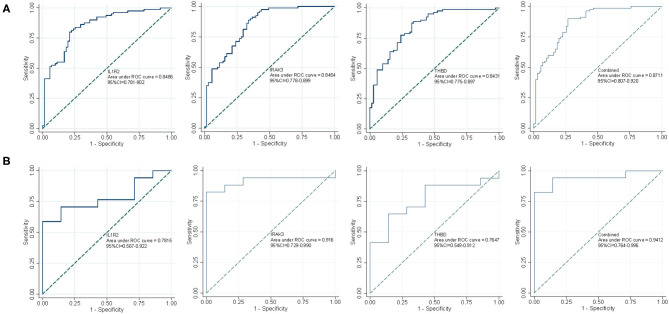
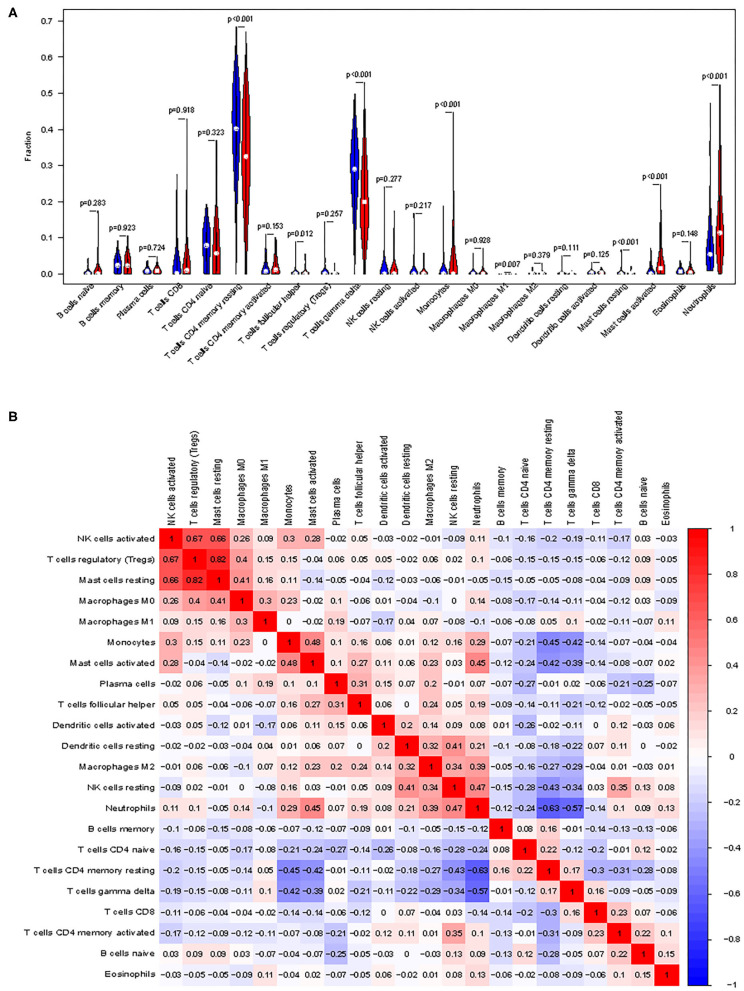
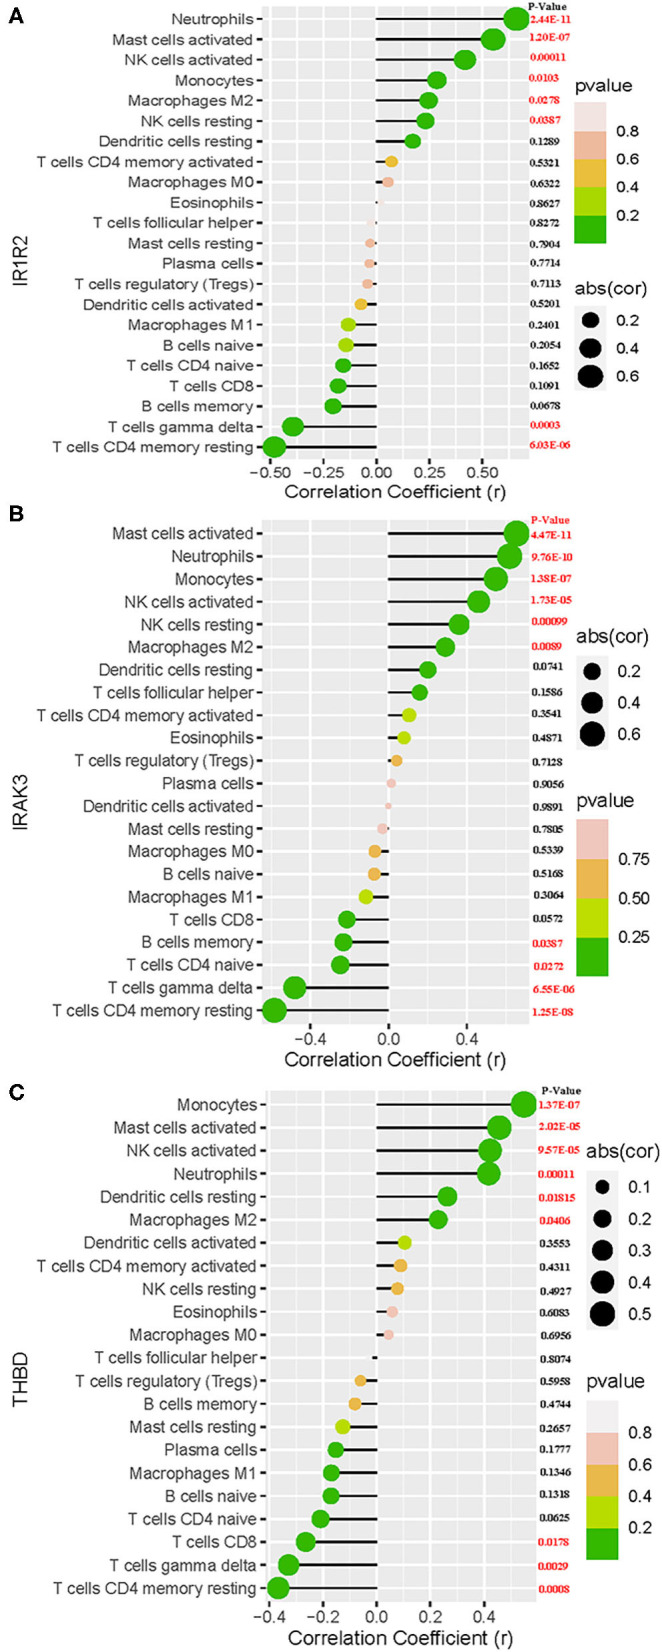
Objective: The present study was designed to identify potential diagnostic markers for acute myocardial infarction (AMI) and determine the significance of immune cell infiltration in this pathology. Methods: Two publicly available gene expression profiles (GSE66360 and GSE48060 datasets) from human AMI and control samples were downloaded from the GEO database. Differentially expressed genes (DEGs) were screened between 80 AMI and 71 control samples. The LASSO regression model and support vector machine recursive feature elimination (SVM-RFE) analysis were performed to identify candidate biomarkers. The area under the receiver operating characteristic curve (AUC) value was obtained and used to evaluate discriminatory ability. The expression level and diagnostic value of the biomarkers in AMI were further validated in the GSE60993 dataset (17 AMI patients and 7 controls). The compositional patterns of the 22 types of immune cell fraction in AMI were estimated based on the merged cohorts using CIBERSORT. Results: A total of 27 genes were identified. The identified DEGs were mainly involved in carbohydrate binding, Kawasaki disease, atherosclerosis, and arteriosclerotic cardiovascular disease. Gene sets related to atherosclerosis signaling, primary immunodeficiency, IL-17, and TNF signaling pathways were differentially activated in AMI compared with the control. IL1R2, IRAK3, and THBD were identified as diagnostic markers of AMI (AUC = 0.877) and validated in the GSE60993 dataset (AUC = 0.941). Immune cell infiltration analysis revealed that IL1R2, IRAK3, and THBD were correlated with M2 macrophages, neutrophils, monocytes, CD4+ resting memory T cells, activated natural killer (NK) cells, and gamma delta T cells. Conclusion: IL1R2, IRAK3, and THBD can be used as diagnostic markers of AMI, and can provide new insights for future studies on the occurrence and the molecular mechanisms of AMI.

Keywords: CIBERSORT; acute myocardial infarction; biomarker; diagnostic; immune infiltration.


Figures

Figure 1
Figure 1
Differentially expressed genes between acute myocardial infarction tissue and control samples.
Figure 2
Figure 2
Functional enrichment analyses to identify potential biological processes via disease ontology and gene set enrichment analysis. (A) Disease ontology enrichment analysis of differentially expressed genes between AMI and control samples. (B) Enrichment analyses via gene set enrichment analysis.
Figure 3
Figure 3
Screening process of diagnostic biomarker candidates for acute myocardial infarction diagnosis. (A) Tuning feature selection in the least absolute shrinkage and selection operator model. (B) A plot of biomarkers selection via support vector machine-recursive feature elimination (SVM-RFE) algorithm. (C) Venn diagram demonstrating four diagnostic markers shared by the least absolute shrinkage and selection operator and SVM-RFE algorithms.
Figure 4
Figure 4
Validation of the expression of diagnostic biomarkers in the GSE60993 dataset. (A) IL1R2; (B) IRAK3; (C) THBD; (D) NR4A2.
Figure 5
Figure 5
The receiver operating characteristic (ROC) curve of the diagnostic effectiveness of the three diagnostic markers. (A) ROC curve of IL1R2, IRAK3, and THBD after fitting to one variable in the metadata cohort; (B) ROC curve of IL1R2, IRAK3, and THBD after fitting to one variable in the GSE60993 dataset.
Figure 6
Figure 6
Distribution and visualization of immune cell infiltration. (A) Comparison of 22 immune cell subtypes between acute myocardial infarction tissues and normal tissues. Blue and red colors represent normal and acute myocardial infarction samples, respectively. (B) Correlation matrix of all 22 immune cell subtype compositions. Both horizontal and vertical axes demonstrate immune cell subtypes. Immune cell subtype compositions (higher, lower, and same correlation levels are displayed in red, blue, and white, respectively).
Figure 7
Figure 7
Correlation between IL1R2 (A), IRAK3 (B), THBD (C), and infiltrating immune cells in acute myocardial infarction.

References

    1. Guo J, Liu HB, Sun C, Yan XQ, Hu J, Yu J, et al. . MicroRNA-155 promotes myocardial infarction-induced apoptosis by targeting RNA-binding protein QKI. Oxid Med Cell Longev. (2019) 2019:4579806. 10.1155/2019/4579806 - DOI - PMC - PubMed
    1. White HD, Chew DP. Acute myocardial infarction. Lancet. (2008) 372:570–84. 10.1016/S0140-6736(08)61237-4 - DOI - PubMed
    1. Gruzdeva O, Uchasova E, Dyleva Y, Belik E, Karetnikova V, Shilov A, et al. . Multivessel coronary artery disease, free fatty acids, oxidized LDL and its antibody in myocardial infarction. Lipids Health Dis. (2014) 13:111. 10.1186/1476-511X-13-111 - DOI - PMC - PubMed
    1. Gehani AA, Al-Hinai AT, Zubaid M, Almahmeed W, Hasani MR, Yusufali AH, et al. . Association of risk factors with acute myocardial infarction in Middle Eastern countries: the INTERHEART Middle East study. Eur J Prev Cardiol. (2014) 21:400–10. 10.1177/2047487312465525 - DOI - PubMed
    1. de Winter RJ, Koster RW, Sturk A, Sanders GT. Value of myoglobin, troponin T, and CK-MBmass in ruling out an acute myocardial infarction in the emergency room. Circulation. (1995) 92:3401–7. 10.1161/01.CIR.92.12.3401 - DOI - PubMed