

Comparison of temperature-mortality associations estimated with different exposure metrics
- PMID: 33195965
- PMCID: PMC7608890
- DOI: 10.1097/EE9.0000000000000072
Comparison of temperature-mortality associations estimated with different exposure metrics
Abstract
Studies of the short-term association between ambient temperature and mortality often use temperature observations from a single monitoring station, frequently located at the nearest airport, to represent the exposure of individuals living across large areas. Population-weighted temperature estimates constructed from gridded meteorological data may offer an opportunity to improve exposure assessment in locations where station observations do not fully capture the average exposure of the population of interest.
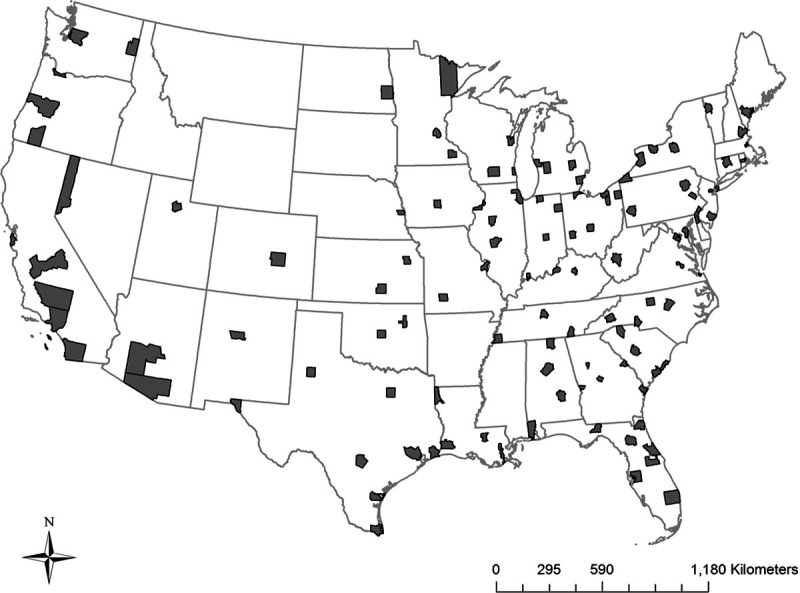
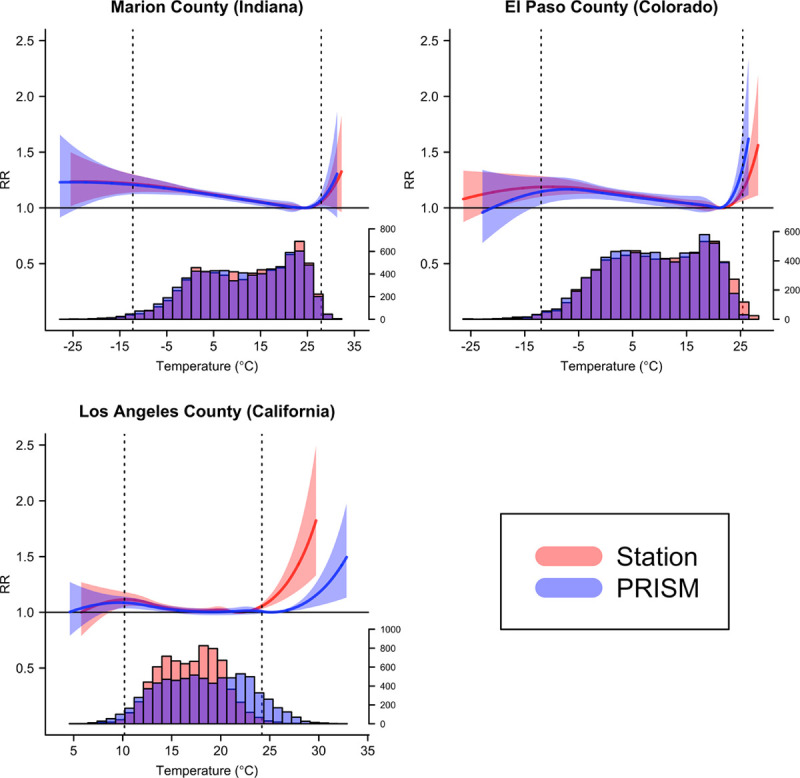
Methods: We compared the association between daily mean temperature and mortality in each of 113 United States counties using (1) temperature observations from a single weather station and (2) population-weighted temperature estimates constructed from a gridded meteorological dataset. We used distributed lag nonlinear models to estimate the 21-day cumulative association between temperature and mortality in each county, 1987-2006, adjusting for seasonal and long-term trends, day of week, and holidays.
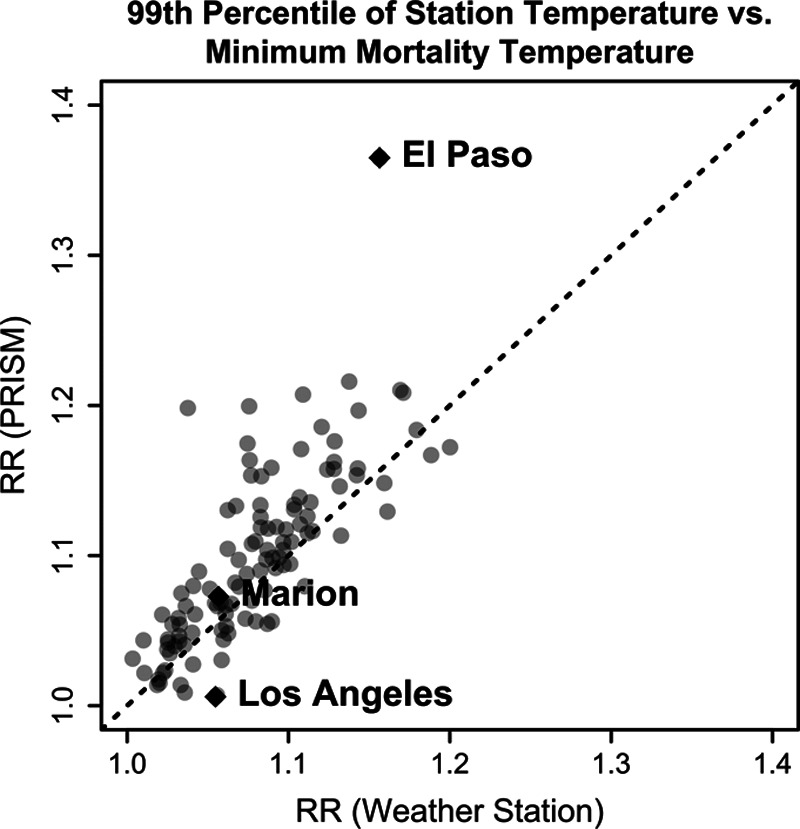
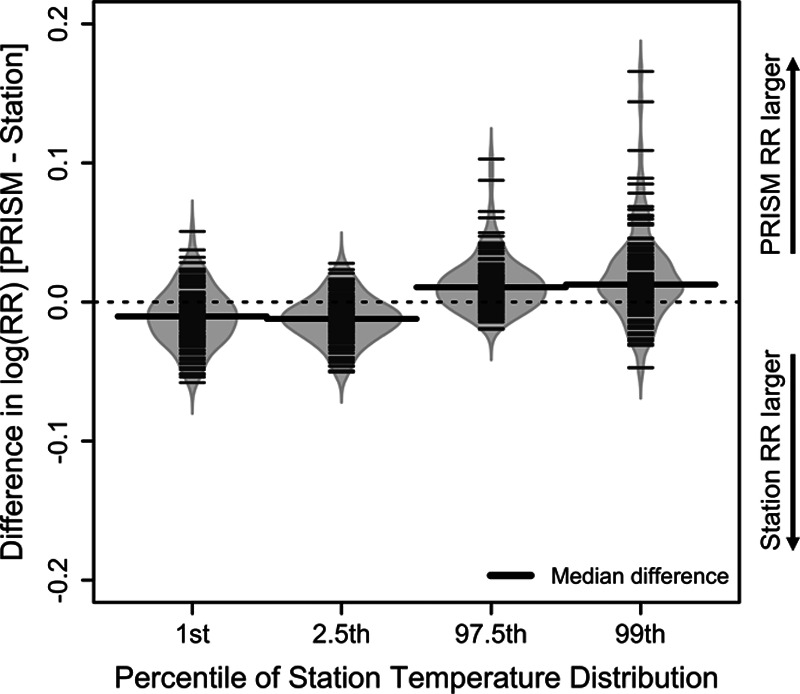
Results: In the majority (73.4%) of counties, the relative risk of death on extremely hot days (99th percentile of weather station temperature) versus the minimum mortality temperature was larger when generated from the population-weighted estimates. In contrast, relative risks on extremely cold days (first percentile of weather station temperature) were often larger when generated from the weather station observations. In most counties, the difference in associations estimated from the two temperature metrics was small.
Conclusions: In a large, multi-site analysis, temperature-mortality associations were largely similar when estimated from weather station observations versus population-weighted temperature estimates. However, spatially refined exposure data may be more appropriate for analyses seeking to elucidate local health effects.
Copyright © 2019 The Authors. Published by Wolters Kluwer Health, Inc. on behalf of Environmental Epidemiology. All rights reserved.
Conflict of interest statement
The authors declare that they have no conflicts of interest.
This work was supported by grants F32-ES027742, R01-ES029950, and P30-ES000002 from the National Institute of Environmental Health Sciences (NIEHS), NIH, and by the Institute at Brown for Environment and Society (IBES). The contents of this report are solely the responsibility of the authors and do not necessarily represent the official views of the sponsoring organizations.
Figures
References
-
- Schwartz J, Dockery DW, Neas LM. Is daily mortality associated specifically with fine particles? J Air Waste Manag Assoc 199646927–939 - PubMed
LinkOut - more resources
Full Text Sources