Integrated Genomic, Functional, and Prognostic Characterization of Atypical Chronic Myeloid Leukemia
- PMID: 33196013
- PMCID: PMC7655091
- DOI: 10.1097/HS9.0000000000000497
Integrated Genomic, Functional, and Prognostic Characterization of Atypical Chronic Myeloid Leukemia
Abstract
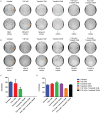
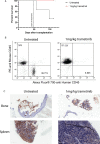
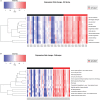
Atypical chronic myeloid leukemia (aCML) is a BCR-ABL1-negative clonal disorder, which belongs to the myelodysplastic/myeloproliferative group. This disease is characterized by recurrent somatic mutations in SETBP1, ASXL1 and ETNK1 genes, as well as high genetic heterogeneity, thus posing a great therapeutic challenge. To provide a comprehensive genomic characterization of aCML we applied a high-throughput sequencing strategy to 43 aCML samples, including both whole-exome and RNA-sequencing data. Our dataset identifies ASXL1, SETBP1, and ETNK1 as the most frequently mutated genes with a total of 43.2%, 29.7 and 16.2%, respectively. We characterized the clonal architecture of 7 aCML patients by means of colony assays and targeted resequencing. The results indicate that ETNK1 variants occur early in the clonal evolution history of aCML, while SETBP1 mutations often represent a late event. The presence of actionable mutations conferred both ex vivo and in vivo sensitivity to specific inhibitors with evidence of strong in vitro synergism in case of multiple targeting. In one patient, a clinical response was obtained. Stratification based on RNA-sequencing identified two different populations in terms of overall survival, and differential gene expression analysis identified 38 significantly overexpressed genes in the worse outcome group. Three genes correctly classified patients for overall survival.
Copyright © 2020 the Author(s). Published by Wolters Kluwer Health, Inc. on behalf of the European Hematology Association.
Conflict of interest statement
The authors declare no competing interests.
Figures


References
-
- Arber DA, Orazi A, Hasserjian R, et al. The 2016 revision to the World Health Organization classification of myeloid neoplasms and acute leukemia. Blood. 2016;127:2391–2405. - PubMed
-
- Vardiman JW, Bain B, Inbert M. Jaffe E, Harris NL, Stein H, Vardiman J, et al. Atypical chronic myeloid leukemia. WHO classification of tumors: pathology and genetics of tumours of haematopoietic and lymphoid tissues. Lyon: IARC Press; 2001;53–57.
-
- Oscier D. Atypical chronic myeloid leukemias. Pathologie-biologie. 1997;45:587–593. - PubMed
-
- Breccia M, Biondo F, Latagliata R, et al. Identification of risk factors in atypical chronic myeloid leukemia. Haematologica. 2006;91:1566–1568. - PubMed
-
- Cazzola M, Malcovati L, Invernizzi R. Myelodysplastic/myeloproliferative neoplasms. Hematol Am Soc Hematol Educ Program. 2011;1:264–272. - PubMed
